US30 H4 | Bearish drop offBased on the H4 chart analysis, we could see the price rise to the sell entry at 46,338.64, which is a pullback resistance that aligns with the 50% Fibonacci retracement and could drop from this level to the take profit.
Stop loss is at 46,676.09, which is a swing high resistance.
Take profit is at 45,762.38, which has been identified as an overlap support that lines up with the 50% Fibonacci retracement.
High Risk Investment Warning
Trading Forex/CFDs on margin carries a high level of risk and may not be suitable for all investors. Leverage can work against you.
Stratos Markets Limited (tradu.com ):
CFDs are complex instruments and come with a high risk of losing money rapidly due to leverage. 65% of retail investor accounts lose money when trading CFDs with this provider. You should consider whether you understand how CFDs work and whether you can afford to take the high risk of losing your money.
Stratos Europe Ltd (tradu.com ):
CFDs are complex instruments and come with a high risk of losing money rapidly due to leverage. 66% of retail investor accounts lose money when trading CFDs with this provider. You should consider whether you understand how CFDs work and whether you can afford to take the high risk of losing your money.
Stratos Global LLC (tradu.com ):
Losses can exceed deposits.
Please be advised that the information presented on TradingView is provided to Tradu (‘Company’, ‘we’) by a third-party provider (‘TFA Global Pte Ltd’). Please be reminded that you are solely responsible for the trading decisions on your account. There is a very high degree of risk involved in trading. Any information and/or content is intended entirely for research, educational and informational purposes only and does not constitute investment or consultation advice or investment strategy. The information is not tailored to the investment needs of any specific person and therefore does not involve a consideration of any of the investment objectives, financial situation or needs of any viewer that may receive it. Kindly also note that past performance is not a reliable indicator of future results. Actual results may differ materially from those anticipated in forward-looking or past performance statements. We assume no liability as to the accuracy or completeness of any of the information and/or content provided herein and the Company cannot be held responsible for any omission, mistake nor for any loss or damage including without limitation to any loss of profit which may arise from reliance on any information supplied by TFA Global Pte Ltd.
The speaker(s) is neither an employee, agent nor representative of Tradu and is therefore acting independently. The opinions given are their own, constitute general market commentary, and do not constitute the opinion or advice of Tradu or any form of personal or investment advice. Tradu neither endorses nor guarantees offerings of third-party speakers, nor is Tradu responsible for the content, veracity or opinions of third-party speakers, presenters or participants.
US30FU trade ideas

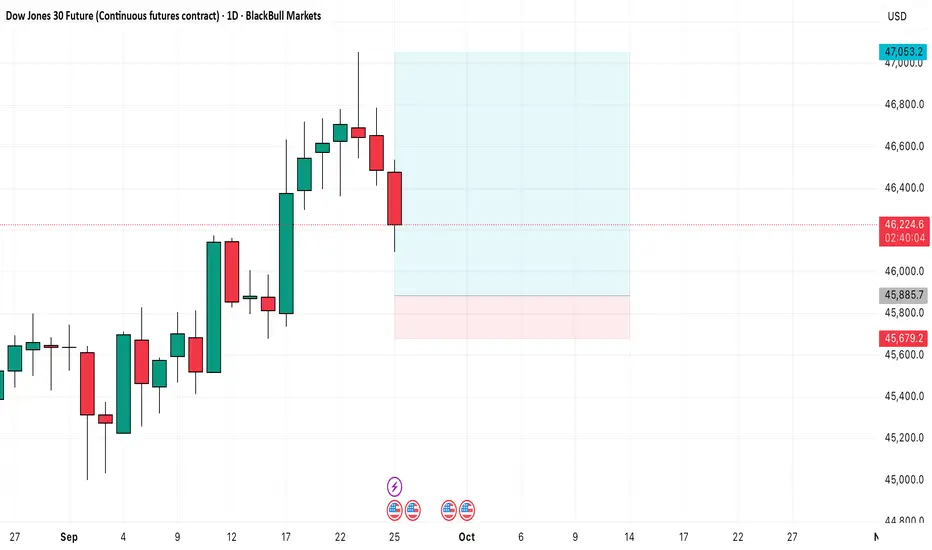
DOWFUT long setupDOWFUT long setup
Entry - 45885.7
Stop loss - 45679.2
Target - 47053.2
Risk Reward - 1:5.65
US30 ShortElite Strategy
Waiting price to come tap OB twice to confirm OB to TOB
Execute in smaller time frame
Targeting lower liquidity pools
Main target Structural liquidity
DJIA Long Position Dow Jones has broke and retested my Resistance which is the previous Higher High so now im anticipating a target at $50.000.

US30 LongElite Analysis
Discretionary Trade with Confirmations
Targeting Structural liquidity at the top
US 100Dow Jones ( DJI )
- Completed " 123 " Impulsive Waves
- Break of Structure
- Change of Characteristics
- Bullish Channel as an corrective pattern in Short Time Frame and Long Time Frame
- Resistance Level

uptrend It is expected that the resistance area will be broken and the continuation of the upward trend will be formed and will continue until the specified Fibonacci levels.
If the support area is broken, a continuation of the downtrend is possible.

US30 Analysis (Short Bias)I expect US30 to remain bearish this week. Current price action suggests weakness, with momentum favoring sellers. If market conditions hold, we may see a continuation to the downside, and today’s session is also likely to close bearish. A short position looks favorable at this point, but as always, risk management is key.
The last week’s predictions toyed with my analysis, but this week might just be the setup for a stronger sell opportunity.

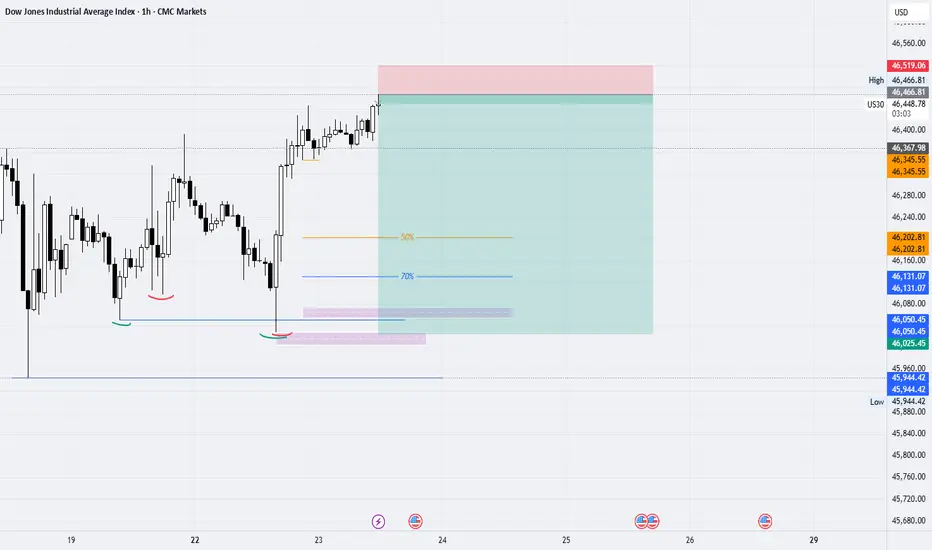
US30 - Pullback The Dow has been on a very aggressive bullish run but a pullback is due in my opinion. The volume has diminished will continue to drop before it continues to move on up.

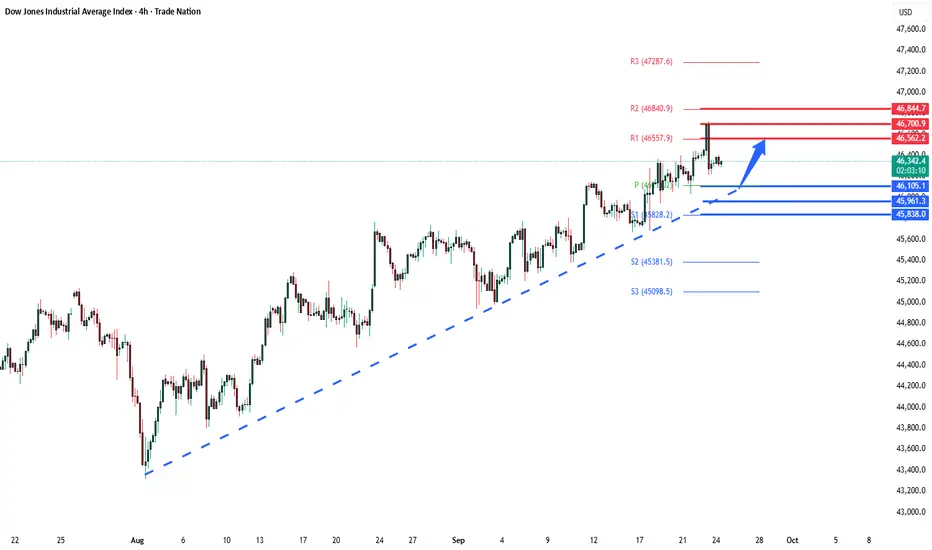
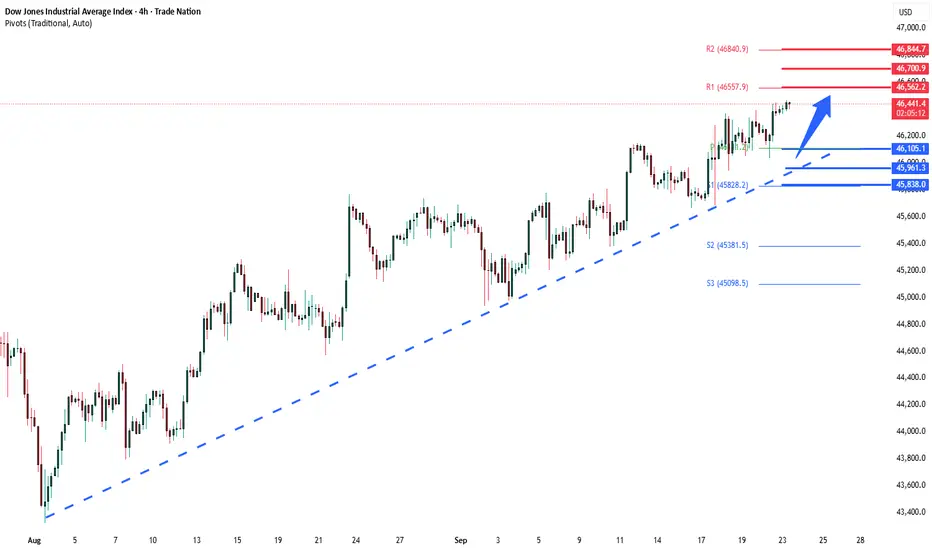
Dow overbought corrective pullback supported at 46100Key Support and Resistance Levels
Resistance Level 1: 46560
Resistance Level 2: 46700
Resistance Level 3: 46845
Support Level 1: 46100
Support Level 2: 45960
Support Level 3: 45840
This communication is for informational purposes only and should not be viewed as any form of recommendation as to a particular course of action or as investment advice. It is not intended as an offer or solicitation for the purchase or sale of any financial instrument or as an official confirmation of any transaction. Opinions, estimates and assumptions expressed herein are made as of the date of this communication and are subject to change without notice. This communication has been prepared based upon information, including market prices, data and other information, believed to be reliable; however, Trade Nation does not warrant its completeness or accuracy. All market prices and market data contained in or attached to this communication are indicative and subject to change without notice.
Short Position On Us30"Shorted Dow Jones ⚡ Risk managed. Once +100 pts hit, we go risk-free. Protect the bag, let the trade run. #TradingDiscipline #DowJones"
US30Success in forex and stocks comes from a combination of knowledge, discipline, and patience. Understanding market trends, economic factors, and company
fundamentals is crucial, but equally important is controlling emotions and sticking to a well-planned strategy. Continuous learning, adapting to changing conditions, and managing risk wisely can turn opportunities into consistent growth over time.
Consistency, not luck, separates successful traders from the rest.

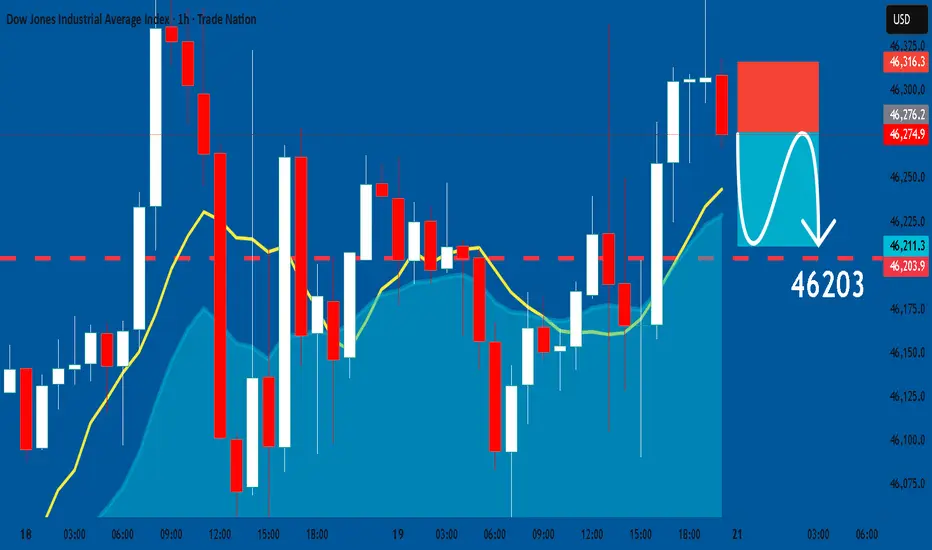
US30: Short Signal Explained
US30
- Classic bearish formation
- Our team expects pullback
SUGGESTED TRADE:
Swing Trade
Short US30
Entry - 46276
Sl - 46316
Tp - 46203
Our Risk - 1%
Start protection of your profits from lower levels
Disclosure: I am part of Trade Nation's Influencer program and receive a monthly fee for using their TradingView charts in my analysis.
❤️ Please, support our work with like & comment! ❤️
US30 4H🔹 Overall Outlook and Potential Price Movements
In the charts above, we have outlined the overall outlook and possible price movement paths.
As shown, each analysis highlights a key support or resistance zone near the current market price. The market’s reaction to these zones — whether a breakout or rejection — will likely determine the next direction of the price toward the specified levels.
⚠️ Important Note:
The purpose of these trading perspectives is to identify key upcoming price levels and assess potential market reactions. The provided analyses are not trading signals in any way.
✅ Recommendation for Use:
To make effective use of these analyses, it is advised to manually draw the marked zones on your chart. Then, on the 15-minute time frame, monitor the candlestick behavior and look for valid entry triggers before making any trading decisions.

US30 - Buy - RR 2:1Price is being at a H4 demand zone with a lot of buy orders waiting to be triggered. Ready for the move up high

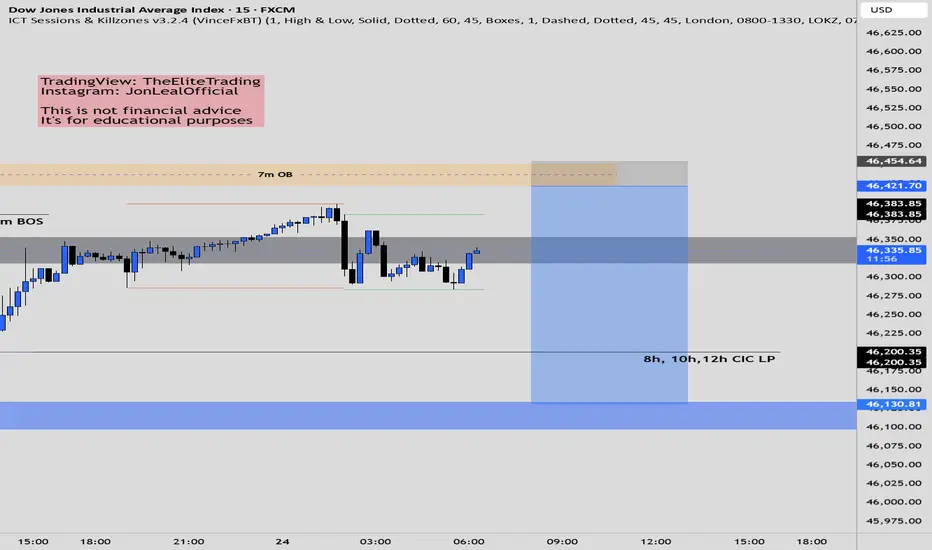
Us30 Trade Set Up Sep 25 2025Price is now in a bearish trend making LH/LL and has broken PDL but is approaching a SSL so if price sweeps it, closes above and making internal structure creating 1m IFVG/CISD i will look for buys to the 1h FVG, and is it trades through the 1h FVG the end target will be 50% of the 4h FVG. But if prices respects the 1h FVG, I will look for bearish structure from there to continue lower
www.tradingview.com

DowJones Key support at 46100Key Support and Resistance Levels
Resistance Level 1: 46560
Resistance Level 2: 46700
Resistance Level 3: 46845
Support Level 1: 46100
Support Level 2: 45960
Support Level 3: 45840
This communication is for informational purposes only and should not be viewed as any form of recommendation as to a particular course of action or as investment advice. It is not intended as an offer or solicitation for the purchase or sale of any financial instrument or as an official confirmation of any transaction. Opinions, estimates and assumptions expressed herein are made as of the date of this communication and are subject to change without notice. This communication has been prepared based upon information, including market prices, data and other information, believed to be reliable; however, Trade Nation does not warrant its completeness or accuracy. All market prices and market data contained in or attached to this communication are indicative and subject to change without notice.
BEARISH ESCENARIO15m chart accumulation forming right now, expecting a sweep of liquidity to the upside tomorrow.

US30 Price Consolidation a Top Resistance The Dow Jones (US30) is currently consolidating around the 45,900 support level as traders position ahead of the upcoming Federal Reserve rate decision later this week. but the real driver of volatility will be Chair Powell’s forward guidance—particularly his tone on
Technical View
A break and close above 46,500 could open the path toward 47,000–47,200, while failure to hold 45,900 risks a pullback toward 45,500.
You may find more details in the chart.
Trade wisely best of Luck.
Ps; Support with like and comments for better analysis Thanks for Supporting.

US30 ShortElite Analysis
All confirmations met
Executed late
Elite execution TOB marked by orange rectangle

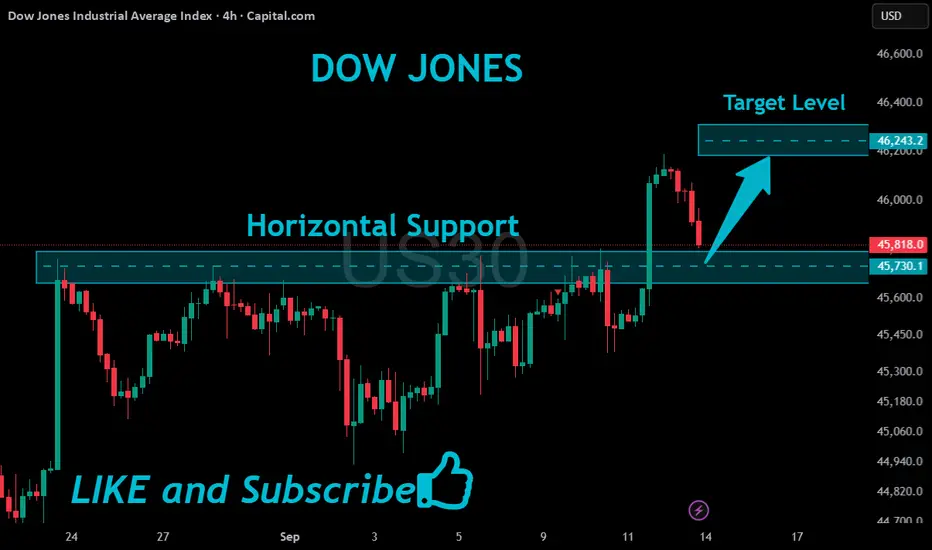
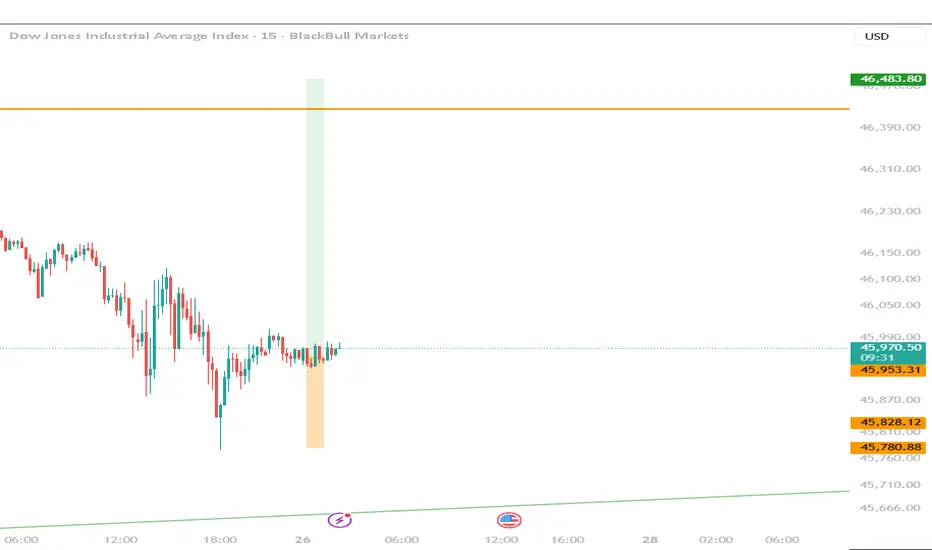
US30 In Support Below!
HI,Traders !
#US30 is trading in an
Uptrend and is
Now making a local bearish
Correction to retest the
Horizontal support below
Around 45730.1 from where
We will be expecting a
Further bullish move up !
Comment and subscribe to help us grow !