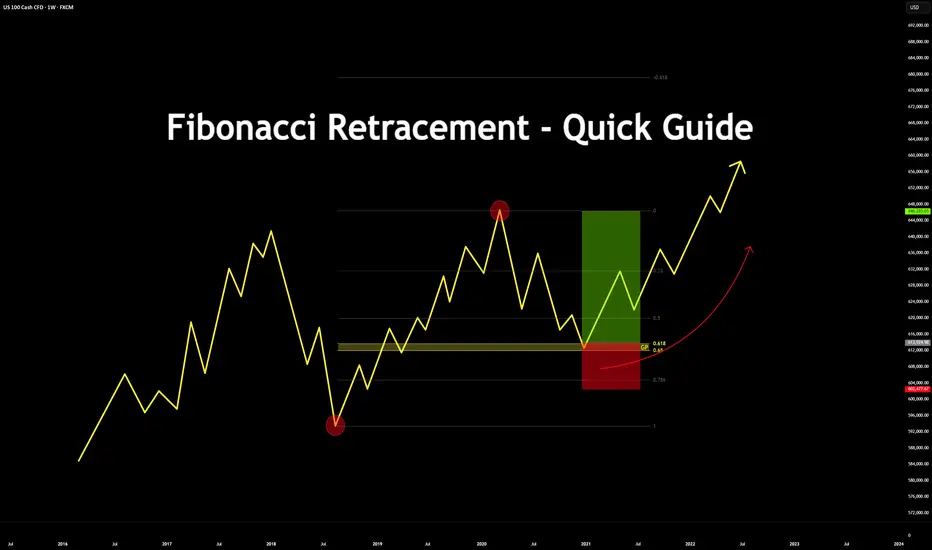
Fibonacci Retracement - Quick Guide in 5 StepsTrading the Fibonacci Retracement - Quick Guide in 5 Steps.
What is the Fibonacci tool?
The Fib Retracement Tool is a tool used widely across many charts. From crypto to stocks.
It assists in identifying the Golden Pocket, along with any potential Support and Resistance zones based on the sequence in Fibonacci.
Investors & Traders draw it from a previous high/low or low/high.
On a chart, each key level shows where price might pause or reverse during a pull back, before it continues the trend.
In this guide you will learn how to use the Fibonacci tool in 5 steps.
1. Configurations
Open up your Fib Retracement Tool's settings, apply the below configurations.
(You can change the color to your choice)
2. Identify High/Low's
Identify, recent highs and lows of your current chart/pair.
3. Applying Fib Retracement
Select your Fib Retracement tool. Place it on your chart starting from the swing low to the swing high.
4. Once completed
Highlight the Golden Pocket Field in the zone (0.65-0.618)
5. Review Entry
Price will eventually make it's way back down to the Golden Pocket to retest and reverse.
SL Placement would be on a previous low or key level, TP placement would be at a previous high or key level.
Bonus:
See the real time example below:
Please like, comment and follow if this guide was useful to you.
If you have any requests on analysis or tutorial requests, let me know and I'll be happy to make one!
Trade ideas
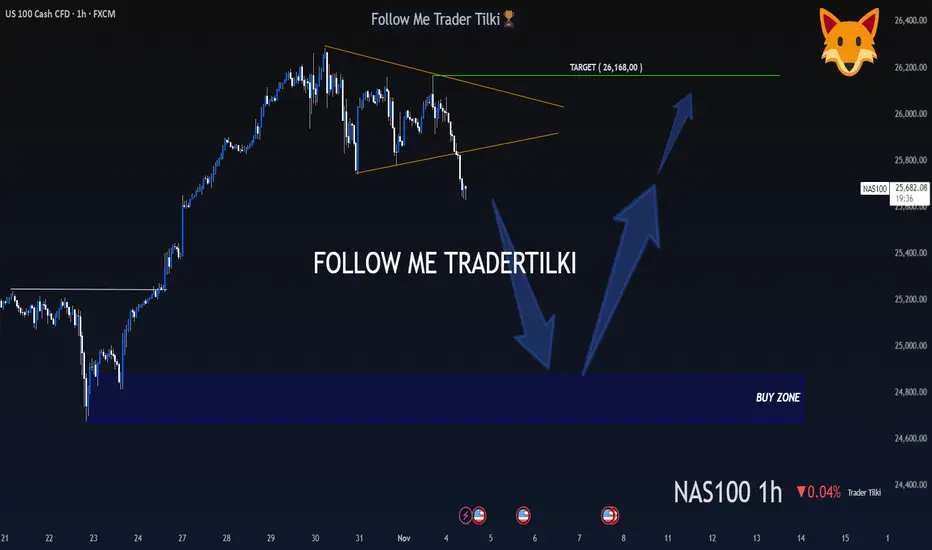
A Hunter Waits Patiently, Then Strikes Like a Lion - US100 - 1HMy dear friends, greetings,
My friends, I have set the buy levels for US100 at 24,872 and 24,677.
I will never enter a trade or put myself at unnecessary risk before these levels are reached.
My friends, in order to consistently win in this market and to become a successful trader, patience is essential.
If you act with patience and strategy, you will always be a winning trader, just like me.
I would also like you to know that my target is set at the 26,168 level.
My friends, every single like from you is my greatest motivation to share these analyses.
I sincerely thank everyone who supports me with their appreciation.
With my respect and love.
NASDAQ is Nearing an Important Resistance Line.Hey traders, in tomorrow's trading session we are monitoring NAS100 for a selling opportunity around 25,500 zone, NASDAQ is trading in a downtrend and currently is in a correction phase in which it is approaching the trend at 25,500 support and resistance area.
Trade safe, Joe.

NSDQ100 key trading levelsKey Support and Resistance Levels
Resistance Level 1: 25180
Resistance Level 2: 25300
Resistance Level 3: 25500
Support Level 1: 24655
Support Level 2: 24490
Support Level 3: 24330
This communication is for informational purposes only and should not be viewed as any form of recommendation as to a particular course of action or as investment advice. It is not intended as an offer or solicitation for the purchase or sale of any financial instrument or as an official confirmation of any transaction. Opinions, estimates and assumptions expressed herein are made as of the date of this communication and are subject to change without notice. This communication has been prepared based upon information, including market prices, data and other information, believed to be reliable; however, Trade Nation does not warrant its completeness or accuracy. All market prices and market data contained in or attached to this communication are indicative and subject to change without notice.

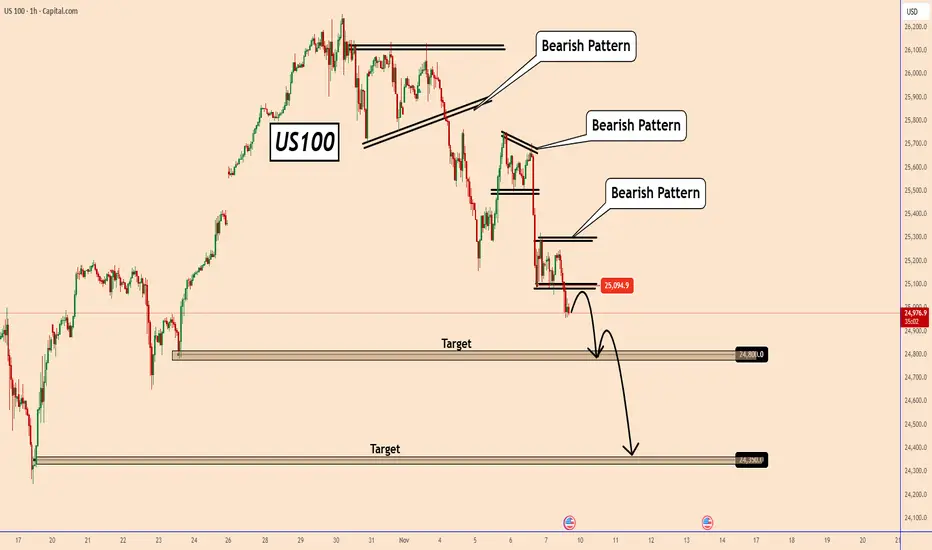
US100: Ready To Start a Downward Move?US100: Ready To Start a Downward Move?
A few days ago I posted an bullish forecast for US100.
US100 couldn't manage to break above the triangle pattern, and the price turned bearish.
Currently, we can see several bearish patterns one after the other. This sell-off started yesterday and may continue further in the coming days.
It could be related to earnings reports, AI bubble fears, etc. However, all indices were also heavily overvalued.
If the price respects this new bearish structure, we could see US100 falling to 24800 and 24350 first.
I will keep you all updated.
You may find more details in the chart!
Thank you and Good Luck!
❤️PS: Please support with a like or comment if you find this analysis useful for your trading day❤️
USNAS1OO Appear Breakout phase, with bullish pressure building.The USNAS100 (NASDAQ 100) appears to be in a consolidation-to-breakout phase, with bullish pressure building.
U.S. stock index futures are advancing on Monday following positive developments in Washington toward ending the U.S. government shutdown the prolonged shutdown had delayed key economic data releases and increased uncertainty over growth. Renewed optimism for resolution has improved risk sentiment, prompting buying momentum in equity futures.
If price sustains above 25,000 and momentum continues, bulls could “shut down” the recent NASDAQ decline by pushing toward 25,750 – 26,005 a strong breakout with volume could trigger further upside toward 26,250–26,500, aligning with the next major resistance zone.
You may find more details in the chart,
Trade wisely best of Luck Buddies.
Ps; Support with like and comments for better analysis Thanks for Supporting.

USNAS100 | Bearish Bias Holds Below 26,180 Ahead of Key DataUSNAS100 – MARKET OUTLOOK | Testing Pivot Zone, Awaiting Breakout 🇺🇸
The NASDAQ 100 is testing the pivot zone at 26,095–26,180, with momentum still bearish as long as it trades below this range.
🔽 Below 26,180: Bearish bias toward 25,890 → 25,700 → 25,340.
🔼 Above 26,180: Bullish reversal toward 26,500 → 26,850.
Pivot Zone: 26,095–26,180
Support: 25,890 · 25,700 · 25,350
Resistance: 26,320 · 26,500 · 26,850
USNAS100 remains bearish below 26,180, but a confirmed break above this level could signal the start of a new bullish leg.

US100 Reversal Map – Hull MA + Heikin Ashi Confirmation🧠 US100 / NASDAQ100 Profit Pathway Setup — The Thief’s Bullish Escape Plan! 💰🚀
📊 Market Bias: Bullish (Day Trade Setup)
The Thief Trader has spotted a golden pathway in the NASDAQ100 (US100)!
Here’s the breakdown of the plan — straight from the thief’s vault 🕵️♂️📈
🎯 Plan Overview
Bias: Bullish continuation confirmed
Technical Confirmation:
✅ Double Pullback on Hull Moving Average
✅ Retest Zone successfully defended
✅ Heikin Ashi Bullish Doji signaled a trend reversal confirmation
💡 Momentum is shifting upward — the trend has officially changed!
💎 Entry Strategy (Layered Thief Style)
The Thief Strategy applies a layered entry method — multiple buy limits to average into strength.
📥 Buy Limit Layers:
25,300
25,400
25,500
25,600
(Traders can adjust or add more layers based on risk appetite and confirmation zones.)
🛡️ Stop-Loss Setup
This is the Thief SL @ 25,100
⚠️ Note to Thief OG’s:
I’m not recommending my SL as your SL — always customize risk and secure your own bag. Manage your position with discipline and independence! 💼
🎯 Take-Profit Zone
Target: 26,200
🚨 The Police Barricade Zone acts as a strong resistance — overbought levels spotted and potential bull trap alert!
Kindly exit with profit before the officers arrive. 😎
⚠️ Note: Profit-taking is at your discretion. Book and Run!
📈 Related Pairs to Watch (Correlation Insight)
NASDAQ:NDX / CAPITALCOM:US100 / NASDAQ:QQQ : All mirror NASDAQ movement.
SP:SPX / AMEX:SPY : Often correlate with NASDAQ’s momentum (watch divergence for clues).
TVC:VIX : If volatility spikes, expect pullbacks on tech-heavy indices.
TVC:DXY : A weak dollar often fuels US100 bullish legs — keep an eye on it.
NASDAQ:AAPL / NASDAQ:MSFT / NASDAQ:NVDA : Leading drivers of NASDAQ — if they pump, the index follows. 💪
🧩 Key Insights
Hull MA alignment confirms momentum shift.
Retest + bullish Heikin Ashi Doji = market reversal confirmation.
Layered entries give flexibility in volatile intraday conditions.
Dynamic risk management is key — never marry a position.
✨ “If you find value in my analysis, a 👍 and 🚀 boost is much appreciated — it helps me share more setups with the community!”
#US100 #NASDAQ100 #ThiefTrader #DayTrading #IndexTrading #HullMA #HeikinAshi #LayeredEntries #TechnicalAnalysis #TradingSetup #PriceAction #MarketReversal #TradingCommunity #BullishPlan #SmartMoneyFlow #TradeIdeas #ThiefStrategy

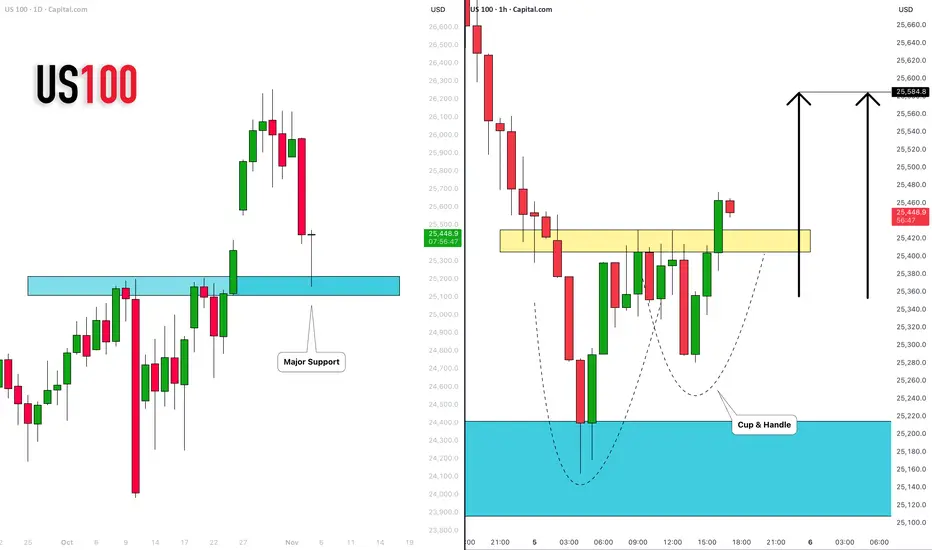
NASDAQ INDEX (US100): Time to Recover
US100 index dropped yesterday, as I predicted.
The market is recovering now, after a test of a major daily support cluster.
A formation of a cup & handle pattern on that and a breakout of its neckline
indicate a strong buying pressure.
With a high probability, the market will rise and reach 25580 level soon.
❤️Please, support my work with like, thank you!❤️
I am part of Trade Nation's Influencer program and receive a monthly fee for using their TradingView charts in my analysis.
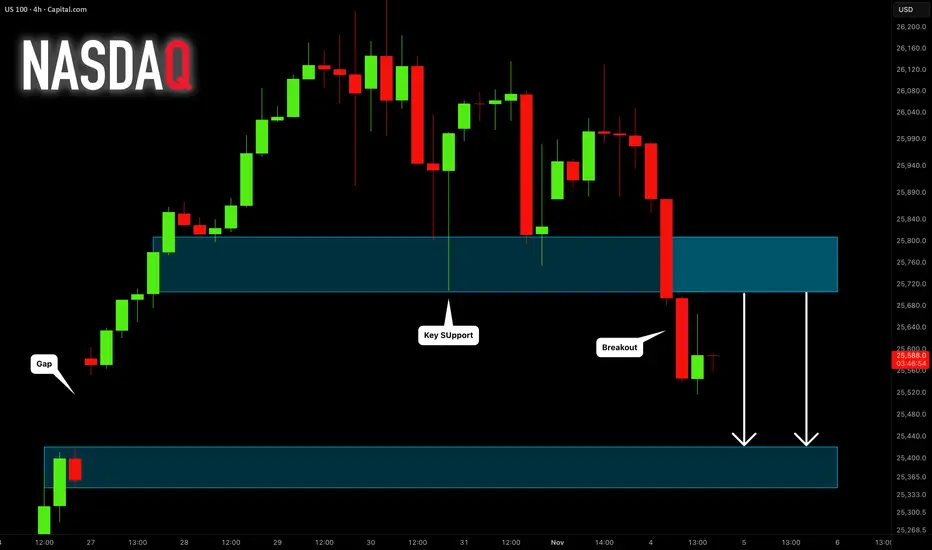
NASDAQ INDEX (US100): Forgotten Gap
A week ago, US100 formed a gap up opening.
It looks like the index is finally ready to fill it.
A breakout of a major horizontal support is a strong bearish signal.
Expect a bearish continuation to 25420.
❤️Please, support my work with like, thank you!❤️
I am part of Trade Nation's Influencer program and receive a monthly fee for using their TradingView charts in my analysis.
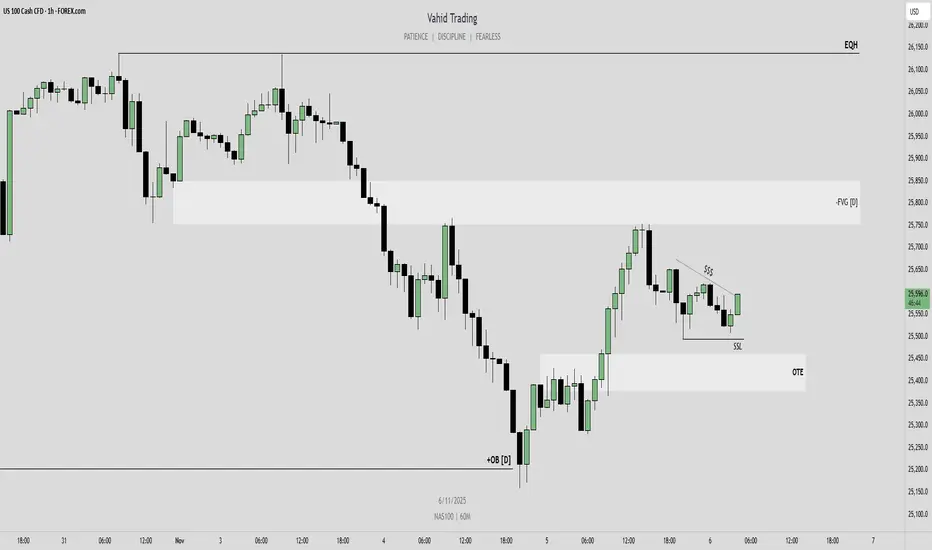
US100 – Bullish Continuation in Play After Daily OB ReactionHello traders,
On the 1-hour chart, NASDAQ (US100) has reacted strongly from the bullish Daily Order Block, showing clear signs of higher-timeframe strength. This reaction suggests that the bullish order flow is still intact.
With this structure in mind, I expect the upward move to continue toward the bearish Daily Fair Value Gap, which serves as my first target.
My final target for this bullish leg is the equal highs around 26,136, where a significant liquidity pool rests.
However, before the next expansion higher, I would prefer to see price move lower to sweep the liquidity below the recent lows and trade into an Optimal Trade Entry (OTE) zone. From there, I’ll look for lower-timeframe confirmation to catch the next leg up.
Staying bullish unless higher-timeframe invalidation occurs.
💌It is my honor to share your comments with me💌
🔎 DYOR
💡Wait for the update!
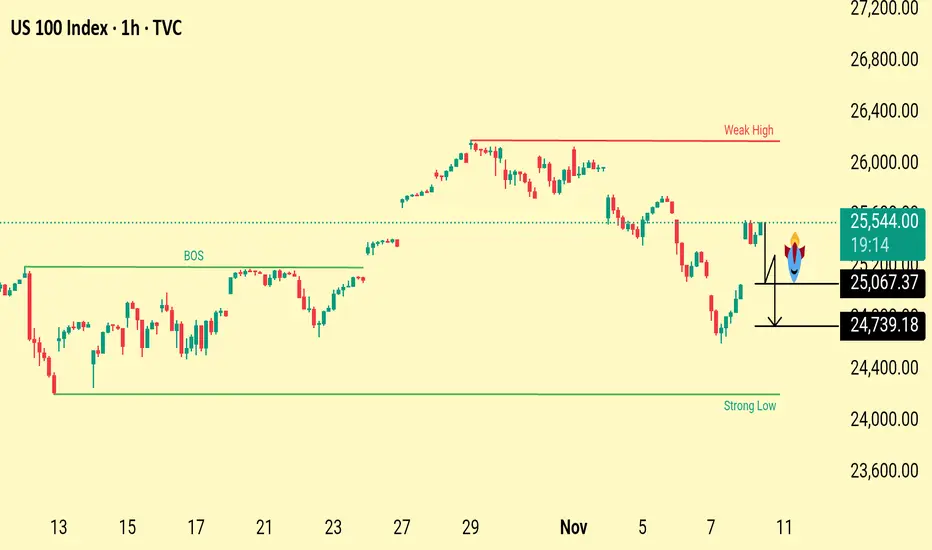
US100 Price Action Outlook Weak High Target&Liquidity SweepZonesThe chart highlights a weak high above current price action, suggesting potential upside liquidity targets. Below, key downside levels at 25,067 and 24,739 mark liquidity pools and possible retracement zones if price rejects current resistance. The structure shows a recent break of structure with both bullish and bearish scenarios in play.
Price is reacting near a resistance area after a recent bounce. The weak high above suggests liquidity may be targeted before any reversal. If price rejects this zone, the next downside levels to watch are 25,067 and 24,739, where liquidity sits and buyers may step in. Structure remains mixed, with both upward liquidity grabs and potential pullbacks likely
NASDAQ BullishThe NASDAQ is currently reacting at a key daily market structure level.
Heading into the New York session, I’m anticipating a potential sweep of sell-side liquidity levels before price shifts upward, possibly targeting new all-time highs
#NASDAQ #US100 #Indices #TechnicalAnalysis #TradingView

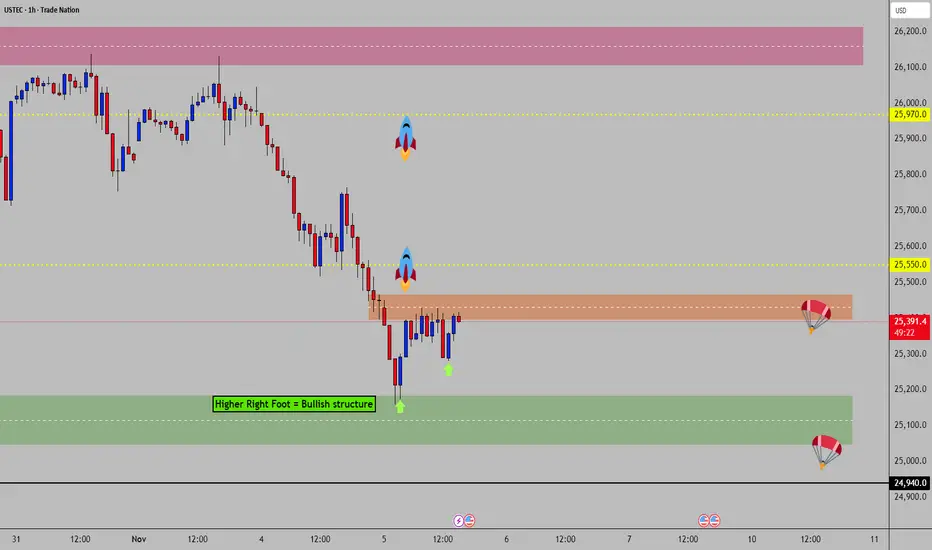
NAS100 - Bullish Structure in Progress @ Demand AreaDear friends in trading,
🎯Bullish structure in progress...
🎯If price breach and hold above 25470 it can potentially launch a rally to 25970.
❌ It can also fail and fall back to demand area - watch 25300 (2HR candle)
🔑Kindly see our profile for your exclusive weekly updates.⚜️⚜️
🙏🏻Thank you in advance for your continued support.
NAS100 SELL SIGNALWait for price to reach AOI & wait for rejection. Go on lower timeframes to confirm CHOCH. Wait for a signal of sellers coming in (bearish engulfing - maybe) then enter SELLS.

NASDAQ Excellent rebound on the 1D MA50. Bullish.Nasdaq (NDX) has been trading within a 6-month Channel Up and last Friday made another 1D MA50 (blue trend-line) test exactly at the bottom (Higher Lows trend-line) of the pattern, and rebounded.
This has market the last two bottoms of the Channel Up and kickstarted the Bullish Legs, which have both been at +9.59%. As you realize, this it technically the pattern's strongest Support and most optimal buy entry for the medium-term.
We expect at least another +9.59% rally on the emerging Bullish Leg, targeting 26950.
-------------------------------------------------------------------------------
** Please LIKE 👍, FOLLOW ✅, SHARE 🙌 and COMMENT ✍ if you enjoy this idea! Also share your ideas and charts in the comments section below! This is best way to keep it relevant, support us, keep the content here free and allow the idea to reach as many people as possible. **
-------------------------------------------------------------------------------
💸💸💸💸💸💸
👇 👇 👇 👇 👇 👇

US100 Free Signal! Buy!
Hello,Traders!
US100 Price has retraced back into a premium supply area after internal liquidity sweep. Smart money is likely to reprice lower, targeting inefficiency and equal lows beneath the recent range.
---------------------
Stop Loss: 25,256$
Take Profit: 24,951$
Entry Level: 25,133$
Time Frame: 3H
---------------------
Sell!
Comment and subscribe to help us grow!
Check out other forecasts below too!
Disclosure: I am part of Trade Nation's Influencer program and receive a monthly fee for using their TradingView charts in my analysis.

NAS100 Trade Set Up Nov 4 2025Price is bearish making LH/LL on the 1h and 15m, has already swept BSL/London highs and inverted 15m FVG so i will be looking for sells down to SSL/London lows

Nasdaq long then short: Expecting one last wave upIn this analysis, I talk about the wave structure for Nasdaq and highlighted that wave 1 is currently the longest wave and that means wave 5 cannot be longer than wave 3. This gives us a maximum target of 26300 that is already hit on 30th Oct. So while I do expect another up wave for Nasdaq, this will likely be a double top with the same high as 30th Oct before we start on a longer-term move down.


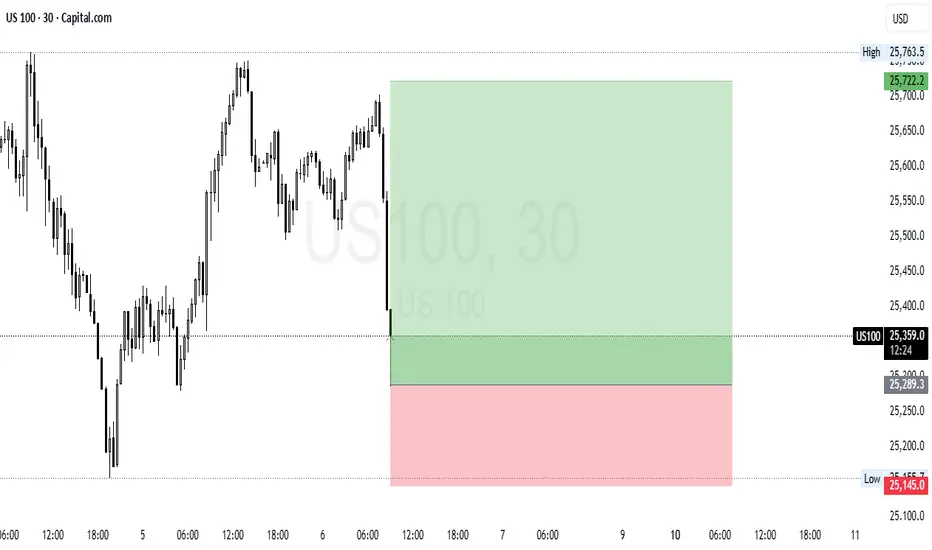
US100 (NASDAQ 100) Long SetupAnalysis:
The market formed a strong bullish leg earlier and is now pulling back to retest a key support zone around 25,300. If price holds this level and shows bullish confirmation (e.g., bullish engulfing or structure break), we could see continuation to the upside.
Bias: Bullish above 25,300
Invalidation: Break below 25,145
Setup Type: Long Position
Entry: Around 25,300 (support retest)
Stop Loss: 25,145
Target: 25,720+
#US100 #NASDAQ100 #PriceAction #TradingSetup #TechnicalAnalysis #ChartAnalysis #BuySetup #TradingView #SmartMoney #Forex #Indices
NAS100 1500 pips secured!Set up played out perfectly, breaking structure to during London session, sweep BSL, followed by internal IFVG to target 1500 pips

NAS100 Bullish divergence on 1HNAS100 is showing a Bullish divergence in RSI in a 1H chart. This can be confirmed if the neckline breaks the LH at around 25270 points.
