NAS100 Berish FlagThere is a double top rejection currently at play on H1 and a bearish flag on M15.
A break out and retest of this flag will provide safer and a higher probability setup.
Trade ideas

US NAS 100Preferably suitable for scalping and accurate as long as you watch carefully the price action with the drawn areas.
With your likes and comments, you give me enough energy to provide the best analysis on an ongoing basis.
And if you needed any analysis that was not on the page, you can ask me with a comment or a personal message.
Enjoy Trading ;)

US100US100 is in bearish trend.
Potentially printing LH and LL.
No sign of reversal .
Alligator mouth open which also confirm trend will go down.
We sell at CMP.


NSDQ100 relief rally led by mega-cap tech.Nasdaq 100 Trading Summary
Tech sentiment has rebounded strongly after upbeat earnings from Amazon and Apple, reversing much of yesterday’s selloff.
Amazon (+13% pre-market): Cloud revenue up +20% y/y, fastest growth since 2022 — a major boost for one of the year’s weakest Mag-7 names.
Apple (+2% pre-market): Forecasts 10–12% revenue growth this quarter (vs +6% expected), driven by stronger iPhone demand.
US futures: Nasdaq +1.2%, S&P 500 +0.65%, erasing most of Thursday’s losses.
Yesterday’s decline stemmed from AI-capex worries after Meta (-11.3%) and Nvidia (-2%) fell on spending and China-sales concerns. Those fears are easing as investors refocus on strong earnings and resilient demand.
Other Headlines
Universal Music beat estimates on subscription revenue, supporting consumer-discretionary sentiment.
Beverage giants continue to struggle — $830 bn in market value lost since 2021 amid shifting habits and tariffs.
UK retail: Growing backlash against chatbots may be hurting sales by billions, highlighting limits of AI adoption.
Outlook
Nasdaq 100 looks set for a relief rally led by mega-cap tech.
Focus today: follow-through buying in Amazon and Apple, stabilization in AI names (Meta, Nvidia), and overall positioning into month-end and key US inflation data later in the day.
This communication is for informational purposes only and should not be viewed as any form of recommendation as to a particular course of action or as investment advice. It is not intended as an offer or solicitation for the purchase or sale of any financial instrument or as an official confirmation of any transaction. Opinions, estimates and assumptions expressed herein are made as of the date of this communication and are subject to change without notice. This communication has been prepared based upon information, including market prices, data and other information, believed to be reliable; however, Trade Nation does not warrant its completeness or accuracy. All market prices and market data contained in or attached to this communication are indicative and subject to change without notice.

US100 MARKET OUTLOOK!US100 had a sharp drop in price recently from in yesterday’s trading session. From the H4 perspective , we’re beginning to see a bearish momentum kick in. I’m looking forward to seeing more price drops. Therefore, a sell opportunity is envisaged.

NAS100 Trade Set Up Oct 30 2025Price is making LH/LL on the 15m and 1h so i am bearish but first i either want to see a pullback into 1h CISD to then look for internal structure to continue down but if price first sweep PDL and/or EQL, i will look for short buys back up before looking for sells back down

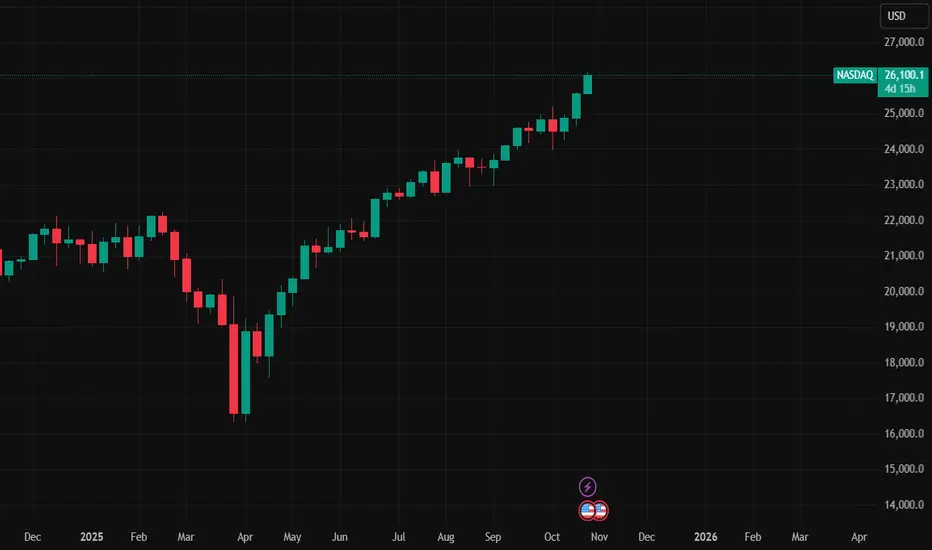
Sell in NasdaqUpdated Nasdaq Market Analysis (as of October 28, 2025 – Current Price: 25,809)
Current Price: Nasdaq Composite (^IXIC) at 25,809
Intraday Change: Up +1,605 points (+6.63%) from prior close (~24,204)
Context: This marks an explosive breakout, shattering all-time highs with the strongest single-day surge in over a year. The move is driven by blowout earnings from Nvidia (NVDA), Microsoft (MSFT), and Meta (META), reigniting AI frenzy, alongside dovish Fed signals and U.S.-China trade thaw rumors.
Despite the euphoria, this is a textbook “sell the news” top — and 25,809 is an ideal short entry. Here’s why:
Why It’s a Strong Sell at 25,809
1. Extreme Overbought Conditions (Technical Exhaustion)
• RSI (14-day): 92+ → Highest since March 2000 (dot-com peak).
Anything above 80 is extreme; 90+ is a screaming reversal signal.
• Distance from 200-day MA: Now +22% above — the most extended in 25 years.
• Bollinger Bands: Price 3+ standard deviations above the 20-day mean — a classic “blow-off top” pattern.
• Volume Spike + Distribution: Today’s volume is 2.5x average, but declining stocks outnumber advancers 1.8:1 beneath the surface — institutional selling into strength.
Verdict: This is not sustainable momentum — it’s FOMO capitulation.
2. Valuations at Absurd Levels
Metric
Current
Historical Avg
Implication
Nasdaq Forward P/E
42.1x
25x
Priced for perfection
Price-to-Sales (NDX)
9.8x
4.5x
AI hype detached from revenue
Nvidia P/E
78x FY26
35x (growth stocks)
One miss = 30% drop
Even if AI growth continues, the market has already priced in 5+ years of flawless execution.
3. Earnings “Sell the News” Setup
• Nvidia: Beat estimates by 12%, but guidance only in-line — no upside surprise.
• Microsoft/Azure: Growth slowed from 33% → 29% YoY — first deceleration in 2 years.
• Options Flow: Massive call unwinds post-earnings → smart money taking profits.
History: 8 of the last 10 times Nasdaq surged >5% in a day on earnings, it corrected 7–15% within 2 weeks.
4. Macro & Event Risks Clustering
Event
Date
Risk
U.S. Elections
Nov 5
Policy uncertainty (tariffs, regulation)
Fed Meeting
Oct 29–30
Dovish cut already priced in — hawkish surprise risk
CPI (Oct)
Nov 13
Sticky inflation → rate cut delay
China Stimulus Fade
Q4
Early 2025 growth slowdown
Risk-on sentiment is at peak — any disappointment triggers rotation out of tech.
5. Sentiment & Positioning Extremes
• CFTC Data: Speculative net longs at all-time highs.
• AAII Bull-Bear Spread: +48% (top 5% historically).
• X (Twitter) Sentiment: “Nasdaq to 30,000” trending — contrarian sell signal.
Everyone is in → No one left to buy.
Trading Signal: SELL (Short) Nasdaq at 25,809
Entry
25,809 (current) or on bounce to 25,900–26,000
Target 1
24,500 (-5%)
Target 2
23,800 (-8%) – 50-day MA
Stretch Target
22,000 (-15%) – 200-day MA
Stop-Loss
26,300 (above psychological 26k)
Risk/Reward
1:3 to 1:5
Execution Options:
• Short Nasdaq Futures (/NQ) or Inverse ETFs (SQQQ, PSQ)
• Put Options: NDX Dec 25,000 puts (high liquidity, defined risk)
• Trailing Stop: Use 1.5% ATR (~400 pts) or previous day’s low
Why Now Is the Perfect Sell
• Parabolic move complete — check
• Earnings catalyst exhausted — check
• Valuations unsustainable — check
• Everyone bullish — check
• Major events ahead — check
This is the top of the AI bubble Phase 1.
The next 5–10% down will be fast and violent — sell strength, don’t chase.
Final Note: Long-term, AI and tech remain dominant. But 25,809 is a generational shorting opportunity. Lock in gains, raise cash, and prepare to buy the dip at 22,000–23,000.
Position sizing: Max 2–3% risk per trade. Use stops religiously.
Monitor: Fed statement (Oct 30), U.S. election polls, China PMI (Oct 31).
NASDAQ Watching 24,975 for Fresh Bounce in Ongoing UptrendHey Traders,
In tomorrow’s trading session, we are monitoring NAS100 for a buying opportunity around the 24,975 zone. NASDAQ remains in a broader uptrend and is currently undergoing a healthy correction, approaching the key 24,975 support and resistance area that aligns with the ascending trend structure.
If buyers step in at this level, we could see a continuation of the bullish momentum in line with the prevailing trend.
Trade safe,
Joe

NasDaq Short NasDaq will be selling tomorrow, it will accumulate tonight and make a move tomorrow for short.

NAS100 Trade Set Up Nov 5 2025Price remains under bearish pressure as long as price respects this 4h FVG i will look for internal bearish structure on the 1m-5m to take sells to SSL/Asia lows

NAS BEARISH SETUP As the price continues to trade above 25. Price has met resistance at 26.2 and is about to test it again forming a double top on new resistance

NAS100 (1H) Market Outlook📈 NAS100 (1H) Market Outlook
NASDAQ is approaching a major resistance zone, with price currently extending within the upper boundary of a rising channel.
We may see a short-term bullish continuation into the top trendline, followed by a potential corrective drop back toward the 25,300–25,400 demand zone.
🧭 Key Levels:
🟥 Resistance Zone: 26,100 – 26,200
🟩 Support Zone: 25,300 – 25,400
⚙️ Potential setup: Wait for rejection confirmation before short entry.
📊 Market structure remains bullish overall, but extended exhaustion near the top trendline could trigger a pullback before continuation.
✨ Precision. Patience. Profit.
#NAS100 #US100 #IndexTrading #Forex #StressFreeTrading

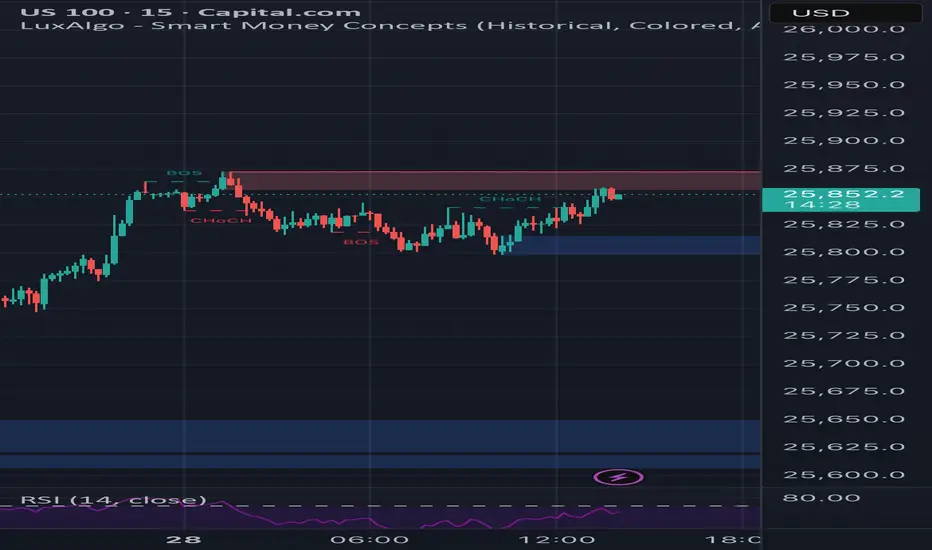
why Us100 will Target 25800why Us100 will Target 25800
Order Flow Legs in 15 M Chart
Swing Low
CHOCH
FVG

NAS100 | Bearish Momentum Extends The Nasdaq 100 fell about 2.1% (~500 points) as projected, maintaining a bearish outlook while technology stocks continued to weigh on market sentiment.
Below 25,700: Bearish continuation towards 25,340 → 25,230 → 25,000.
Above 25,700: Short-term recovery towards 25,820 → 26,170.

NAS100 Forecast: A Fresh Bullish Impulse Toward New HighsThe NAS100 index is currently moving within a classic Elliott Wave structure. After completing wave (3), the market entered a correction phase that formed wave (4). This correction appears to have ended in the highlighted support zone, where buyers stepped in strongly. The five-wave pattern before wave (4) confirms a solid bullish trend. Now, the index seems to be preparing for the final upward move wave (5). This wave often represents the last push of a rally before a larger correction starts. As long as the price stays above the recent support near 24,400 , the next targets could be seen around 25,200–25,600 . In simple terms, the market is expected to continue its uptrend after a short pullback, following the typical Elliott Wave sequence of five upward waves and three corrective ones.


NAS100 | US100 (Nasdaq 4H) – Technical OutlookUS100 (Nasdaq 4H) – Technical Outlook
📊 Market Structure:
Price has recently formed a weak high around 26,200, rejecting from a premium / supply zone, signaling potential short-term bearish pressure.
The previous upward structure showed a BOS (Break of Structure) near 25,000, confirming bullish intent earlier — but now momentum is slowing as price returns below the PDH (Previous Day High).
The current 4H candles show strong bearish reaction, indicating sellers defending the premium zone.
📉 Key Levels:
Supply Zone (Premium Area): 26,000 – 26,200
Equilibrium Zone: Around 24,800 – 25,000
Immediate Support: 25,800 (current PD level)
Weekly Pivot (PW): 25,400 (potential short-term target)
📈 EMA Confluence:
Price has rejected from above the 89 EMA (blue) and is now testing below it.
The 200 EMA (yellow) continues to trend upward, showing long-term bullish momentum, but the shorter EMAs suggest a short-term pullback.
As long as price stays below 89 EMA, bias remains bearish to neutral in the near term.
🎯 Trade Scenarios:
Scenario 1 – Short-Term Sell Setup:
Entry Zone: 25,950 – 26,100 (retest of premium area or EMA rejection)
Take Profit: 25,400 (PW)
Stop Loss: Above 26,250
Confluence: Supply zone + weak high + bearish EMA alignment
Scenario 2 – Bullish Continuation (after retracement):
Wait for price to retrace to the equilibrium zone (24,800–25,000)
Look for bullish reaction with confirmation from Stochastic RSI divergence
Target: Return to 26,000
📊 Indicators Insight:
Stochastic RSI: Currently dropping from overbought territory, indicating possible continuation of short-term downside.
Momentum slowing — ideal for short retracement trades before potential reversal.
Summary:
US100 is rejecting from premium resistance near 26,200.
Short-term bias: bearish retracement toward 25,400 or deeper 25,000 equilibrium zone.
Long-term bias remains bullish, supported by 200 EMA structure — watch for confirmation before re-entry buys.

Nasdaq bullish momentum continuesNasdaq bullish momentum continues. US economy and Technology stocks are fundamentally strong.

nas shortthink we haven't hit big liqudity zone yet. got chance to still go down, 930 see what happens.

Position Sizing: The Math That Separates Winners from LosersMost traders blow up their accounts not because of bad entries, but because of terrible position sizing. You can have a 60% win rate and still go broke if you risk too much per trade.
The 1-2% Rule (And Why It Works)
Never risk more than 1-2% of your account on a single trade.
Here's why this matters:
Risk 2% per trade → You can survive 50 consecutive losses
Risk 10% per trade → 10 losses = -65% drawdown (you need +186% just to break even)
Risk 20% per trade → 5 losses = game over
The Position Sizing Formula
Position Size = (Account Size × Risk %) / (Entry Price - Stop Loss)
Real Example:
Account: $10,000
Risk per trade: 2% = $200
Entry: $50
Stop loss: $48
Risk per share: $2
Position Size = $200 / $2 = 100 shares
If stopped out → You lose exactly $200 (2%)
If price hits $54 → You make $400 (4% gain, 2:1 R/R)
Different Risk Frameworks
Conservative (1% risk)
Best for: Beginners, volatile markets, high-frequency trading
Survivability: Can take 100+ losses
Growth: Slower but steady
Moderate (2% risk)
Best for: Experienced traders, tested strategies
Survivability: 50 consecutive losses
Growth: Balanced risk/reward
Aggressive (3-5% risk)
Best for: High conviction setups, smaller accounts trying to grow
Survivability: 20-33 losses
Growth: Faster but dangerous
Warning: Never go above 5% unless you're gambling, not trading.
The Kelly Criterion (Advanced)
For traders with significant backtested data:
Kelly % = Win Rate -
Example:
Win rate: 55%
Avg win: $300
Avg loss: $200
Win/Loss ratio: 1.5
Kelly % = 0.55 - = 0.55 - 0.30 = 25%
But use 1/4 Kelly (6.25%) or 1/2 Kelly (12.5%) - Full Kelly is too aggressive for real markets.
Common Position Sizing Mistakes
❌ Revenge trading larger after a loss
✅ Keep position size constant based on current account value
❌ Risking the same dollar amount regardless of setup quality
✅ Risk 0.5% on B-setups, 2% on A+ setups
❌ Ignoring correlation risk
✅ If you have 5 tech stocks open, you're really risking 10% on one sector
❌ Not adjusting after drawdowns
✅ If account drops 20%, your 2% risk should recalculate from new balance
The Volatility Adjustment
In high volatility (VIX > 30):
Cut position sizes by 30-50%
Widen stops or risk less per trade
Market can gap past your stops
In low volatility (VIX < 15):
Can use normal position sizing
Tighter stops possible
More predictable price action
My Personal Framework
I use a tiered approach:
High conviction setups (A+): 2% risk
Good setups (A): 1.5% risk
Decent setups (B): 1% risk
Experimental/learning: 0.5% risk
Maximum combined risk: Never more than 6% across all open positions.
The Bottom Line
Position sizing is the only thing you have complete control over in trading. You can't control:
Where price goes
Market volatility
News events
But you CAN control how much you risk.
The traders who survive long enough to get good are the ones who master position sizing first.
What's your current risk per trade? Drop it in the comments. If it's above 5%, we need to talk.
NSDQ100 overbought pullback - dip buying opportunity? Equities saw a sharp reversal yesterday, led by weakness in tech and AI-related names. While it was only a single day’s selloff, sentiment has clearly shifted toward caution, with growing talk of a potential equity correction.
Market Dynamics
The Magnificent 7 stocks fell -2.28%, driving the Nasdaq 100 lower as investors reassessed stretched valuations.
Palantir (-7.9%) and Nvidia (-4.0%) were key drags, emblematic of overextended tech momentum — even positive earnings guidance wasn’t enough to support prices.
Broader weakness spread across the market: S&P 500 -1.17% (worst day since Oct 10), equal-weight S&P -0.63%, and Russell 2000 -1.78%.
The S&P ex-Mag-7 was down -0.75%, underscoring the narrowness of recent gains and rising concern over market concentration.
Macro & Other Drivers
The risk-off tone boosted Treasuries: 2yr yield fell to 3.58%, 10yr to 4.09%.
Broader sentiment was pressured by a prolonged U.S. government shutdown (now 36 days, the longest ever) with growing economic cost estimates ($10–30bn/week).
Bitcoin briefly recovered above $100k, but large holders sold ~400,000 coins (~$45bn), adding to the risk-aversion tone.
Political Context
Zohran Mamdani’s election as New York’s first democratic socialist mayor and new housing initiatives grabbed headlines but had limited market impact.
Takeaway for Nasdaq 100
The Nasdaq 100 faces renewed selling pressure as investors rotate out of AI-heavy leaders and take profits after a long rally.
Focus today will be on whether dip-buyers step in or if the correction broadens.
Key near-term catalysts: U.S. ISM Services and ADP employment data, plus earnings from Qualcomm, ARM, and DoorDash later today — all potential volatility triggers for tech sentiment.
This communication is for informational purposes only and should not be viewed as any form of recommendation as to a particular course of action or as investment advice. It is not intended as an offer or solicitation for the purchase or sale of any financial instrument or as an official confirmation of any transaction. Opinions, estimates and assumptions expressed herein are made as of the date of this communication and are subject to change without notice. This communication has been prepared based upon information, including market prices, data and other information, believed to be reliable; however, Trade Nation does not warrant its completeness or accuracy. All market prices and market data contained in or attached to this communication are indicative and subject to change without notice.

