Nasdaq’s Battle at the Golden Support!On the NASDAQ 100 (NDX) chart, the index has pulled back after a strong rally to around 26,000, now testing a critical support zone near 25,000–25,200. This area is technically significant because it aligns with three key factors:
1. The main ascending trendline (blue line)
2. The 50-day moving average
3. A previous horizontal support level
In the short term, if the index holds above 25,000 and forms a bullish reversal candle, it could rebound toward the next resistance around 26,200–26,500. The stop loss for this bullish scenario would be a confirmed breakdown below 24,800.
However, if the price drops below 24,800 and stays there, a deeper correction toward 23,800–24,000 becomes likely — which aligns with the lower boundary of the medium-term channel.
From a long-term perspective, as long as the index trades above its 50-day moving average (currently around 20,300), the primary trend remains bullish, with potential upside targets between 27,000 and 28,000.
In short, this current zone represents the dividing line between trend continuation and a medium-term correction for the Nasdaq 100.
Trade ideas

Nasdaq Towards New All Time High, Buy-Stop TradeNasdaq bounced back upward after testing its support. Now going up, likely to make a new ATH.
We can take a 1:1 Buy trade here.

US100 Will target now 25800 Nasdaq is now targeting 25,800, where there are areas of liquidity and also negative order blocks

NSDQ100 overbought pullback - dip buying opportunity? Equities saw a sharp reversal yesterday, led by weakness in tech and AI-related names. While it was only a single day’s selloff, sentiment has clearly shifted toward caution, with growing talk of a potential equity correction.
Market Dynamics
The Magnificent 7 stocks fell -2.28%, driving the Nasdaq 100 lower as investors reassessed stretched valuations.
Palantir (-7.9%) and Nvidia (-4.0%) were key drags, emblematic of overextended tech momentum — even positive earnings guidance wasn’t enough to support prices.
Broader weakness spread across the market: S&P 500 -1.17% (worst day since Oct 10), equal-weight S&P -0.63%, and Russell 2000 -1.78%.
The S&P ex-Mag-7 was down -0.75%, underscoring the narrowness of recent gains and rising concern over market concentration.
Macro & Other Drivers
The risk-off tone boosted Treasuries: 2yr yield fell to 3.58%, 10yr to 4.09%.
Broader sentiment was pressured by a prolonged U.S. government shutdown (now 36 days, the longest ever) with growing economic cost estimates ($10–30bn/week).
Bitcoin briefly recovered above $100k, but large holders sold ~400,000 coins (~$45bn), adding to the risk-aversion tone.
Political Context
Zohran Mamdani’s election as New York’s first democratic socialist mayor and new housing initiatives grabbed headlines but had limited market impact.
Takeaway for Nasdaq 100
The Nasdaq 100 faces renewed selling pressure as investors rotate out of AI-heavy leaders and take profits after a long rally.
Focus today will be on whether dip-buyers step in or if the correction broadens.
Key near-term catalysts: U.S. ISM Services and ADP employment data, plus earnings from Qualcomm, ARM, and DoorDash later today — all potential volatility triggers for tech sentiment.
This communication is for informational purposes only and should not be viewed as any form of recommendation as to a particular course of action or as investment advice. It is not intended as an offer or solicitation for the purchase or sale of any financial instrument or as an official confirmation of any transaction. Opinions, estimates and assumptions expressed herein are made as of the date of this communication and are subject to change without notice. This communication has been prepared based upon information, including market prices, data and other information, believed to be reliable; however, Trade Nation does not warrant its completeness or accuracy. All market prices and market data contained in or attached to this communication are indicative and subject to change without notice.


Is this OTE or the beginning of a bear market?Is this OTE or the beginning of a bear market?
ICT OTE Theory defines the .62 retracement of a given range as the Optimum entry for the continuation of the bullish trend. Seeking Liquidity above the previous high.
We can compare this to the supply and demand theory using SMA 10 20 50. The moving averages indicate. Price currently sits below the value area between the 10 and 20 and has reacted off the 50.
Which put us in No mans land.
the 10 & 20 being above the 50 indicate the a bullish Bias.
If we are going bearish then we want to see the 10 & 20 below or crossing the 50 and price below the 50. This would be a strong setup and signal to go short. with price targets of 24224 & 22683.
HTF analysis : The M,W,D charts are still extremely bullish.
Current Sentiment: You tube videos and News reports are warning of a reversal and/or short term bearish move lower.
My Conclusion: WE are Bullish until proven differently. Next week will either support my conclusion or prove otherwise. So Stay flat and/or hedge your current positions to protect yourself the market response.

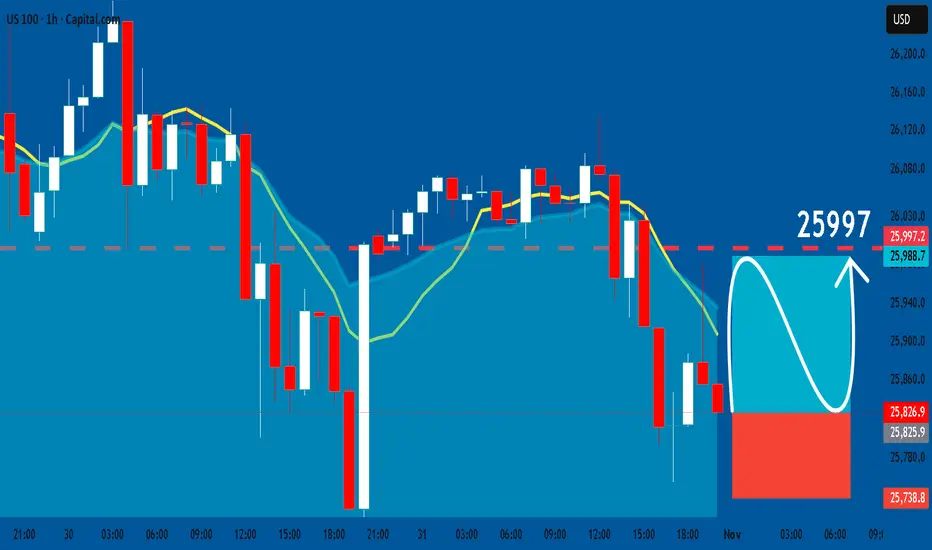
US100: Long Signal Explained
US100
- Classic bullish formation
- Our team expects pullback
SUGGESTED TRADE:
Swing Trade
Long US100
Entry - 25826
Sl - 25738
Tp - 25997
Our Risk - 1%
Start protection of your profits from lower levels
Disclosure: I am part of Trade Nation's Influencer program and receive a monthly fee for using their TradingView charts in my analysis.
❤️ Please, support our work with like & comment! ❤️
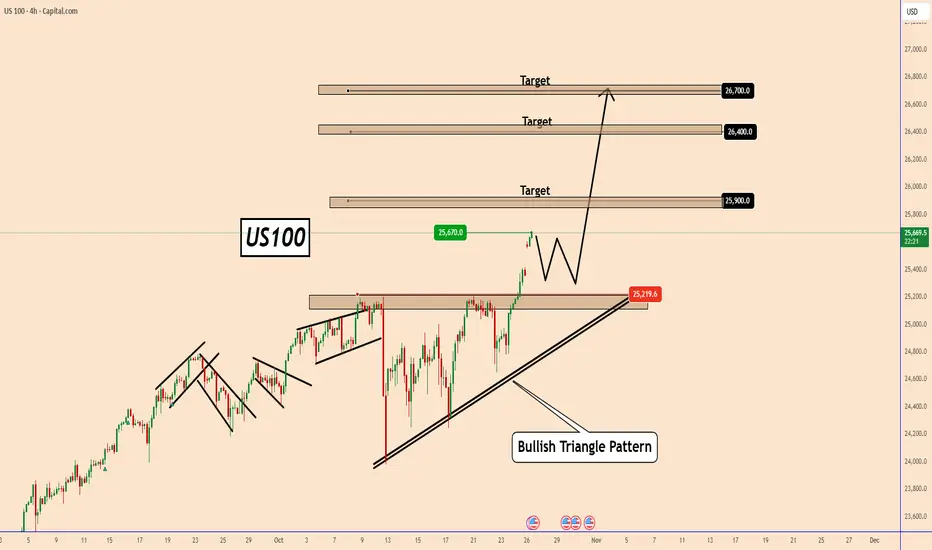
US100 Breaks Out as Trade Optimism and Fed Expectations Fuel MomUS100 Breaks Out as Trade Optimism and Fed Expectations Fuel Momentum
Over the weekend, US President Donald Trump said that the US and China will reach a deal.
US President Donald Trump said that the US and China are ready to "reach" a trade deal, as he is expected to meet with Chinese President Xi Jinping later this week in South Korea during his Asia tour.
This decision gave the market a breather and increased optimism about an improvement in business sentiment. The indices came out of consolidation to create new record highs.
US100 has already reached 25670 and looks set to rise further as shown in the chart with targets:
25900; 26400 and 26700
This week, the FED is also expected to cut rates by 25 basis points to 4% from 4.25%.
These expectations should help indices to rise further
US100 may test 25300 again before moving further. So, take note of this.
However, so far, US100 remains strong, and this momentum could continue to grow further.
You may find more details in the chart!
Thank you and Good Luck!
❤️PS: Please support with a like or comment if you find this analysis useful for your trading day❤️
Nasdaq bullish momentum continuesNasdaq bullish momentum continues. US economy and Technology stocks are fundamentally strong.

US100 Price is near a strong selling zone.
I expect a possible rejection from this level.
Targets are shown in the attached analysis.
This is not financial advice, just personal analysis.

USNAS100 / Fed Caution and Earnings Weigh on MomentumUSNAS100 – MARKET OUTLOOK | Futures Stall Near Highs as Fed Turns Cautious 🇺🇸
Wall Street futures held near record levels after the Fed’s 25bps rate cut, as traders weighed Powell’s cautious tone, Big Tech earnings, and a new U.S.–China trade deal.
🔽 Below 26,170: Bearish momentum toward 26,050 → 25,890 → 25,700.
🔼 Above 26,180: Trend turns bullish toward 26,500 → 26,850.
Pivot: 26,170
Support: 26,050 · 25,890 · 25,700
Resistance: 26,300 · 26,500 · 26,850
USNAS100 remains bearish while below 26,170, though strong tech earnings could trigger short-term upside volatility.

NasDaq Short NasDaq will be selling tomorrow, it will accumulate tonight and make a move tomorrow for short.

NSDQ100 relief rally led by mega-cap tech.Nasdaq 100 Trading Summary
Tech sentiment has rebounded strongly after upbeat earnings from Amazon and Apple, reversing much of yesterday’s selloff.
Amazon (+13% pre-market): Cloud revenue up +20% y/y, fastest growth since 2022 — a major boost for one of the year’s weakest Mag-7 names.
Apple (+2% pre-market): Forecasts 10–12% revenue growth this quarter (vs +6% expected), driven by stronger iPhone demand.
US futures: Nasdaq +1.2%, S&P 500 +0.65%, erasing most of Thursday’s losses.
Yesterday’s decline stemmed from AI-capex worries after Meta (-11.3%) and Nvidia (-2%) fell on spending and China-sales concerns. Those fears are easing as investors refocus on strong earnings and resilient demand.
Other Headlines
Universal Music beat estimates on subscription revenue, supporting consumer-discretionary sentiment.
Beverage giants continue to struggle — $830 bn in market value lost since 2021 amid shifting habits and tariffs.
UK retail: Growing backlash against chatbots may be hurting sales by billions, highlighting limits of AI adoption.
Outlook
Nasdaq 100 looks set for a relief rally led by mega-cap tech.
Focus today: follow-through buying in Amazon and Apple, stabilization in AI names (Meta, Nvidia), and overall positioning into month-end and key US inflation data later in the day.
This communication is for informational purposes only and should not be viewed as any form of recommendation as to a particular course of action or as investment advice. It is not intended as an offer or solicitation for the purchase or sale of any financial instrument or as an official confirmation of any transaction. Opinions, estimates and assumptions expressed herein are made as of the date of this communication and are subject to change without notice. This communication has been prepared based upon information, including market prices, data and other information, believed to be reliable; however, Trade Nation does not warrant its completeness or accuracy. All market prices and market data contained in or attached to this communication are indicative and subject to change without notice.


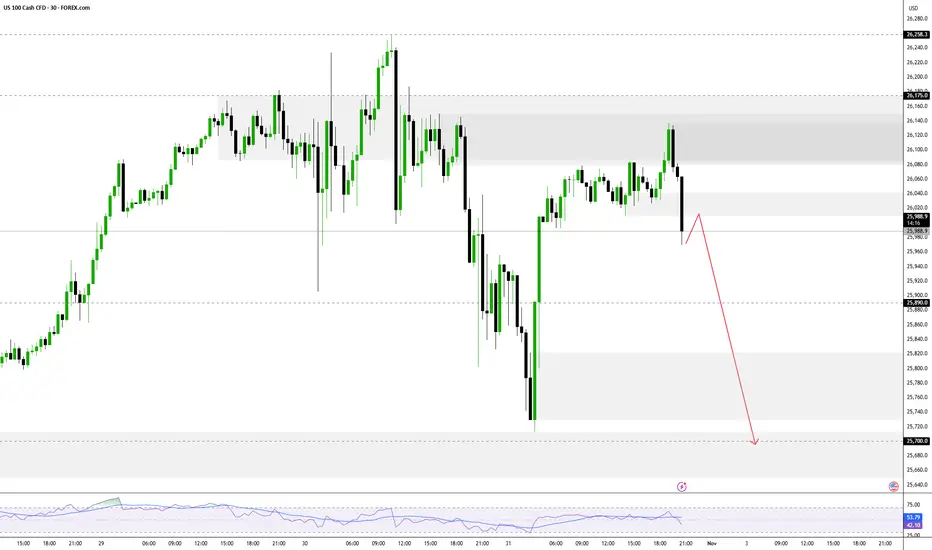
Reversal From ATH, Momentum Turns Cautious Reversal From ATH, Momentum Turns Cautious
The NASDAQ reversed from its all-time high and remains below 26,175, signaling short-term bearish momentum.
➡️ Below 26,175: Bearish bias toward 25,890 → 25,700 → 25,340.
➡️ Above 26,245: Bullish continuation toward 26,500 → 26,850.
Pivot POINT: 26,175
Support: 25,890 · 25,700 · 25,340
Resistance: 26,500 · 26,850 · 27,000
USNAS100 remains bearish while below 26,175, but a 1H close above 26,245 would confirm a bullish breakout toward higher targets.
NAS100 (1H) Market Outlook📈 NAS100 (1H) Market Outlook
NASDAQ is approaching a major resistance zone, with price currently extending within the upper boundary of a rising channel.
We may see a short-term bullish continuation into the top trendline, followed by a potential corrective drop back toward the 25,300–25,400 demand zone.
🧭 Key Levels:
🟥 Resistance Zone: 26,100 – 26,200
🟩 Support Zone: 25,300 – 25,400
⚙️ Potential setup: Wait for rejection confirmation before short entry.
📊 Market structure remains bullish overall, but extended exhaustion near the top trendline could trigger a pullback before continuation.
✨ Precision. Patience. Profit.
#NAS100 #US100 #IndexTrading #Forex #StressFreeTrading

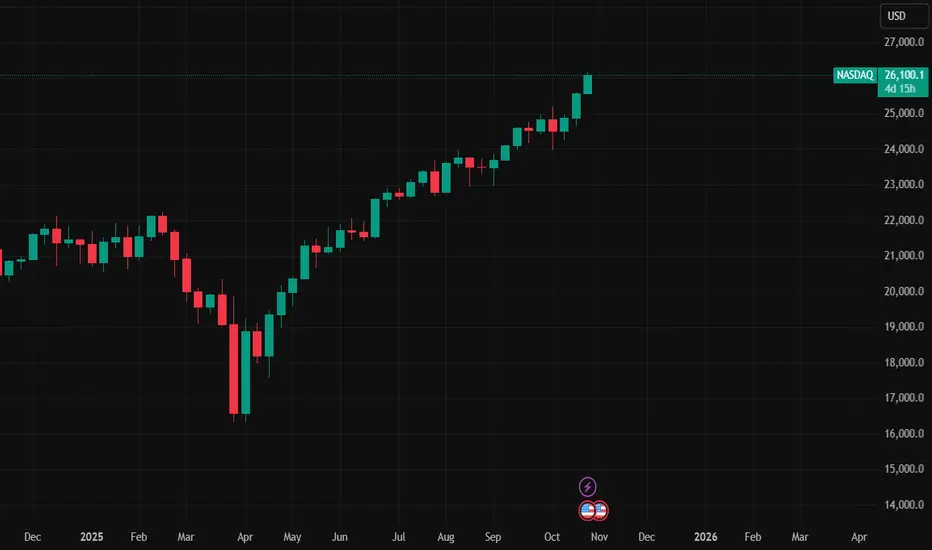
NASDAQ 100 Analysis !
The current price of the NASDAQ is $26,127, and my projection points to $32,000 in the coming months, entering 2026. This analysis is based exclusively on price action, following Al Brooks' methodology, through the technical analysis developed by Josias Baltazar, one of his closest students.
Use this projection as a reference for your decisions, whether in stocks or wherever you deem it appropriate.
I'll leave this analysis here... and I'll return in the future to see how it played out.

Position Sizing: The Math That Separates Winners from LosersMost traders blow up their accounts not because of bad entries, but because of terrible position sizing. You can have a 60% win rate and still go broke if you risk too much per trade.
The 1-2% Rule (And Why It Works)
Never risk more than 1-2% of your account on a single trade.
Here's why this matters:
Risk 2% per trade → You can survive 50 consecutive losses
Risk 10% per trade → 10 losses = -65% drawdown (you need +186% just to break even)
Risk 20% per trade → 5 losses = game over
The Position Sizing Formula
Position Size = (Account Size × Risk %) / (Entry Price - Stop Loss)
Real Example:
Account: $10,000
Risk per trade: 2% = $200
Entry: $50
Stop loss: $48
Risk per share: $2
Position Size = $200 / $2 = 100 shares
If stopped out → You lose exactly $200 (2%)
If price hits $54 → You make $400 (4% gain, 2:1 R/R)
Different Risk Frameworks
Conservative (1% risk)
Best for: Beginners, volatile markets, high-frequency trading
Survivability: Can take 100+ losses
Growth: Slower but steady
Moderate (2% risk)
Best for: Experienced traders, tested strategies
Survivability: 50 consecutive losses
Growth: Balanced risk/reward
Aggressive (3-5% risk)
Best for: High conviction setups, smaller accounts trying to grow
Survivability: 20-33 losses
Growth: Faster but dangerous
Warning: Never go above 5% unless you're gambling, not trading.
The Kelly Criterion (Advanced)
For traders with significant backtested data:
Kelly % = Win Rate -
Example:
Win rate: 55%
Avg win: $300
Avg loss: $200
Win/Loss ratio: 1.5
Kelly % = 0.55 - = 0.55 - 0.30 = 25%
But use 1/4 Kelly (6.25%) or 1/2 Kelly (12.5%) - Full Kelly is too aggressive for real markets.
Common Position Sizing Mistakes
❌ Revenge trading larger after a loss
✅ Keep position size constant based on current account value
❌ Risking the same dollar amount regardless of setup quality
✅ Risk 0.5% on B-setups, 2% on A+ setups
❌ Ignoring correlation risk
✅ If you have 5 tech stocks open, you're really risking 10% on one sector
❌ Not adjusting after drawdowns
✅ If account drops 20%, your 2% risk should recalculate from new balance
The Volatility Adjustment
In high volatility (VIX > 30):
Cut position sizes by 30-50%
Widen stops or risk less per trade
Market can gap past your stops
In low volatility (VIX < 15):
Can use normal position sizing
Tighter stops possible
More predictable price action
My Personal Framework
I use a tiered approach:
High conviction setups (A+): 2% risk
Good setups (A): 1.5% risk
Decent setups (B): 1% risk
Experimental/learning: 0.5% risk
Maximum combined risk: Never more than 6% across all open positions.
The Bottom Line
Position sizing is the only thing you have complete control over in trading. You can't control:
Where price goes
Market volatility
News events
But you CAN control how much you risk.
The traders who survive long enough to get good are the ones who master position sizing first.
What's your current risk per trade? Drop it in the comments. If it's above 5%, we need to talk.
US NAS 100Preferably suitable for scalping and accurate as long as you watch carefully the price action with the drawn areas.
With your likes and comments, you give me enough energy to provide the best analysis on an ongoing basis.
And if you needed any analysis that was not on the page, you can ask me with a comment or a personal message.
Enjoy Trading ;)

NASDAQ CRASH TO OBLIVION FY25-26my bias is short term bearish from the current level finding resistance around past higher high then bullish continutaion till the 26k levels where
im expecting a reversal in price to the yellow zones the proper exit ewill be specified once the reversal points confirm and present us with a down trend what i can say is there will be breaks of sructure on the weekly timeframe
like comment follo

NAS100 Forecast: A Fresh Bullish Impulse Toward New HighsThe NAS100 index is currently moving within a classic Elliott Wave structure. After completing wave (3), the market entered a correction phase that formed wave (4). This correction appears to have ended in the highlighted support zone, where buyers stepped in strongly. The five-wave pattern before wave (4) confirms a solid bullish trend. Now, the index seems to be preparing for the final upward move wave (5). This wave often represents the last push of a rally before a larger correction starts. As long as the price stays above the recent support near 24,400 , the next targets could be seen around 25,200–25,600 . In simple terms, the market is expected to continue its uptrend after a short pullback, following the typical Elliott Wave sequence of five upward waves and three corrective ones.

NasdaqNasdaq is showing a correction pattern after a previous upward movement. The price closed below the old support zone and was rejected, confirming a resistance zone at 25,923.4.
The loss of this support reinforces the continuation of the corrective movement, with a projected drop towards the next support zone at 25,569.8, a point where there is convergence with the previous low and a potential area for absorbing buy orders.

NAS100 | US100 (Nasdaq 4H) – Technical OutlookUS100 (Nasdaq 4H) – Technical Outlook
📊 Market Structure:
Price has recently formed a weak high around 26,200, rejecting from a premium / supply zone, signaling potential short-term bearish pressure.
The previous upward structure showed a BOS (Break of Structure) near 25,000, confirming bullish intent earlier — but now momentum is slowing as price returns below the PDH (Previous Day High).
The current 4H candles show strong bearish reaction, indicating sellers defending the premium zone.
📉 Key Levels:
Supply Zone (Premium Area): 26,000 – 26,200
Equilibrium Zone: Around 24,800 – 25,000
Immediate Support: 25,800 (current PD level)
Weekly Pivot (PW): 25,400 (potential short-term target)
📈 EMA Confluence:
Price has rejected from above the 89 EMA (blue) and is now testing below it.
The 200 EMA (yellow) continues to trend upward, showing long-term bullish momentum, but the shorter EMAs suggest a short-term pullback.
As long as price stays below 89 EMA, bias remains bearish to neutral in the near term.
🎯 Trade Scenarios:
Scenario 1 – Short-Term Sell Setup:
Entry Zone: 25,950 – 26,100 (retest of premium area or EMA rejection)
Take Profit: 25,400 (PW)
Stop Loss: Above 26,250
Confluence: Supply zone + weak high + bearish EMA alignment
Scenario 2 – Bullish Continuation (after retracement):
Wait for price to retrace to the equilibrium zone (24,800–25,000)
Look for bullish reaction with confirmation from Stochastic RSI divergence
Target: Return to 26,000
📊 Indicators Insight:
Stochastic RSI: Currently dropping from overbought territory, indicating possible continuation of short-term downside.
Momentum slowing — ideal for short retracement trades before potential reversal.
Summary:
US100 is rejecting from premium resistance near 26,200.
Short-term bias: bearish retracement toward 25,400 or deeper 25,000 equilibrium zone.
Long-term bias remains bullish, supported by 200 EMA structure — watch for confirmation before re-entry buys.
