US100 Breaks Out as Trade Optimism and Fed Expectations Fuel MomUS100 Breaks Out as Trade Optimism and Fed Expectations Fuel Momentum
Over the weekend, US President Donald Trump said that the US and China will reach a deal.
US President Donald Trump said that the US and China are ready to "reach" a trade deal, as he is expected to meet with Chinese President Xi Jinping later this week in South Korea during his Asia tour.
This decision gave the market a breather and increased optimism about an improvement in business sentiment. The indices came out of consolidation to create new record highs.
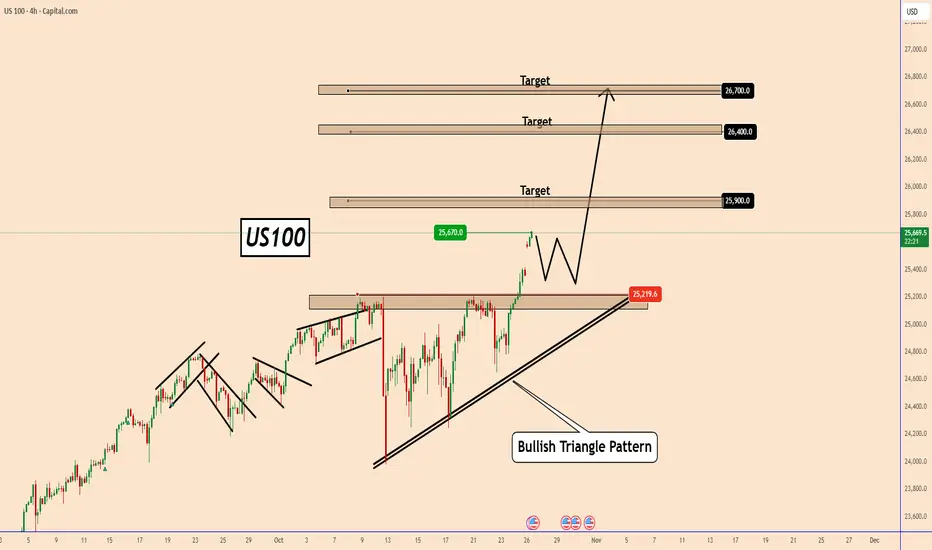
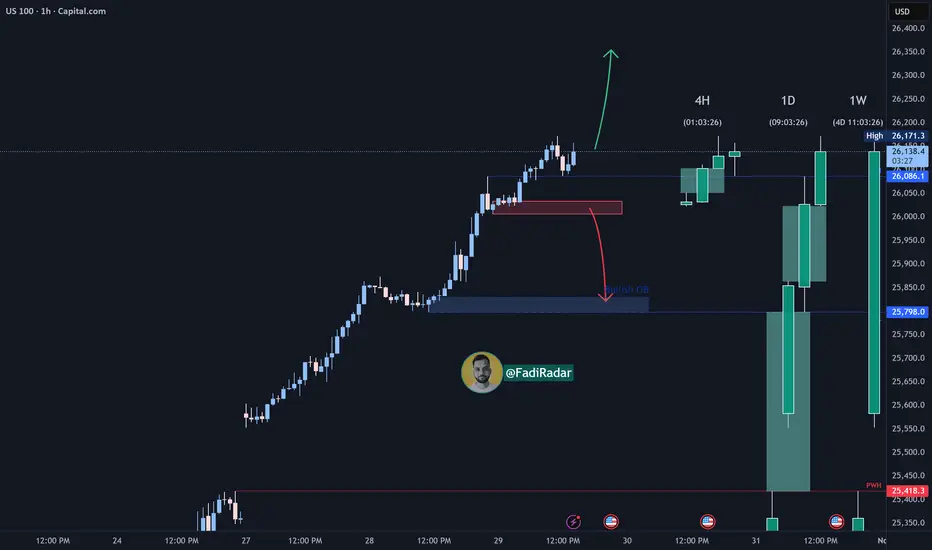
US100 has already reached 25670 and looks set to rise further as shown in the chart with targets:
25900; 26400 and 26700
This week, the FED is also expected to cut rates by 25 basis points to 4% from 4.25%.
These expectations should help indices to rise further
US100 may test 25300 again before moving further. So, take note of this.
However, so far, US100 remains strong, and this momentum could continue to grow further.
You may find more details in the chart!
Thank you and Good Luck!
❤️PS: Please support with a like or comment if you find this analysis useful for your trading day❤️
Trade ideas
Position Sizing: The Math That Separates Winners from LosersMost traders blow up their accounts not because of bad entries, but because of terrible position sizing. You can have a 60% win rate and still go broke if you risk too much per trade.
The 1-2% Rule (And Why It Works)
Never risk more than 1-2% of your account on a single trade.
Here's why this matters:
Risk 2% per trade → You can survive 50 consecutive losses
Risk 10% per trade → 10 losses = -65% drawdown (you need +186% just to break even)
Risk 20% per trade → 5 losses = game over
The Position Sizing Formula
Position Size = (Account Size × Risk %) / (Entry Price - Stop Loss)
Real Example:
Account: $10,000
Risk per trade: 2% = $200
Entry: $50
Stop loss: $48
Risk per share: $2
Position Size = $200 / $2 = 100 shares
If stopped out → You lose exactly $200 (2%)
If price hits $54 → You make $400 (4% gain, 2:1 R/R)
Different Risk Frameworks
Conservative (1% risk)
Best for: Beginners, volatile markets, high-frequency trading
Survivability: Can take 100+ losses
Growth: Slower but steady
Moderate (2% risk)
Best for: Experienced traders, tested strategies
Survivability: 50 consecutive losses
Growth: Balanced risk/reward
Aggressive (3-5% risk)
Best for: High conviction setups, smaller accounts trying to grow
Survivability: 20-33 losses
Growth: Faster but dangerous
Warning: Never go above 5% unless you're gambling, not trading.
The Kelly Criterion (Advanced)
For traders with significant backtested data:
Kelly % = Win Rate -
Example:
Win rate: 55%
Avg win: $300
Avg loss: $200
Win/Loss ratio: 1.5
Kelly % = 0.55 - = 0.55 - 0.30 = 25%
But use 1/4 Kelly (6.25%) or 1/2 Kelly (12.5%) - Full Kelly is too aggressive for real markets.
Common Position Sizing Mistakes
❌ Revenge trading larger after a loss
✅ Keep position size constant based on current account value
❌ Risking the same dollar amount regardless of setup quality
✅ Risk 0.5% on B-setups, 2% on A+ setups
❌ Ignoring correlation risk
✅ If you have 5 tech stocks open, you're really risking 10% on one sector
❌ Not adjusting after drawdowns
✅ If account drops 20%, your 2% risk should recalculate from new balance
The Volatility Adjustment
In high volatility (VIX > 30):
Cut position sizes by 30-50%
Widen stops or risk less per trade
Market can gap past your stops
In low volatility (VIX < 15):
Can use normal position sizing
Tighter stops possible
More predictable price action
My Personal Framework
I use a tiered approach:
High conviction setups (A+): 2% risk
Good setups (A): 1.5% risk
Decent setups (B): 1% risk
Experimental/learning: 0.5% risk
Maximum combined risk: Never more than 6% across all open positions.
The Bottom Line
Position sizing is the only thing you have complete control over in trading. You can't control:
Where price goes
Market volatility
News events
But you CAN control how much you risk.
The traders who survive long enough to get good are the ones who master position sizing first.
What's your current risk per trade? Drop it in the comments. If it's above 5%, we need to talk.
nas shortthink we haven't hit big liqudity zone yet. got chance to still go down, 930 see what happens.

Nasdaq-expecting price to pull back up and open my trade then a continuation further down
-based on this new all time high,price is likely to correct or reverse from my perspective 🤔

NAS100 Trade Set Up Oct 30 2025Price is making LH/LL on the 15m and 1h so i am bearish but first i either want to see a pullback into 1h CISD to then look for internal structure to continue down but if price first sweep PDL and/or EQL, i will look for short buys back up before looking for sells back down

NAS100 ShortElite analysis
Price reacted off of 4h structural liquidity
Targeting lower liquidity pools

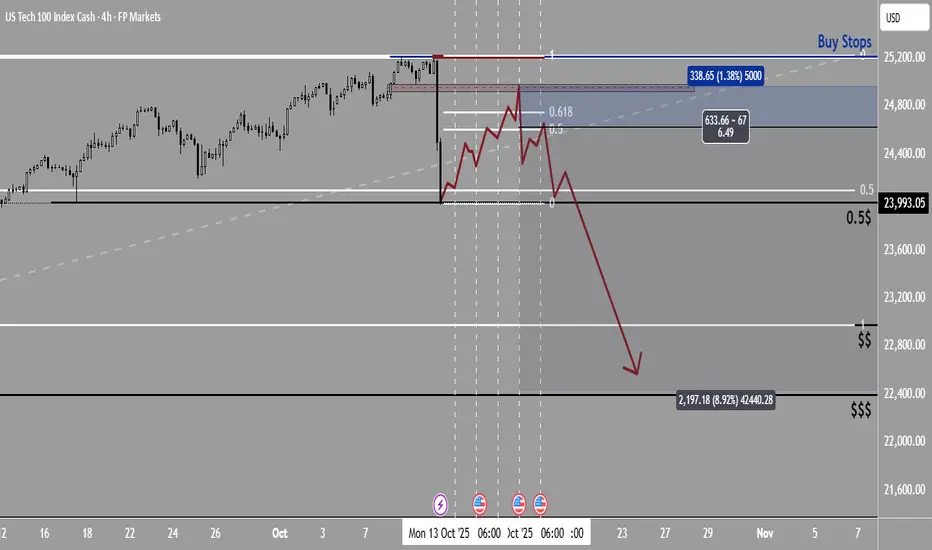
two scenarios for NQ on October I currently have two scenarios for NASDAQ, and both are bearish.
Scenario 1: The downtrend has already started. If we see a pullback around the 0.5 Fibonacci level, I’ll look to short again and keep stacking sell positions
Scenario 2: NASDAQ might retest the previous high — the one where the sharp drop started — move sideways for a while, and then start another leg down.
P.S. Success depends on proper risk management.
#NASDAQ #NASDAQ100
NAS100Bearish Divergence formed in 1hr
SL (Stop Loss): 26,315
This is just above the recent swing high — it protects your trade if the price keeps rising instead of dropping.
Entry: 25,895
This is the suggested sell (short) entry level — price is expected to move down after breaking below this level, confirming the reversal.
TP (Take Profit): 25,485
This is the target level, where you can close your trade for profit if the price falls as expected.

USNAS100 ForecastThe US100 chart shows strong bullish momentum, breaking above key resistance levels. Price is expected to retrace slightly toward the 25,750–25,500 support zone before resuming its upward move toward the 26,400–26,500 target area. Overall trend remains bullish with higher highs and higher lows formation.
"Thank you for your support! If you found this idea valuable or learned something new, please consider liking and leaving a comment. I’d really appreciate hearing your feedback and thoughts."

NAS100 Bearish Setup | Momentum Weakness Detected before FOMCNAS100 is showing early signs of a potential reversal after a strong bullish rally. Price action has formed a bearish divergence on the RSI — with price making higher highs while RSI prints lower highs — signaling fading momentum among buyers.
Volume has also declined during the recent upswing, suggesting weak participation in the continuation move and potential exhaustion near the recent top. A sell setup is active with the stop loss marked in red above the previous high to protect against false breakouts, while the target zone highlighted in green aligns with the next structural support and volume-based demand area.
A decisive close below near-term support would confirm bearish intent and open the path toward the target zone. Traders should monitor momentum indicators for confirmation of sustained weakness before continuation.

US NAS 100Preferably suitable for scalping and accurate as long as you watch carefully the price action with the drawn areas.
With your likes and comments, you give me enough energy to provide the best analysis on an ongoing basis.
And if you needed any analysis that was not on the page, you can ask me with a comment or a personal message.
Enjoy Trading ;)

NAS100 Trade Set Up Oct 29 2025Price is overall bullish but i believe there will be a pullback to 4h FVG or a sweep of EQL after price sweeps BSL/London highs before continuing its bullish trend

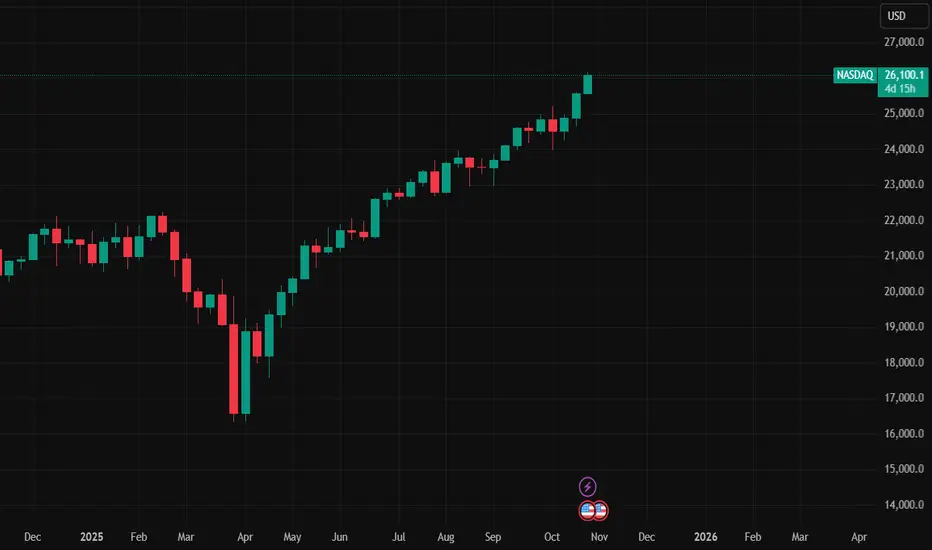
NASDAQ Index Analysis (US100)The NASDAQ index continues its strong bullish trend, currently trading near a new all-time high around 26,140.
📉 A minor correction is expected toward the 26,000 support zone.
If the price breaks and holds below this level, a further decline toward 25,800 is likely.
📈 However, if the price bounces from 26,000, the index may retest the recent high or even create a new record high.
💡 Key Trading Levels:
✅ Buy: On confirmed bounce from 26,000 or 25,800.
🔻 Sell: Below 26,000 after confirmation.
NasdaqHello traders! Last Friday, we had a major selloff in the 25,000 region, which quickly sent the Nasdaq crashing by more than 4% in just a few hours. In technical analysis, 24,000 is a price that has been broken previously and is now being tested as weekly support. If we expand this movement, we project a target price of 26,000, continuing the upward movement. The technology sector remains promising with advances in artificial intelligence, and we have no news of a Federal Reserve interest rate hike. Happy trading!

buy to sellLooking to buy from demand zone → targeting imbalance fill at 25,900.
Will look for short opportunities once price reaches IMB/supply zone.

US100 – Bullish Reversal Setup-H4: Turning bullish with a new high at 25,667.
Pullback: Formed a lower high, now H1 shifting bullish again.
Plan: Looking for buys above 25,542, SL below last H1 LH.
Adjustment: If another H1 LH forms and breaks upward, trail SL for tighter risk.
-Fundamental: Shutdown-end hopes , supporting the bullish scenario.

NQ1 high probable shortsNas should be on a correction today for the H1 and H4 sells. I anticipate nas either breaking its bullish level where sellers sit in the next 2-3 days or continuing down for the next week or two.

NAS100 CONTINUE TO BULLISH RALLYTechnically:
1) Trendline broke and then retest
2) Support becane resistance
3) no bearish divergence

NASDAQ Long ConfirmationsShould price pullback to dig deeper into the highlighted support, look for long confirmations.

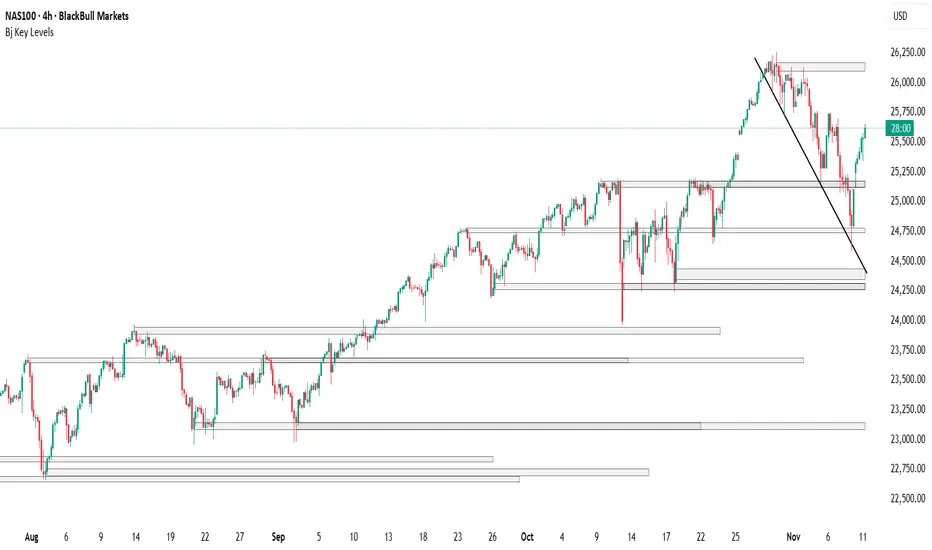
NASDAQ 100 — Key Intraday Reaction Zone (11 Nov)NASDAQ 100 (NDX) is currently trading inside a crucial intraday reaction zone around 25,550–25,650.
This area marks the intersection of previous structural resistance and short-term order flow buildup.
A clear break above this zone could signal continuation of bullish momentum, while failure to sustain may invite a short-term pullback.
Keeping an eye on how price behaves here during the U.S. session — this zone is likely to define the next directional move.
#NDX #NASDAQ100 #USMarket #PriceAction #TradingView #MarketAnalysis

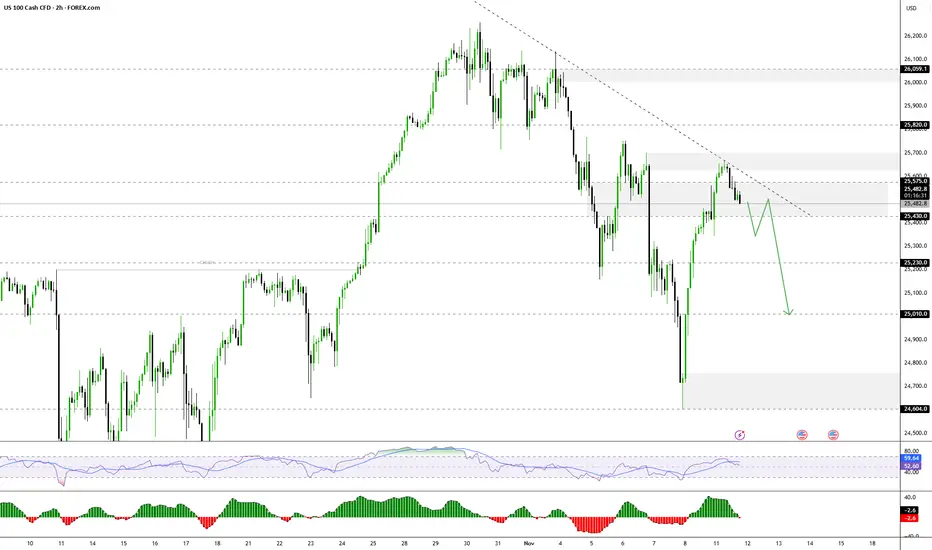
Nasdaq Potential for Further CorrectionThe NASDAQ index currently appears to be in a short-term correction, with the price likely to retest 25430 from 25570 before further movement.
- Above 25430–25575: Bullish continuation towards 25700 → 25820 → 25960.
- Below 25430: Bearish momentum is likely towards 25230 → 25010.
HELPFUL SUPPORT AND RESISTENCE INDICATORS & FVGI find these helpful and free as support and resistence thought id share

HELPFUL SUPPORT AND RESISTENCE INDICATORSI find these helpful and free as support and resistence thought id share