#Head&Shoulder chart pattern in action
Head and shoulder definition: A simple head and shoulders top formation is characterized by a peak representing
the left shoulder, followed by a higher peak which is referred to as the head of the formation. A lower peak representing the right shoulder is found on the right‐hand side of the head. The head should be the highest peak in the formation. The neckline is a trendline that connects the troughs that lie on either side of the head. Necklines may be horizontal or inclined which in our case is inclined. In an inverted head and shoulders formation (also referred to as a head and shoulders bottom), the head is the lowest
trough within the formation.
Head and shoulder pattern completion: The head and shoulders formation is completed with a valid breakout of the neckline Until a valid penetration has occurred, the formation is regarded as merely tentative. But as you can see in our case the pattern is completed since we can see upside breakout of the chart pattern neckline.
Head and shoulder pattern target: The minimum one‐to‐one price objective or target for a head and shoulders top formation is simply the vertical distance between the head and the neckline projected downward from the neckline breakout level. For an inverted head and shoulders formation, the vertical distance is projected upward from the neckline breakout level. You can see this vertical line in the chart.
Head and shoulder pattern entry:
■■ Short at a break of the right shoulder’s uptrend line with a stop placed above the right shoulder or head (see Point 1 in Figure 13.9)
■■ Short at the peak of the right shoulder with a stop placed above the right shoulder or head, especially when there is a significant resistive confluence comprising of significant Fibonacci retracement levels, Floor Trader’s Pivot Point levels, and
psychologically important price levels associated with double and triple zeros
■■ Short at the right shoulder when it is testing the left shoulder’s resistance level, with a stop placed above the resistance level or head
■■ Short on a valid penetration of the neckline with a stop placed above the neckline, right shoulder, or head (see Point 2 in Figure 13.9)
■■ Short on a retest of the neckline after a valid penetration with a stop placed above the neckline, right shoulder, or head (see Point 3 in Figure 13.9)
■■ Short on the penetration of the price associated with the trough created by the retest action, with a stop placed above the trough, neckline, right shoulder, or head (see Point 4 in Figure 13.9)
i.postimg.cc
Source: the handbook of technical analysis by Mark Andrew Lim
JPYBASKET trade ideas

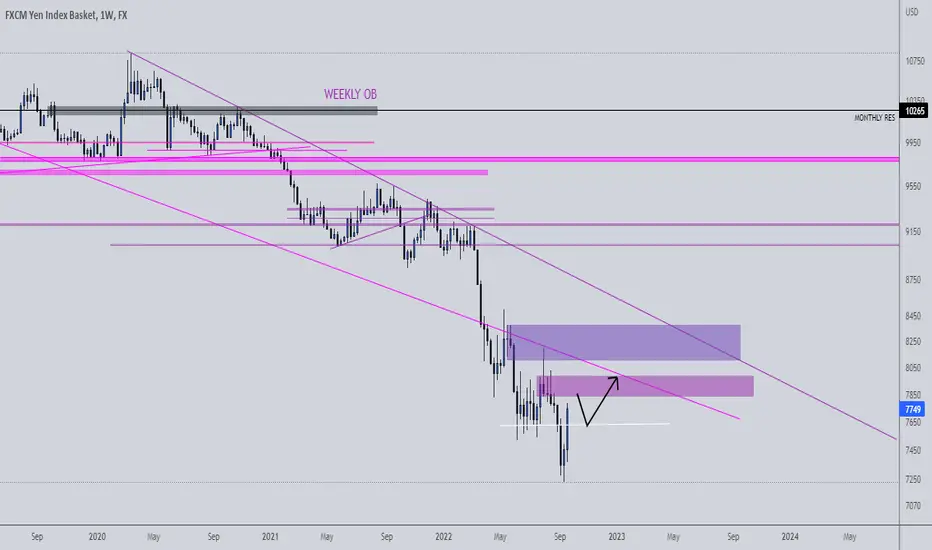
#JPYbasket bullish move confirmationsyesterday red candle was not only a retest to a broken bearish channel upper line, but also head and shoulder neckline. in addition to these two confluence we should be aware that JPY index suffers a lot through past month during rate hike cycle of central banks and fall massively like never before.
But now that we have some confluences that we are close to end of rate hike cycle JPY has found some room to appreciate against other currencies and as a result in technical aspect we can see it had formed and broke bullish chart pattern and its no longer trading in bearish channel.
with the look at the text book chart pattern target we can see that price can come all the way up to the oldest bearish channel midline and from there we should be looking for other confirmation and change in macro-economy.

JPY CURRENCYPrice is currently forming a bullish flag & expecting the last wave of correction. Then it will perform its new leg up ! Get prepared to short XXXJPY pair !

JPY INDEX LONG IDEAPrice is currently at a discount and approaching a 1H bullish orderblock. I would like to see those Equal Lows taken and for the Bullish orderblock to be traded into, before an expansion to the upside. The Low resistance liquidity would be my first initial target.
Once price has filled my order, I would shout pairs XXX/JPY pairs after some displacement.

YEN BASKET Yen Basket has dropped and broken structure to the downside after price was made efficient after mitigating a lovely sponsored candle, price may break deeper so should be seeing bearish JPY short term.

JPY BASKET D1In my point of view JPY BASKET
So buyer be careful
My strategy is so easy and simple
Hit the like and follow btn

JPY BASKET INDEX - DAILY TFJPYBASKET INDEX - Currently price is indecisive on whether we will see the YEN Pairs weaken.
one to watch especially, we could potentially see an explosive move back down to the downside and make a new Low for the yen
if the YEN doesn't intervene and back its currency against most pairs.
keep a close eye on this INDEX.


JPYBASKET INDEXJPYBASKET - We will either see a huge reversal or we will see YEN intervention on the forex markets making all the JPY pairs push lower.
one to watch next week.


JPY index DAILYwith the buyers trying to push price to our POI we have establish 2 areas for a possible reversal and we be anticipating for candlestick and reversal patterns in these areas
JPY index WEEKLYWeekly candle closed with some bullish momentum indication of a possible pullback to our POI where we see multiple wicks showing sellers exhaustion

JPY index DAILYOverall bearish and we anticipating for price to pullback to the 7520 zone ,look for some buyers exhaustion and we can continue selling...
-inverse to the pair Jpy pairs that why we have shorterm sells on UJ and GJ
JPYBASKET LONGSWe are going for buys on the long term... We will buy on one of those three order blocks


JPY index DAILYlast weekly we had a bearish candle close on the daily engulfing the previous day candle(sellers dominating ) and we can see and easy break of daily zone to thedownside
OR
We can have a slight push to the upside to retest the unmitigated daily OB b4 we push to the downside

JPY index WEEKLYOverall on a bearish trend and we be expecting further push tp the downside as the week closed with a sexy weekly bearish candle

⁉️ JPYBASKET - Market AnalysisHello traders!
⁉️This is my analysis on JPYBASKET.
Here I have 2 points of interest, first one I am waiting for a rejection from orderblock around price level 7850. The second one if the price fills the imbalances below and reject from bullish orderblock around price level 7680.
Like, comment and subscribe to be in touch with my content!


JPYBASKET READY TO SHOOT TO MOON.📰JPYBASKET has formed a beautiful descending structure with a multiple touch.


JPYBASKET Weekly Analysis ⁉️Here I am still bullish as we can see the price to form higher highs and higher lows, so I am looking only for longs. The price accumulated into the range last week forming SSL and BSL (sell and buy side liquidity). I expect the price could break the range and take out sell side liquidity and reject from bullish orderblock to continue bullish move.
