US100 Breaks Out as Trade Optimism and Fed Expectations Fuel MomUS100 Breaks Out as Trade Optimism and Fed Expectations Fuel Momentum
Over the weekend, US President Donald Trump said that the US and China will reach a deal.
US President Donald Trump said that the US and China are ready to "reach" a trade deal, as he is expected to meet with Chinese President
About US 100 Cash CFD
The NASDAQ-100 is an index that is constituted by 100 of the largest companies listed on the NASDAQ stock exchange, which is the second largest in the world only after the New York Stock Exchange by market capitalization. The companies that are listed in this index range from a variety of industries like Technology, Telecommunications, Biotechnology, Media, and Services. The NASDAQ-100 was first calculated in January 31 of 1985 by NASDAQ and it is a modified capitalization-weighted index. This index has been of good reference to investors that want to know how the stock market is performing without financial services companies, this given that the index excludes financial companies.
NAS100 1H: Bulls vs Bears at the Line📊 NAS100 – 1 Hour Analysis
Hello friends,
Here’s my NAS100 analysis for you.
Looking at the 1-hour chart, I want to highlight a critical level.
👉 If NAS100 breaks above 25,038 and closes a candle there, the next move could point higher.
👉 If NAS100 fails to break 25,038, then a pullbac

NASDAQ Watching 24,975 for Fresh Bounce in Ongoing UptrendHey Traders,
In tomorrow’s trading session, we are monitoring NAS100 for a buying opportunity around the 24,975 zone. NASDAQ remains in a broader uptrend and is currently undergoing a healthy correction, approaching the key 24,975 support and resistance area that aligns with the ascending trend str

Nasdaq - The most important structure!💰Nasdaq ( TVC:NDQ ) perfectly respects structure:
🔎Analysis summary:
Over the course of the past couple of months, the Nasdaq has been rallying an expected +50%. Still, until the Nasdaq will retest the upper channel resistance trendline, this rally won't be over. Therefore, we can still see a

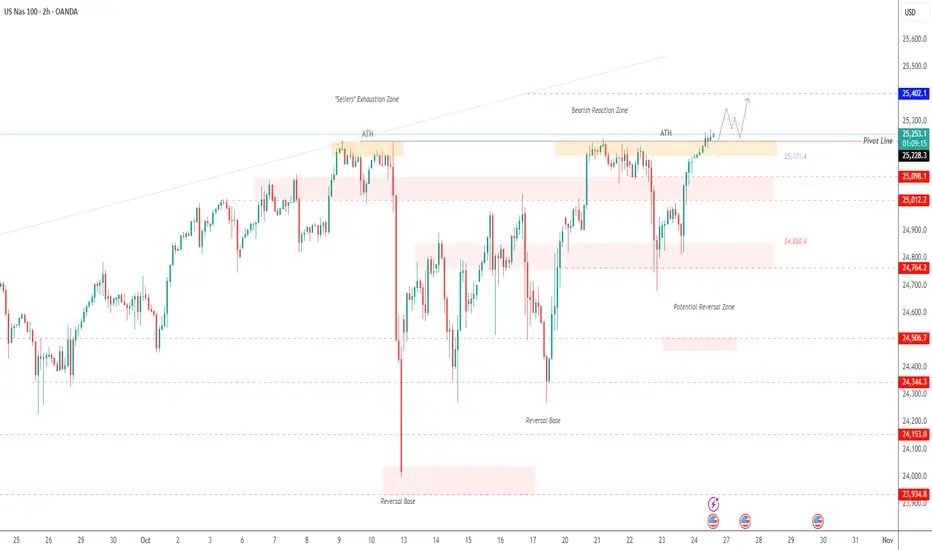
USNAS100 Extends Rally to New All-Time Highs?USNAS100 | Bullish Continuation Toward New Highs
The index recorded a new all-time high (ATH) and has already stabilized above it, supporting further bullish momentum toward 25,400 → 25,550.
The main driver behind the move remains strong corporate earnings.
However, to confirm a bearish reversal,
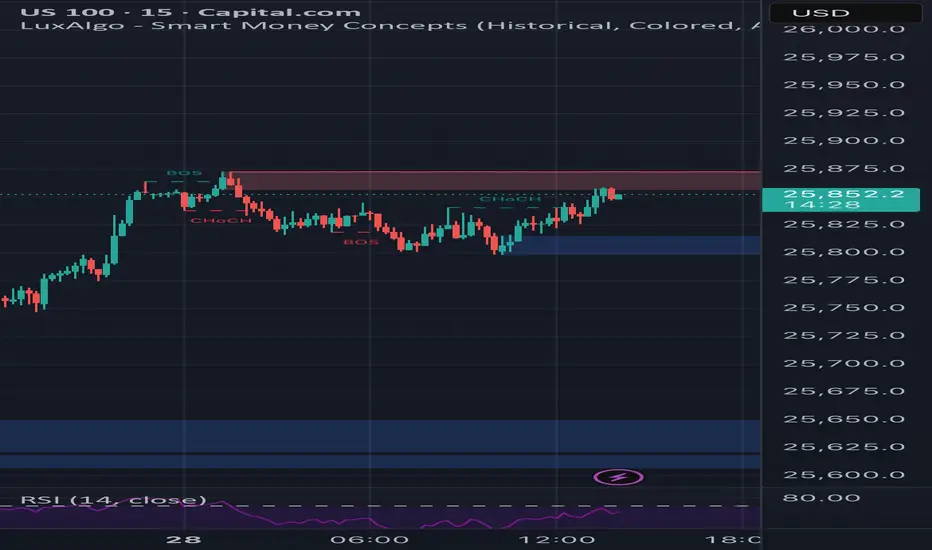
Sell in NasdaqUpdated Nasdaq Market Analysis (as of October 28, 2025 – Current Price: 25,809)
Current Price: Nasdaq Composite (^IXIC) at 25,809
Intraday Change: Up +1,605 points (+6.63%) from prior close (~24,204)
Context: This marks an explosive breakout, shattering all-time highs with the strongest single-day s
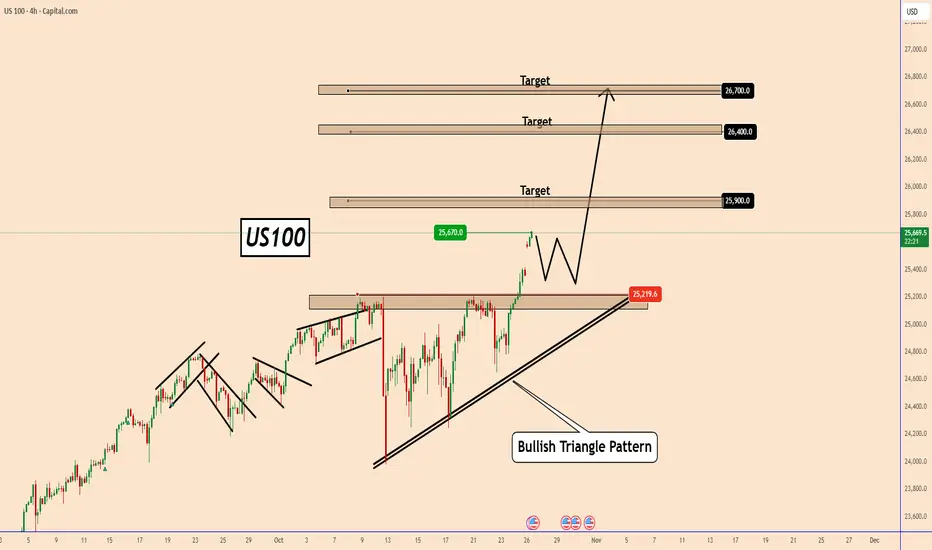
US100 STRONG BREKAOUT|LONG|
✅US100 Price has successfully broken through the key resistance and all-time-high level, confirming bullish intent. As long as the breakout holds above structure, we anticipate continuation toward the next premium zone and liquidity resting at higher highs. Time Frame 3H.
LONG🚀
✅Like and subscr

Lower CPI Data – But Don’t Be Fooled by “Good” Inflation Numbers
Summary:
Markets cheered on lower CPI data, but the optimism might be misplaced. A softer inflation print gives the FED more flexibility, yet it also reduces the urgency for two rate cuts this year — something traders had already priced in.
Logic:
CPI came in weaker → short-term bullish sentime
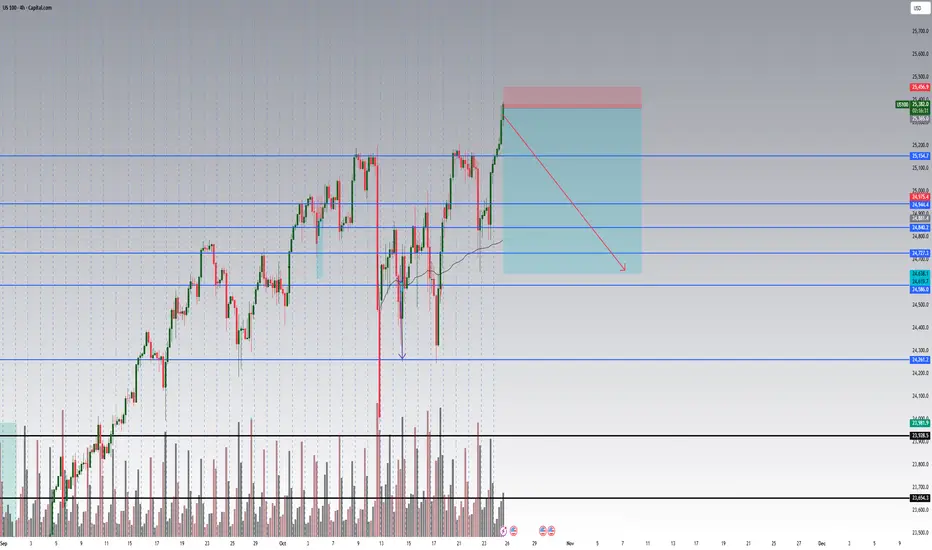
NDQShift prediction to the right.
Global market cooler anticipated. Crypto should be hit the hardest and fastest.
Most anticipating rally continuation like post-COVID...
I think that will cause a surprise.

US100 Price is near a strong selling zone.
I expect a possible rejection from this level.
Targets are shown in the attached analysis.
This is not financial advice, just personal analysis.

See all ideas
Displays a symbol's price movements over previous years to identify recurring trends.