NAS100 Trade Set Up Nov 7 2025Price remains bearish so i will only looking for sells either after price sweeps internal BSL or London highs BSL before looking for 1m-5m IFVG/CISD to take sells to lower SSL levels
Trade ideas

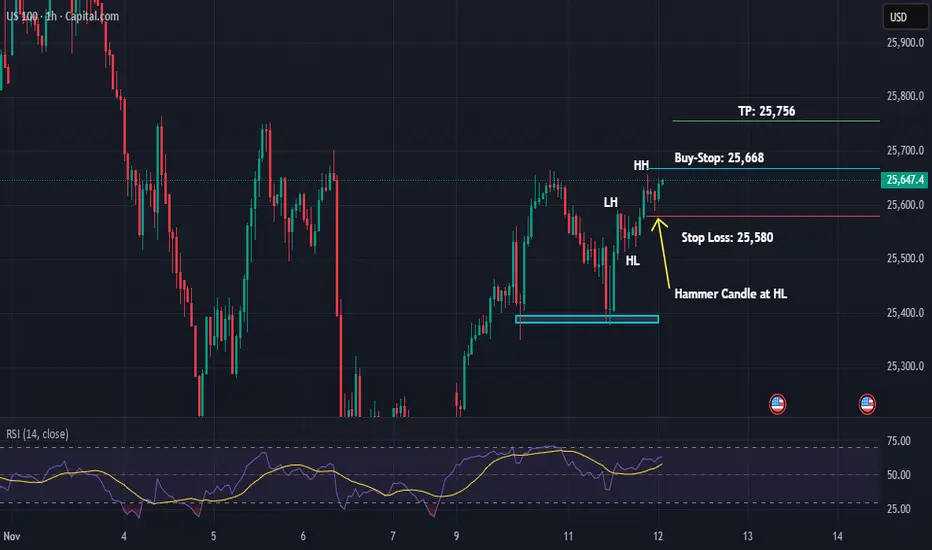
US100 Buy-Stop Setup on 1HNasdaq is in a Bullish Trend on 1H timeframe... It looks like it can go further up.
Let's take a 1:1 Long Trade here.
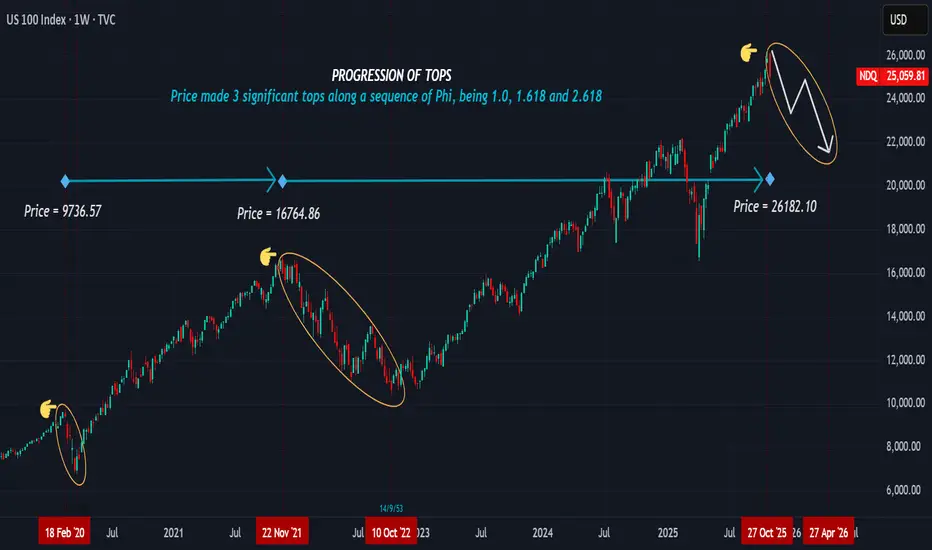
SHORT UNTIL LATE APRIL 2026OUR OBSERVATION
NASDAQ made three significant tops in its price action from 2009 to the present in a sequence of an expanding Phi.
February 2020 High = 9736.57 (This is the 1.0 growth level divided into a Log function)
(9736.57 / 10^4) = 0.973657 (Equivalent to 3/3 = 1.0)
November 2021 High = 16764.86
(16764.86 / 10^4) = 1.676486 ( This is the 5/3 Fibonacci sequence or a variation of 1.618)
Current High at 27th October 2025 = 26182.10
(26182.10 / 10^4) = 2.618210 (This level indicates the 8/3 growth sequence or 2.618 level)
TRADE PLAN
If we project a sequence of thirds, (1/3, 2/3, 3/3), then the three tops from 2009 made an expanding sequence along 3/3, 5/3, and 8/3 nodal points , at 9736.57, 16764.86 and 26182.10 levels respectively. Each node effected a correction, and by projection, we expect price to correct steadily until late April 2026. (1,2,3,5,8...) points form the price tops. The zone between 26182.1 and 26880.XX will be our confluence zone to expect a decline.
We projected the 27th October top as far back as April 2025, where we mentioned a broader cross assets decline. If we compare NASDAQ's price to SP-500 and DJIA, then we can create a larger sequence pattern. SP-500 top reached 6920.34 being 2/3 on the sequence while DJIA reached 48040.64, the 13/3 node. Several markets reaching tops at the same time cooks a sharp long decline. Therefore, we will keep short entries for all three markets until the tops break.
NOTE: We do not trade news effects, we only trade measurable facts the charts indicate. However, we look to the news for signals that add strength to our expectations.
Trade safe, good luck

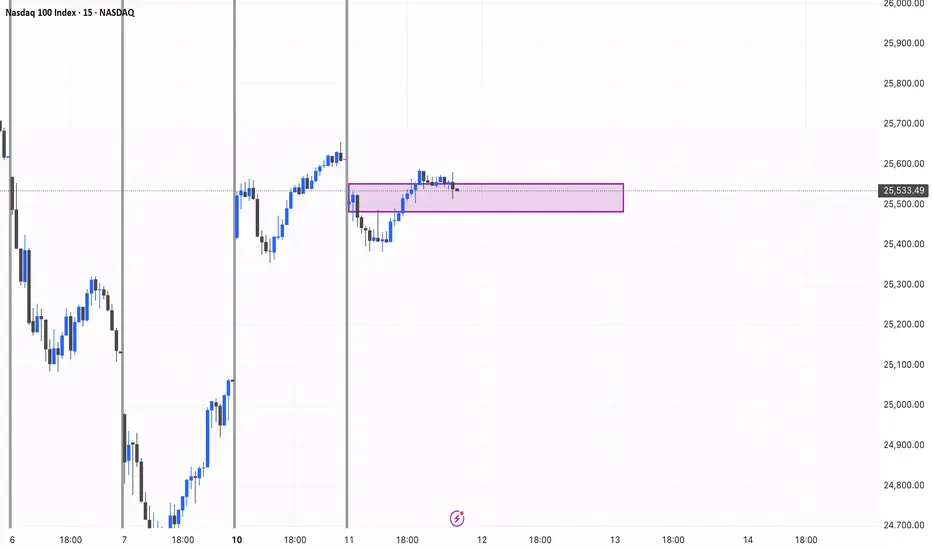
NASDAQ 100 — Key Intraday Reaction Zone (12 Nov)NASDAQ 100 (NDX) is currently trading inside a crucial intraday reaction zone around 25,551–25,480.
This area marks the intersection of previous structural resistance and short-term order flow buildup.
A clear break above this zone could signal continuation of bullish momentum, while failure to sustain may invite a short-term pullback.
Keeping an eye on how price behaves here during the U.S. session — this zone is likely to define the next directional move.
#NDX #NASDAQ100 #USMarket #PriceAction #TradingView #MarketAnalysis
US100 PRICE MAY DECLINE!The H4 chart shows there could be a good probability for a sell as price just reacted off 25,705 a sell opportunity is envisaged. I anticipate price to decline. I’m selling short US100

Nasdaq Catch me on IG @KI113R45 as I'll catch this trade with a Lil amount as R150 testing whether the problem with us traders is with the amount we use or the skill set used🎮🤔🤷♂️👾

NAS100 H1 | Bullish Bounce off Key SupportNAS100 is falling towards our buy entry at 24,841, which is a swing low support level that aligns with the 161.8% Fibonacci extension level.
The stop loss is at 24,664, which is a swing low support level, while the take profit is at 25,102, which is a pullback resistance level.
Stratos Markets Limited (tradu.com/uk ):
CFDs are complex instruments and come with a high risk of losing money rapidly due to leverage. 68% of retail investor accounts lose money when trading CFDs with this provider. You should consider whether you understand how CFDs work and whether you can afford to take the high risk of losing your money.
Stratos Europe Ltd (tradu.com/eu ):
CFDs are complex instruments and come with a high risk of losing money rapidly due to leverage. 70% of retail investor accounts lose money when trading CFDs with this provider. You should consider whether you understand how CFDs work and whether you can afford to take the high risk of losing your money.

NAS100 Berish FlagThere is a double top rejection currently at play on H1 and a bearish flag on M15.
A break out and retest of this flag will provide safer and a higher probability setup.

NAS100 Trade Set Up Nov 11 2025Price swept PDH and inverted a 4h FVG plus broke structure to the downside on the 1h so i will want to see a internal BSL sweep to then see a continuation lower to SSL and possibly 1h FVG

NDQ100 (15M) Bullish Analysis. (SMC)🧩 Market Context
After a strong bearish move marked by a 1H Fair Value Gap (FVG), the market started to show institutional accumulation.
A Change of Character (ChoCh) and a Break of Structure (BOS) confirm a shift to bullish momentum.
The identified Order Block (OB) acts as a key mitigation point supported by a well-defined support zone.
💥 Entry Idea
• Buy: 25,124
• Stop-Loss: 24,979
• Take-Profit: 25,530
• Risk/Reward: 1 : 2.6
After a Fake Out (bearish liquidity trap), price shows strong bullish reaction, indicating institutional intention to mitigate the OB and reach the Buy-Side Liquidity above.
📊 Technical Confirmations
• The SMA starts to act as a dynamic support.
• Rejection from the OB validates structure change.
• The target (25,530) aligns with a distribution zone and liquidity pool, perfect for partial or full take-profit exits.
🧭 Conclusion
Clean structure, strong institutional logic, and confluences in harmony.
This setup illustrates the accumulation → mitigation → distribution sequence, where the market sweeps liquidity before expanding upward.
A perfect example of professional market reading. 🚀
GOOD LUCK TRADERS 🦾🤓✌🏻

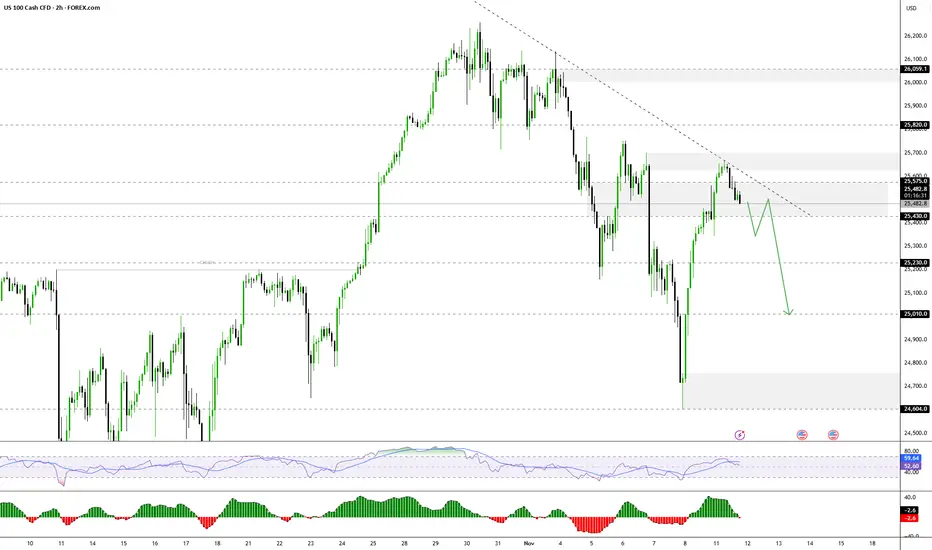
Nasdaq Potential for Further CorrectionThe NASDAQ index currently appears to be in a short-term correction, with the price likely to retest 25430 from 25570 before further movement.
- Above 25430–25575: Bullish continuation towards 25700 → 25820 → 25960.
- Below 25430: Bearish momentum is likely towards 25230 → 25010.
Sellin Zone Nas1001. Daily is bearish
2. 4HR is bearish
3. 2HR is bearish
4. 1HR is bearish
Therefore, we looking for sells. I will enter a sell in the internal supply zone.

NASDAQ Double Top Rejection Still At PlayI do not believe the bears are quite done yet in this market. What I am seeing currently is a bullish correction or retest of this double top rejection.
Momentum to the downside will resume soon enough. For now however, enjoy the ride to the upside - cautiously.
This is a buy to sell setup. My overall bias is bearish.

NAS100 Trade Set Up Nov 13 2025price is making LH on the 1h and is approaching PDL so if price continues to make LH and can make a LL under PDL i will look to take sells down to the gap that price left

NAS100 CONTINUE TO BULLISH RALLYTechnically:
1) Trendline broke and then retest
2) Support becane resistance
3) no bearish divergence

NDX - POTENTIAL PULLBACK IN PLAY - SHORT SHORT INTO LONGGood Morning,
Always trade with risk assessment in mind. You can lose money quickly without an exit strategy. I choose a 7% stop based on my risk.
We are looking for a .5% exhaustion gap into todays market to show initiation of the pullback.
Trade Safely
Enjoy!

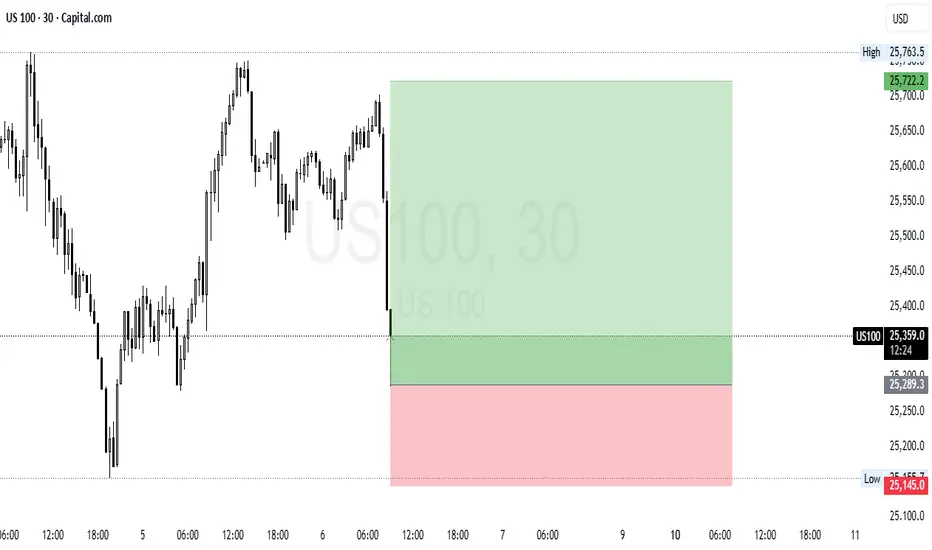
US100 (NASDAQ 100) Long SetupAnalysis:
The market formed a strong bullish leg earlier and is now pulling back to retest a key support zone around 25,300. If price holds this level and shows bullish confirmation (e.g., bullish engulfing or structure break), we could see continuation to the upside.
Bias: Bullish above 25,300
Invalidation: Break below 25,145
Setup Type: Long Position
Entry: Around 25,300 (support retest)
Stop Loss: 25,145
Target: 25,720+
#US100 #NASDAQ100 #PriceAction #TradingSetup #TechnicalAnalysis #ChartAnalysis #BuySetup #TradingView #SmartMoney #Forex #Indices
NASDAQ Channel Up still stands buy needs a pull-back.Nasdaq (NDX) reached the top of its 5-month Channel Up and got rejected. It completed a +9.59% rise from the last 1D MA50 (red trend-line) bottom (Higher Low for the pattern), similar to the previous Bullish Leg.
The maximum a Bullish Leg has increased by inside this pattern is +10.87%. As a result, either now or just above it, the pattern would require a technical pull-back. The most usual buy signal is on its 4H MA200 (orange trend-line) and the most effective when the 4H RSI breaks below its oversold (30.00) barrier.
Our next Buy Zone is within the 0.382 - 0.5 Fibonacci retracement range.
-------------------------------------------------------------------------------
** Please LIKE 👍, FOLLOW ✅, SHARE 🙌 and COMMENT ✍ if you enjoy this idea! Also share your ideas and charts in the comments section below! This is best way to keep it relevant, support us, keep the content here free and allow the idea to reach as many people as possible. **
-------------------------------------------------------------------------------
💸💸💸💸💸💸
👇 👇 👇 👇 👇 👇

US NAS 100Preferably suitable for scalping and accurate as long as you watch carefully the price action with the drawn areas.
With your likes and comments, you give me enough energy to provide the best analysis on an ongoing basis.
And if you needed any analysis that was not on the page, you can ask me with a comment or a personal message.
Enjoy Trading ;)

buy to sellLooking to buy from demand zone → targeting imbalance fill at 25,900.
Will look for short opportunities once price reaches IMB/supply zone.

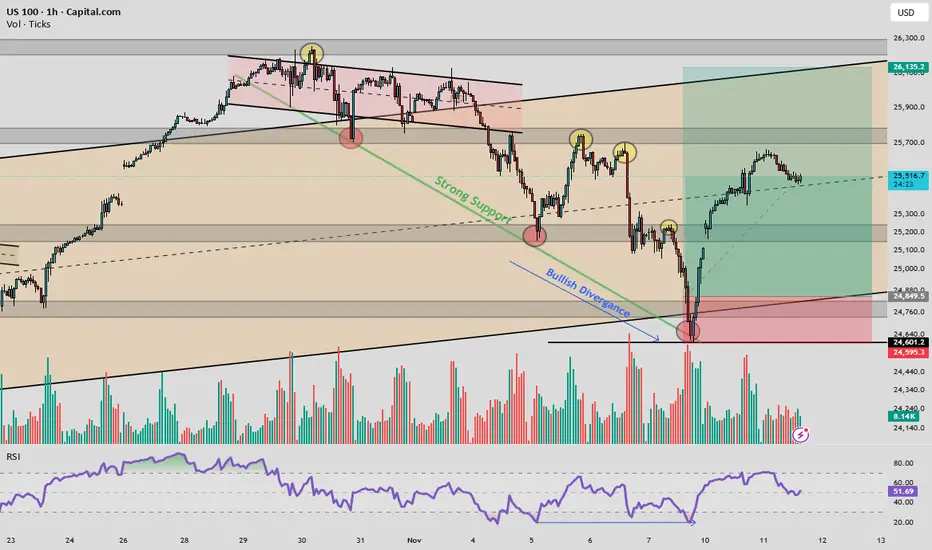
US100: Bullish Divergence Meets Institutional SupportUS100 1H Analysis – Bullish Divergence at Strong Support
Price is compressing within a descending channel, currently testing a multi-touch support zone around 24,730–24,490. Volume shows signs of accumulation, and RSI reveals bullish divergence, hinting at potential reversal. If support holds, a bounce toward 25,900–26,250 is likely. Breakdown below 24,490 invalidates the setup.
Follow @GoldenZoneFX for more content and valuable insights.
Nasdaq-100 Wave Analysis – 10 November 2025- Nasdaq-100 reversed from support level 25000.00
- Likely to rise to resistance level 26250.00
Nasdaq-100 index recently reversed up with the daily Hammer from the support zone between the round support level 25000.00 and the support trendline of the daily up channel from May.
This support zone was strengthened by the 61.8% Fibonacci correction of the sharp upward impulse from October.
Given the clear daily trend, Nasdaq-100 index can be expected to rise to the next resistance level 26250.00 (top of the previous impulse wave i).
