Nasdaq 100 (US100) – Short Opportunity Still AliveThe Nasdaq is still showing weakness at it's current level. There’s been more than enough time and news to push this market higher – but nothing happened. That, in itself, is a strong signal.
What we’re seeing now:
Weak jobs data: ADP and JOLTS both came in soft. Job openings hit the lowest level in nearly a year. That boosted rate-cut hopes – but the Nasdaq didn’t move.
Tech underperformance: Broader markets found some strength, but tech keeps lagging behind. Nasdaq isn’t leading like it used to – that’s bearish.
China IPO risks: New Nasdaq restrictions on Chinese listings are adding pressure to overall tech sentiment.
No follow-through: Even with dovish expectations and weak macro, bulls can’t lift the index. That says a lot.
Trade Setup (based on the chart):
Entry: between 23,480 and 23,520
Stop Loss: above 23,600 or if not high leverage even 23,720
Targets:
T1: 23,250
T2: 23,000
T3: will update depending on momentum
Why this short still makes sense:
The Nasdaq had multiple bullish triggers – weak data, Fed expectations, soft dollar – and didn’t move.
Sentiment is shaky, buyers aren’t stepping in.
Tech remains heavy while other sectors rotate.
Price is stalling right at resistance after a weak bounce.
Summary:
Plenty of chances to break out – but nothing happened. That’s a red flag.
I’m shorting between 23,480 and 23,520, with targets at 23,250 and 23,000.
Setup is invalid if we break cleanly above 23,720.
No financial advice – just how I see the chart right now.
Trade ideas

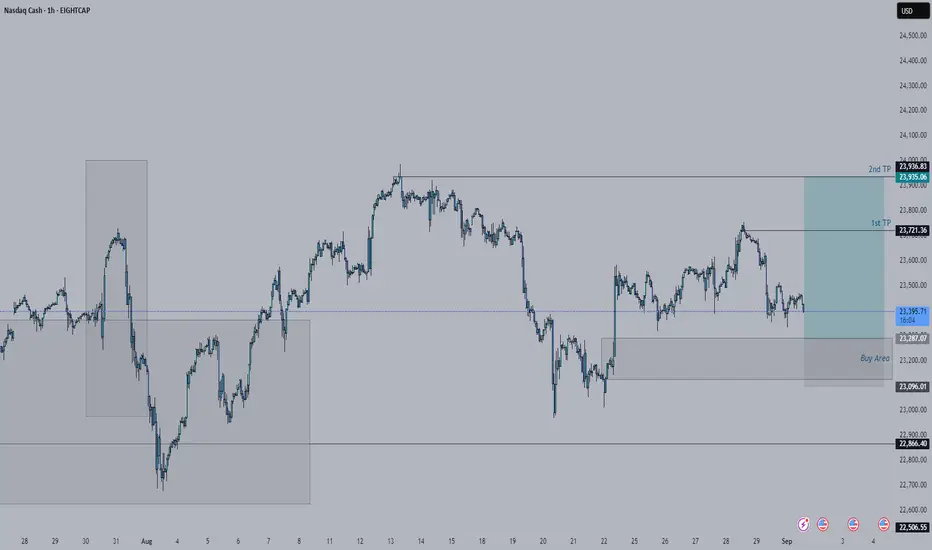
Potential Buy Zone for NAS100Trade what you see and not what you feel. This is what I see. There is a demand zone on 15 min which has not been balanced. There is also another demand zone below that one on 1hr time frame that has also not been balanced. Will wait for the market to retrace to the demand zone and if I get proper indications of going long on smaller TF I will take the long. I have a feeling though that the market might go to the lower demand zone because there is a potential formation of a H&S pattern forming. So, stop losses will be tight if I enter on the 15 min demand zone.

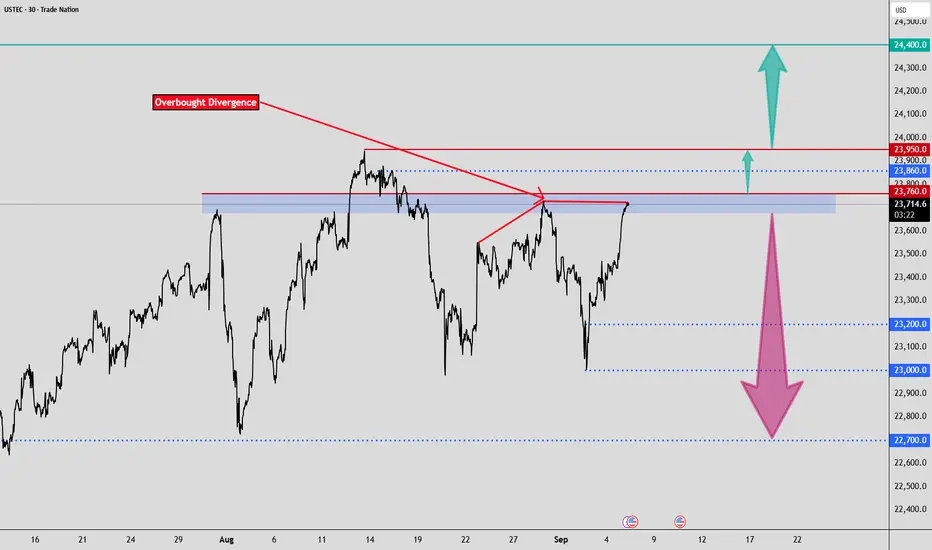
NAS100 - Divergence Detected 4 TodayDear Friends in Trading,
1) NFP Today - Be safe.
Keynote:
23860 is a liquidity pool.
Overbought Divergence detected up to 2HR TF.
NFP DATA - Anything is possible.
Let me know if anything is unclear?
I sincerely hope my point of view offers a valued insight.
Thank you for taking the time study my analysis.
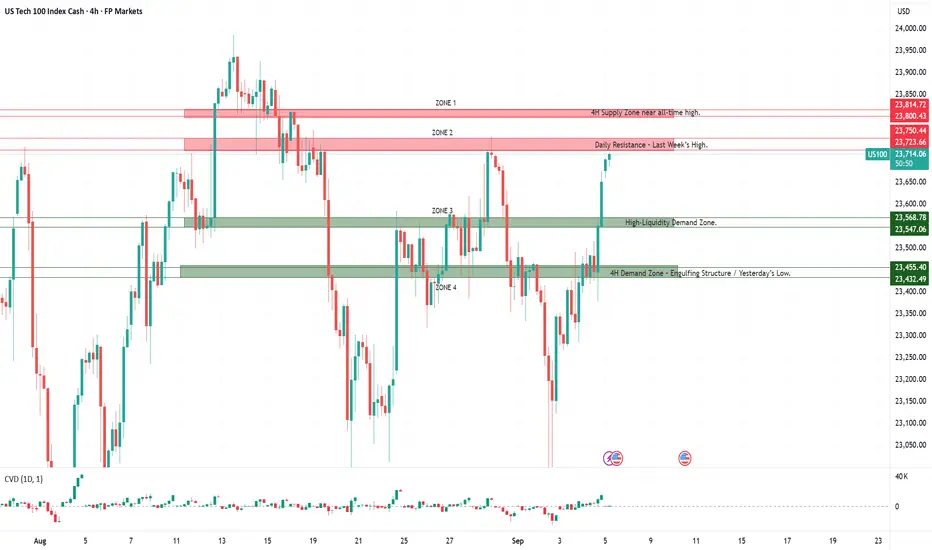
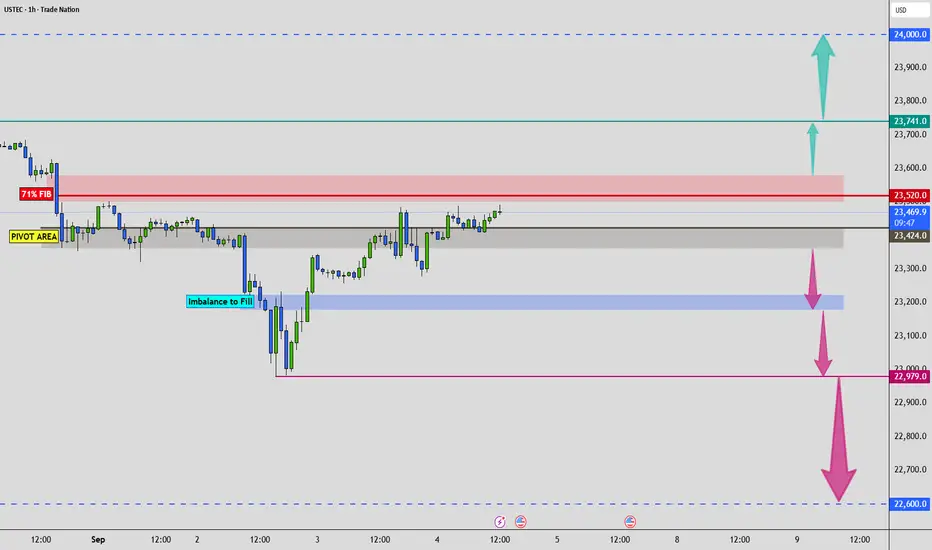
US100 – Today’s Key Trading ZonesHere are today’s trading zones for the US100. The levels are not fixed buy or sell signals, but decision areas where price often accelerates. Rejections can set up counter-trades, while clean breaks and retests can create continuation opportunities.
Zone 1
This area represents a major resistance close to the historical top. Price entering this zone carries a high probability of seller absorption and sharp rejection. A clean breakout and hold above would shift sentiment and open the door for new highs.
Zone 2
A key decision area from previous weekly highs. Often acts as a liquidity pool where breakout traps are common. A strong rejection can offer short opportunities, while a confirmed break and retest may flip the zone into support.
Zone 3
This level has repeatedly attracted strong reactions and carries high resting liquidity. Expect aggressive order flow here – either a sharp bounce for longs or, if broken, a continuation short on retest.
Zone 4
Formed around a strong 4H engulfing pattern and aligned with yesterday’s low. Buyers are likely to defend this level, making it a key intraday demand zone. A decisive break below would indicate seller dominance and could accelerate downside momentum.
Market Sentiment – Cautious Optimism
Overall sentiment in the US100 remains cautiously optimistic, supported by strong performance in Big Tech and expectations of a more dovish Fed. Still, the backdrop is fragile given broader macroeconomic signals, with investors balancing optimism against underlying economic risks.
Big Tech Drives the Market
Large-cap tech stocks led the market higher at record pace. Alphabet surged nearly 9%, Apple advanced 3–4%, and Tesla gained about 1.4%, boosted by a favorable antitrust ruling and strong technical momentum. Alphabet even reached a new record high, underscoring the sector’s ability to lift the entire index.
Macro Data – Mixed but Supportive
Weaker job openings data reinforced expectations of Fed rate cuts, a positive driver for growth stocks as lower bond yields support risk appetite. At the same time, the ISM Services PMI rose to 52.0, marking a third straight month of expansion and showing resilience in the services sector despite manufacturing weakness and a cooling labor market.
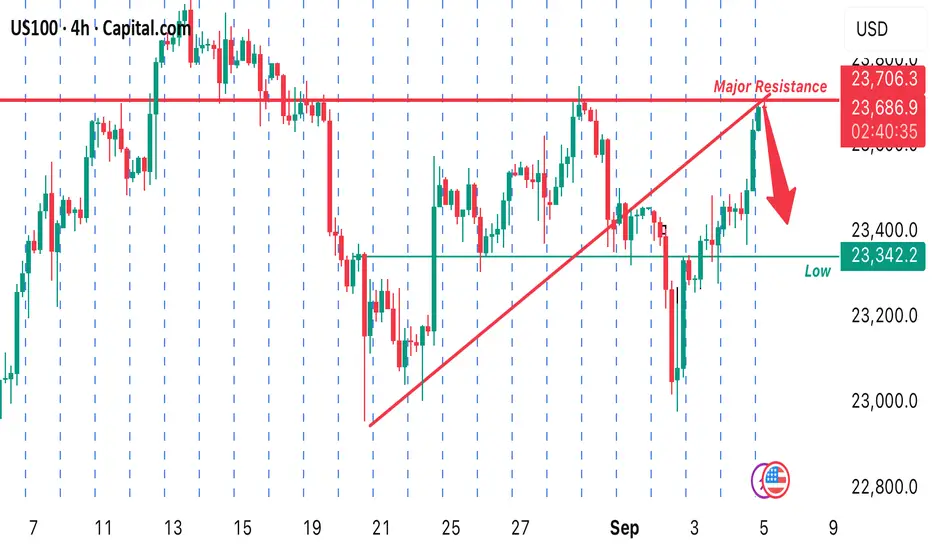
US100 APPROACHES RESISTANT LEVEL!Price just approached. Resistance level. potentially forming a double top pattern. Technically, I’m looking forward to selling from the current market price as it has a high tendency to sell off from that zone. A sell opportunity is envisaged.
Nasdaq - Preparing for another correction!🚔Nasdaq ( TVC:NDQ ) is starting to look weak:
🔎Analysis summary:
Over the course of the past couple of months, we witnessed an incredible rally on the Nasdaq. Following this previous price action, it is quite likely that we will soon see another correction. This could start with the current retest of the channel resistance trendline.
📝Levels to watch:
$23.000
SwingTraderPhil
SwingTrading.Simplified. | Investing.Simplified. | #LONGTERMVISION

Naz 100 in a tricky spotIts trying to break that downtrend as it got oversold on the way down.lets see if it can break the trend

NasDaq Bullish analysisNasDaq is currently retracing back on the gap it made previous movement it had. Bigger time frame NasDaq is buy, the movement it is making at the moment is just a reaction before it pushes back to the upside.
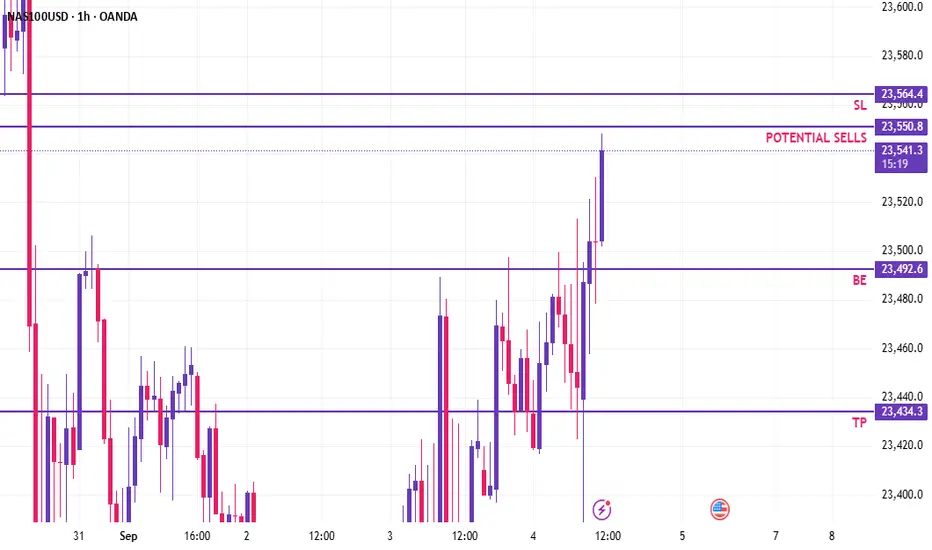
NAS100 | Price is approaching a key level for potential sellsAs price approaches this key level price could potentially sell off if we see good rejection. Let price play out and see if sellers step in at this level. If we are below look for sells above buys.
Nas100 Trade Update Sep 4 2025FX:NAS100
www.tradingview.com
Price came into bearish 1h FVG then formed 2m IFVG and hit tp3 60 pips at asia lows. Then hit bullish 1h FVG and formed 2m IFVG to hit tp3 60 pips at BSL

BUY STOP (NAS100)NAS is bullish
Inverse H&S
Buy stop on neckline and hold the buy until next psychological number = 24000.00

Nas100 Trade Set Up Sep 4 2025FX:NAS100
www.tradingview.com
price has made HH/HL with a big gap in between. It had came up and swept PDH in london session with a close below so what i want to see is either a sweep of SSL, close above, followed by 1m IFVG to go higher or a close below SSL levels to go lower towards HL/PDL

NAS100USD (SHORT)
Fib Level to continue Down trent
Break and retest on bullish flag
Nasdaq is a Downtrend

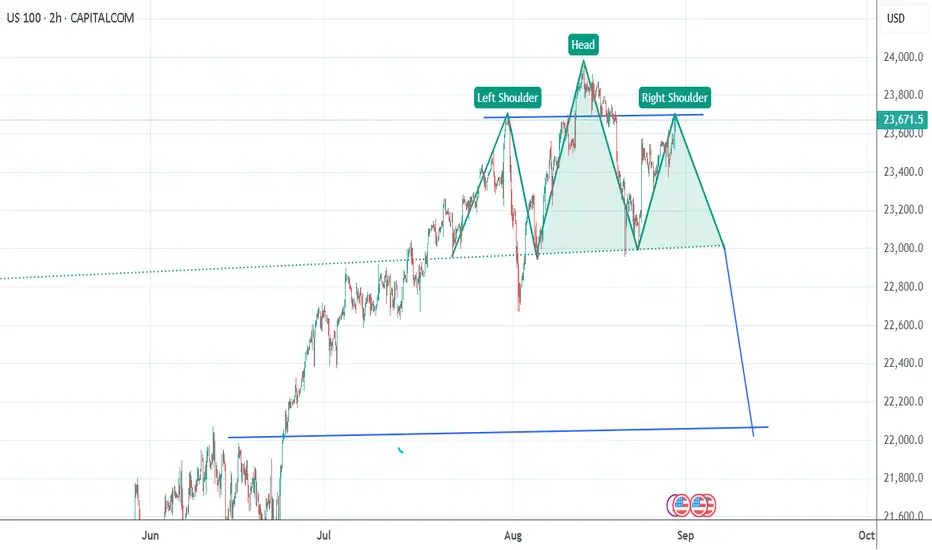
H & S patterntarget 22000
if we go down from here, i am expecting a major correction to 22k by sept end.
MIT NANDA bearish AI report
NVIDIA earning so so...
money moving to small cap
Not financial advice
NAS100 UPDATE - Potential 4 Pre-Post NFPDear Friends in Trading,
1) NFP tomorrow - Be Safe.
2) TIP - Post NFP Mondays: (Applies to all instruments - Forex, Indices & Metals)
-----"ASIA + LONDON SESSION's PRICE ACTION IS BIG AND OPEN MOST OF THE TIME"-----
3) Keynotes:
a) As PA progresses, I add updates/notes on this post.
b) I do not say or even think I am right most of the time.
c) But I do share what I see freely.
-----"YOU ARE MOST WELCOME TO FOLLOW THE PROGRESS WITH ME"-----
Let me know if anything is unclear?
I sincerely hope my point of view offers a valued insight.
Thank you for taking the time study my analysis.
Nasdaq 100 Holds Pivot Zone 23,280–23,360USNAS100 – Overview
The Nasdaq 100 reversed from the 23,045 support highlighted yesterday and is now trading above the pivot zone at 23,280–23,360.
Technical Outlook:
📈 Bullish scenario: As long as price holds above 23,280–23,360, upside momentum may extend toward 23,510 → 23,620 → 23,720. A confirmed breakout above 23,770 would strengthen the bullish trend and open the path to a new ATH near 24,090.
📉 Bearish scenario: On the downside, failure to hold above 23,280 would expose 23,045, with full bearish confirmation only if the index stabilizes below 22,990, targeting 22,720.
Key Levels:
Resistance: 23,510 – 23,620 – 23,720
Support: 23,280 – 23,045 – 22,720
