RUSSEL2000-SHORTSMONTHLY-pull buck phase
CONTEXT-Daily SIBI
entries should be on h1/5mnts depending on your trading style

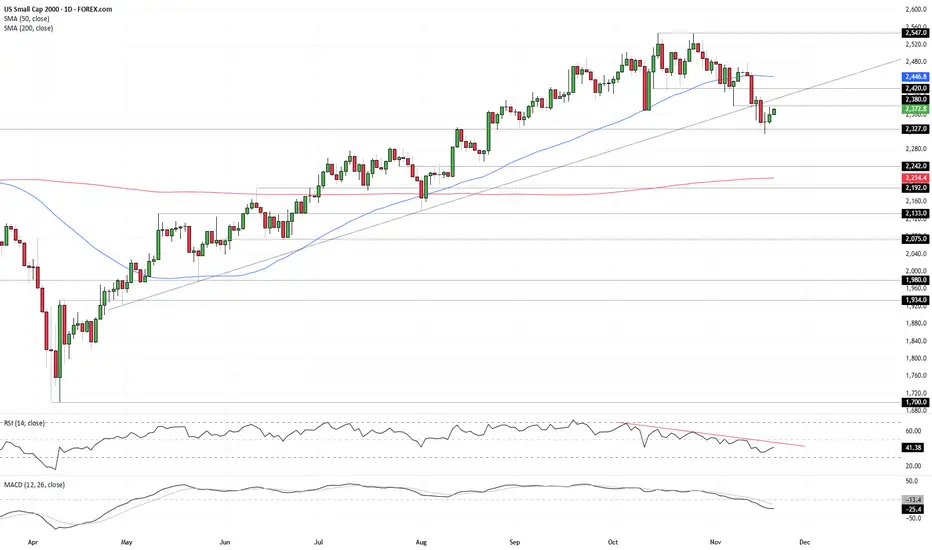
Small Caps Look VulnerableBe it the longest government shutdown in history, the largest increase in October layoffs since 2003, the increasingly unconvincing price action, shifting momentum picture, or the descending triangle it’s coiling in, the purest cyclical play in the U.S. equity index universe—the U.S. small caps 2000

Momentum Weak Despite Nvidia BoostShould small-cap U.S. equities be rallying because AI giant Nvidia just delivered another blowout earnings update? Sure, risk sentiment has improved, and continued AI investment comes with some immediate broader economic benefits, but the move still comes across as a little suspect, especially with
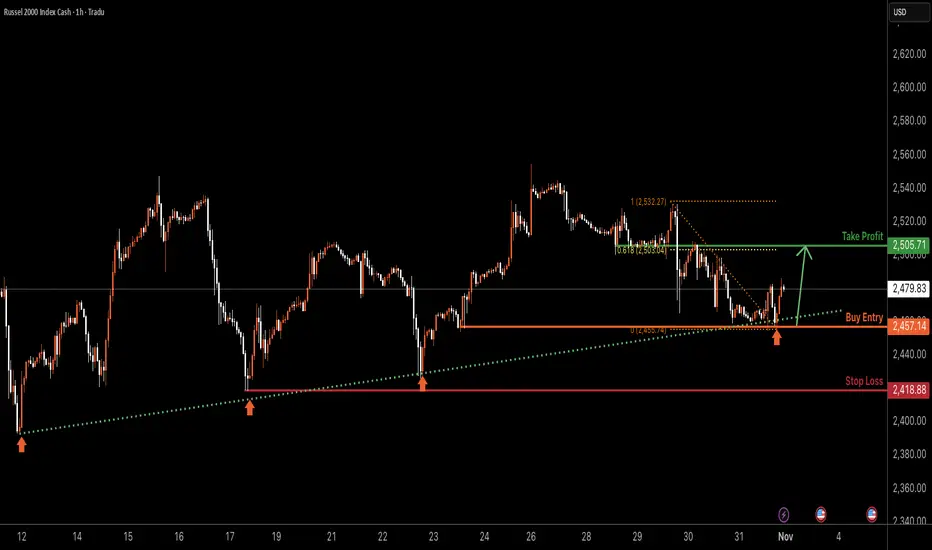
US2000 H1 | Bullish Bounce OffBased on the H1 chart analysis, we can see that the price has bounced off the buy entry, which is a pullback support and could rise from this level to the upside.
Buy entry is at 2,457.14, which is a pullback support.
Stop loss is at 2,418.88, which is a multi-swing low support.
Take profit is at
RUSSELL 25-year Channel Up giving a Sell Signal soon.Russell 2000 (RUT) has been trading within a 25-year Channel Up since the March 2000 High, which was the Top of the A.I. Bubble. Since then it only broke once during the 2008 Housing Crisis. Once recovered, it has used all standard macro levels of Support as short, medium and long-term buy entries r

US2000 H1 | Potential Bearish Drop Off US2000 has rejected the sell entry at 2,506.12, which is an overlap resistance and could drop from this level to the downside.
Stop loss is at 2,543.41, which is a swing high resistance.
Take profit is at 2,426.26, which is a multi swing low support.
Stratos Markets Limited (tradu.com ):
CFDs are

Where are we going Russell?I’ve been watching the Russell 2000 (small-cap index) and something feels different this time.
It’s pushing into new highs and the setup suggests we might be on the verge of a real breakout. I’m talking about +20% upside in the coming weeks or months , and not as a distant dream, but as a plausibl

Russell breaks outThe Russell has broken out of its short-term triangle continuation pattern to the upside. If the breakout holds, we could see a run to new all-time highs above 2547 from here. Key support around 2500 has held for now.
Risk appetite remains elevated as markets head into a critical window packed wi

Can the Russell 2000 Lead the Next Bull Wave Above Resistance?📊 RUSSELL 2000: The Ultimate Small-Cap Breakout Blueprint 🚀💰
🎯 Market Overview: IWM Russell 2000 Index Analysis
The Russell 2000 (RUT/IWM) is setting up for what could be a chef's kiss momentum play! 🧑🍳✨ We're tracking a bullish continuation setup backed by triangular moving average confluence and

See all ideas
Displays a symbol's price movements over previous years to identify recurring trends.
Frequently Asked Questions
Russel 2000 Index Cash reached its highest quote on Oct 27, 2025 — 2,554.70 USD. See more data on the Russel 2000 Index Cash chart.
The lowest ever quote of Russel 2000 Index Cash is 948.50 USD. It was reached on Mar 19, 2020. See more data on the Russel 2000 Index Cash chart.
Russel 2000 Index Cash is just a number that lets you track performance of the instruments comprising the index, so you can't invest in it directly. But you can buy Russel 2000 Index Cash futures or funds or invest in its components.