US30 Massive Short! SELL!
My dear friends,
Please, find my technical outlook for US30 below:
The instrument tests an important psychological level 47206
Bias - Bearish
Technical Indicators: Supper Trend gives a precise Bearish signal, while Pivot Point HL predicts price changes and potential reversals in the market.
Target - 46982
Recommended Stop Loss - 47329
About Used Indicators:
Super-trend indicator is more useful in trending markets where there are clear uptrends and downtrends in price.
Disclosure: I am part of Trade Nation's Influencer program and receive a monthly fee for using their TradingView charts in my analysis.
———————————
WISH YOU ALL LUCK
Trade ideas

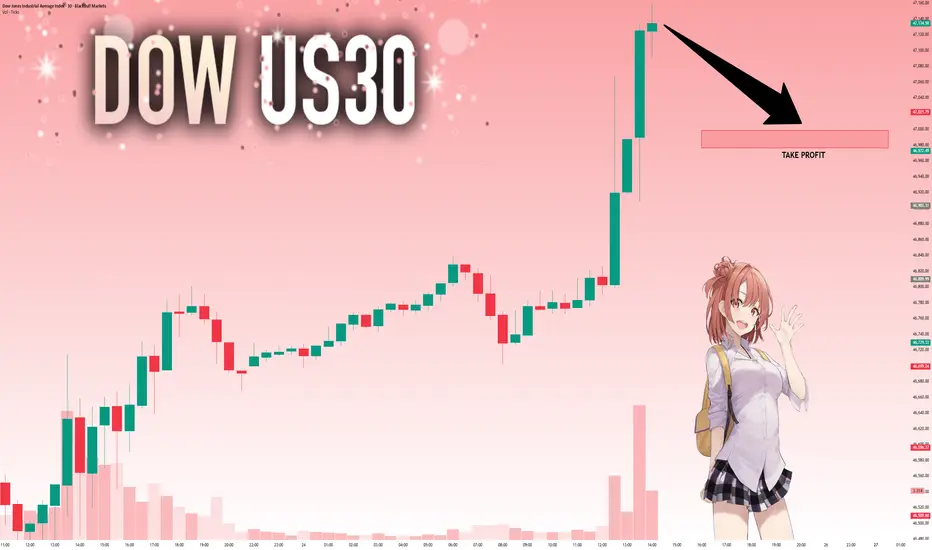
Dow Jones Swing Trade Setup – Is 48,000 the Next Stop?📈 US30 "Dow Jones Industrial Average" CFD: Thief's Wealth Strategy Map (Swing/Day Trade) 🚨
🎯 Swing/Day Trade Setup: US30 (Dow Jones Industrial Average CFD)
Get ready to sneak into the market with the Thief Strategy — a cheeky, layered limit-order approach to steal profits from the Wall Street shadows! 😎 This bullish plan is designed for swing or day trading, with a professional yet playful vibe to maximize your market heist. Let’s break it down! 🕵️♂️
🧠 Trade Idea: Bullish Heist on US30 🚀
Asset: US30 (Dow Jones Industrial Average Index CFD)
Market: Wealth Strategy Map (Swing/Day Trade)
Outlook: Bullish 📈
Strategy: The Thief Strategy — using multiple buy limit orders in a layered entry style to catch the best price levels. Think of it as setting traps for profits! 🕸️
📝 The Thief’s Plan: Layered Entry & Key Levels
🔑 Entry Strategy:
Deploy multiple buy limit orders to layer your entries like a master thief:
🎯 46,500
🎯 46,600
🎯 46,700
🎯 46,800
Pro Tip: Feel free to add more layers based on your risk appetite or market conditions. The more traps, the merrier! 😜
Flexible Entry: You can enter at any price level within this range, but layering helps you average into the position like a sneaky pro.
🔐 Stop Loss (SL):
Set at 46,300 — the Thief’s escape hatch! 🚪
Note: Dear Ladies & Gentlemen (Thief OGs 🕶️), this SL is my suggestion, but it’s your heist! Adjust based on your risk tolerance and account size. Only risk what you can afford to lose!
🎯 Take Profit (TP):
Primary target: 47,600 — a juicy profit zone before the Police Barricade (resistance) at 48,000.
Why 47,600? This level avoids the overbought trap and potential reversal at 48,000, where strong resistance and market shenanigans may lurk. 🕵️♂️
Note: Thief OGs, this TP is my call, but you’re the boss! Take profits at your own discretion and secure the bag. 💰
🔍 Why This Setup? Key Analysis Points
Market Context: The US30 is showing bullish momentum, supported by recent economic data and market sentiment (check social posts and financial news for real-time vibes).
Technical View:
The layered entry approach leverages potential pullbacks within a bullish trend, maximizing your entry efficiency.
The 46,300 SL is placed below key support to protect against sudden reversals.
The 48,000 level acts as a major resistance (overbought zone + psychological barrier), making 47,600 a safer TP.
Risk Management: The Thief Strategy spreads risk across multiple entry points, reducing the impact of volatility spikes.
💹 Related Pairs to Watch (Correlated Assets in USD)
To boost your market awareness, keep an eye on these correlated assets:
SP:SPX (S&P 500 Index CFD): Moves closely with US30 due to shared exposure to U.S. large-cap stocks. A bullish US30 often aligns with SPX strength. 📈
PEPPERSTONE:NAS100 (Nasdaq 100 Index CFD): Tech-heavy index that can amplify or diverge from US30 moves. Watch for tech sector momentum. 💻
FX:USDJPY (Forex Pair): A stronger USD often supports bullish US equity indices like US30. Monitor for USD strength or Yen weakness. 💵
Key Correlation Insight: If SP:SPX and PEPPERSTONE:NAS100 show similar bullish patterns, it reinforces the US30 setup. Conversely, a sharp USDJPY drop could signal caution for US indices.
⚠️ Disclaimer
This Thief Style trading strategy is just for fun and educational purposes! 😜 Trading involves risks, and past performance doesn’t guarantee future results. Always conduct your own analysis, manage risk wisely, and only trade what you can afford to lose.
✨ If you find value in my analysis, a 👍 and 🚀 boost is much appreciated — it helps me share more setups with the community!
#US30 #DowJones #ThiefStrategy #SwingTrading #DayTrading #Bullish #TechnicalAnalysis #TradingView #WealthStrategy

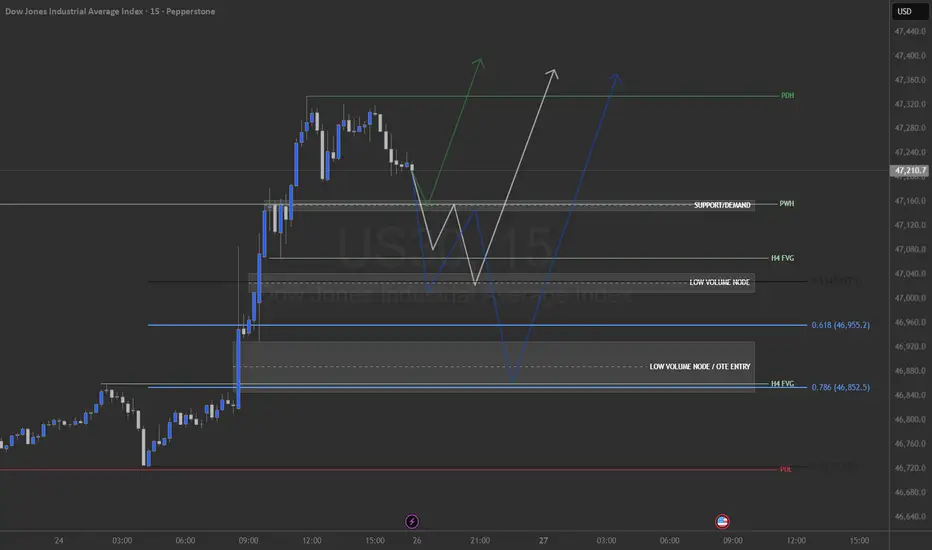
US30 WEEK STARTING 27/10US30 ANALYSIS (BULLISH SENTIMENT)
FIB 618-786 OTE = 46850 to 46956
Support @ 47145 to 47165 with PWH overlap
Low volume nodes
Node 1 = 47010 to 47040 (50% fib overlap & H4 FVG)
Node 2 = 46845 to 46925 (FIB Golden Zone OTE & H4 FVG)
Scenarios 1, 2 and 3 are probable plays.
This play expects that we open the new week in the range of PDH or lower.
DJI (US30) SPOT TECHNICAL ANALYSIS 📊 DJI (US30) SPOT TECHNICAL ANALYSIS | Oct 27-31, 2025 | Intraday Swing Trading Blueprint 🚀
Current Price: 42,210.7 | Timeframe Focus: 5M, 15M, 30M, 1H, 4H & 1D ⏰
━━━━━━━━━━━━━━━━━━━━━━━━━━━━━━━━━━━━━━━━━━━━━━━
🔍 DAILY (1D) ANALYSIS - Swing Trade Framework
On the daily timeframe, DJI exhibits strong bullish momentum with price trading above key exponential moving averages (EMA 50 & 200). 📈 The Ichimoku Cloud shows bullish alignment with price above the cloud, indicating sustained uptrend. Elliott Wave analysis suggests we're in Wave 3 or Wave 5 of an impulse sequence.
Key Support: 41,800-42,000 | Key Resistance: 42,500-42,800
Bollinger Bands on 1D are expanding, confirming rising volatility . RSI hovers near 60-70 zone (approaching overbought but not critical). Volume profile shows accumulation phases at lower levels with distribution emerging at current price action. Dow Theory confirms higher highs and higher lows pattern intact. 💪
━━━━━━━━━━━━━━━━━━━━━━━━━━━━━━━━━━━━━━━━━━━━━━━
⚡ 4-HOUR (4H) SWING TRADE Setup - PRIMARY ENTRY SIGNAL
4H chart displays bullish breakout potential above 42,400 resistance. Harmonic Pattern analysis reveals potential Gartley reversal at support (41,950-42,050). RSI at 65 indicates strong momentum without extreme overbought conditions. 📊
Wyckoff Accumulation: Identified spring pattern suggesting buyers in control
VWAP Analysis: Price above VWAP = bullish bias maintained
Volume Breakout: Watch for volume spike above 42,400 for confirmation
Gann Theory Angle: 45° resistance level aligns with psychological 42,500 mark. Entry on breakout with stop loss at 42,050. Target: 42,650 for quick swing profits! 🎯
━━━━━━━━━━━━━━━━━━━━━━━━━━━━━━━━━━━━━━━━━━━━━━━
🎯 1-HOUR (1H) INTRADAY SCALP SETUP
Hourly timeframe shows consolidation within 42,100-42,300 range . Elliott Wave suggests completion of Wave 2 correction with Wave 3 breakout imminent. 💥 Bollinger Bands are contracting = volatility squeeze incoming!
RSI oscillates near 50 (neutral zone) - PERFECT setup for directional bias confirmation. Support holds at 42,150 (VWAP cluster). Resistance breakout at 42,350 triggers aggressive long entry.
Harmonic Pattern Recognition: Butterfly reversal pattern forming near support zone. Risk/Reward ratio: 1:3 on breakout trades! 📈
━━━━━━━━━━━━━━━━━━━━━━━━━━━━━━━━━━━━━━━━━━━━━━━
⏱️ 30-MINUTE (30M) TACTICAL ENTRY GUIDE
30M timeframe is CRITICAL for entry timing ! Currently showing micro-consolidation with 3 candle reversal pattern forming. Ichimoku Cloud on 30M provides dynamic support around 42,200.
Watch for: Channel breakout above 42,280 for aggressive long setup
Simple Moving Average (SMA 20) acts as dynamic support. Exponential Moving Average (EMA 9) shows bearish crossover risk - key reversal indicator! ⚠️ RSI dip below 50 offers contrarian entry for counter-trend scalps.
Volume Spike Incoming: Wyckoff Distribution phase detected - anticipate volatility expansion into London/US session open! 🌍
━━━━━━━━━━━━━━━━━━━━━━━━━━━━━━━━━━━━━━━━━━━━━━━
🚀 15-MINUTE (15M) MOMENTUM BREAKOUT SETUP
Perfect swing trade entry timeframe ! 15M displays textbook Elliott Wave 5-wave pattern completing. Price oscillating in 42,150-42,350 box. 📦
Bollinger Band Squeeze: Expansion breakout imminent this week
RSI Divergence: Bullish reversal divergence between last two lows
VWAP Bounce: Strong rejection from VWAP = trend resumption likely
Dow Theory Confirmation: Higher lows maintained perfectly. Harmonic Pattern (Gartley) completion nearing 42,050-42,100. Gann angles converge at 42,420 - MAJOR BREAKOUT ZONE! 🎯
━━━━━━━━━━━━━━━━━━━━━━━━━━━━━━━━━━━━━━━━━━━━━━━
⚡ 5-MINUTE (5M) ULTRA-SCALP ENTRIES - EXECUTION TIMING
5M chart = TRADE EXECUTION window ! Shows tight consolidation within 15 pips range (42,210-42,225). Japanese candlestick patterns reveal Doji + Hammer reversal formations. 🔨
Ichimoku Cloud on ultra-low timeframe provides micro S&R; levels. RSI oscillating 45-55 zone = prepare for directional breakout. Volume surge on breakout candle = GREEN LIGHT for entry! 💚
Bollinger Bands on 5M are at tightest compression - expect violent move incoming! Stop losses tight at 42,190 for risk management.
Target 1: 42,280 | Target 2: 42,350 | Target 3: 42,420
━━━━━━━━━━━━━━━━━━━━━━━━━━━━━━━━━━━━━━━━━━━━━━━
📌 WEEKLY TRADING STRATEGY (Oct 27-31)
BULLISH BIAS DOMINATES across all timeframes! Wyckoff accumulation + Elliott Wave Wave 3 setup = explosive move likely. RSI proximity to overbought (not yet extremes) = continuation room.
Key Trading Rules:
Harmonic Pattern targets hit first = take 50% profits
Gann angles breached = add to position
VWAP rejection at support = reversal setup triggered
Volume confirmation on breakouts = only trade valid entries
Volatility Expected: Bollinger Band width expansion + options expiry week = 150-200 pips potential range! 🔥
Reversals Watch: Identifying overbought RSI extremes above 75 triggers pullback potential. Support zones (42,050-42,100) act as reversal pivots. Breakout failures at 42,500 = harmonic reversal zones activate.
Risk Management Critical: Use tight stops at 42,190. Take profits at Gann angles. Scale in using Wyckoff distribution signals. Ichimoku Cloud breakouts = strong follow-through probability.
━━━━━━━━━━━━━━━━━━━━━━━━━━━━━━━━━━━━━━━━━━━━━━━
🎯 FINAL VERDICT: BUY breakout above 42,400 | HOLD through 42,500-42,650 targets | EXIT on harmonic reversal signals
#DJI #US30Spot #TechnicalAnalysis #ElliottWave #SwingTrading #IntraDayTrading #Harmonic #WyckoffMethod #TradingView #ForexAnalysis #StockMarket #CryptoCommunity #TradersOfTwitter #TechnicalAnalyst #BreakoutTrade #MomentumTrading #VolumeAnalysis #VWAP #BollingerBands #RSI #Ichimoku #GannTheory #DowTheory #TradingSignals #Oct2025 🚀📊💹
━━━━━━━━━━━━━━━━━━━━━━━━━━━━━━━━━━━━━━━━━━━━━━━
Disclaimer: This analysis is educational only. Not financial advice. Always trade with proper risk management and your own analysis. Past performance ≠ future results. Trade at your own risk! ⚠️
Study the charts, confirm setups, and execute with precision! Happy trading! 🎯💰
US30: Move Down Expected! Short!
My dear friends,
Today we will analyse US30 together☺️
The recent price action suggests a shift in mid-term momentum. A break below the current local range around 47,135.50 will confirm the new direction downwards with the target being the next key level of 46,998.29 and a reconvened placement of a stop-loss beyond the range.
❤️Sending you lots of Love and Hugs❤️
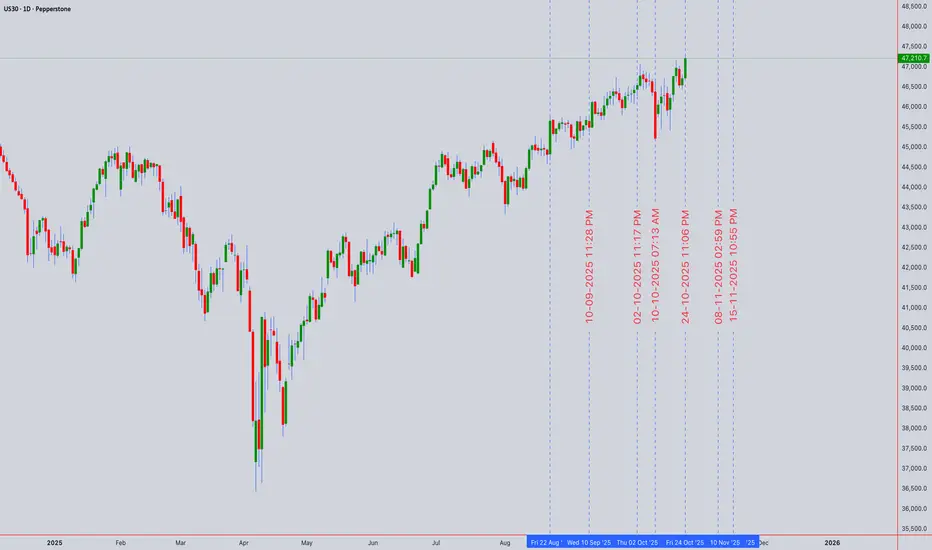
US30By the end of the week, a minor upward movement is expected in the index to form the second high node, after which, to complete the current upward cycle, the price will decline to levels around 45,600. This is a personal analysis, and naturally, the responsibility for any trading decisions rests solely with the individual.

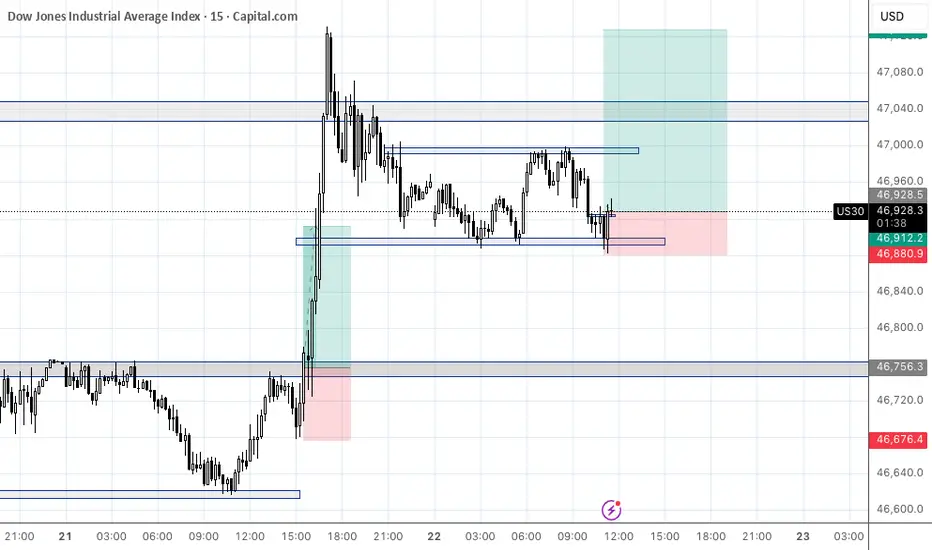
US30: Price fails to break high, sellers step inSPREADEX:DJI – Price Rejects Previous High, Possible Pullback Ahead
🕒 Timeframe: 30-Minute Chart
📊 Data Source: Spreadex
💵 Currency: USD
________________________________________
🧠 Short Summary (SEO Preview)
US30 (Dow Jones) has rejected its previous swing high near 47,100 after a strong bullish recovery. Price action now shows early signs of weakness from the supply zone, suggesting a potential short-term correction before the next directional move.
#US30 #DowJones #WallStreet #PriceAction #SupplyAndDemand #TechnicalAnalysis #TradingViewIdeas
________________________________________
📈 Market Overview
After forming a solid base around 46,250 – 46,300, the Wall Street Index (US30) has staged a strong V-shaped recovery.
However, recent candles show that price was rejected at the previous high around 47,100, indicating that buying momentum may be fading as the market hits a strong supply zone.
________________________________________
🔍 Key Technical Zones
Supply Zone (Resistance):
47,000 – 47,150
This zone aligns with the previous swing high where strong selling pressure emerged.
The rejection from this level signals potential exhaustion of buyers in the short term.
Demand Zone (Support):
46,750 – 46,850
This is a former resistance area turned support. A retest here could trigger a short-term bullish reaction before the market decides its next move.
________________________________________
🎯 Trading Scenarios
Scenario 1 – Rejection from Supply Zone (Main Bias)
1. Price has tested the 47,000 – 47,150 zone and rejected the previous high.
2. If sellers remain in control, a pullback toward 46,750 – 46,850 is likely.
3. A deeper correction could extend toward 46,600 – 46,650 if momentum builds.
Scenario 2 – Breakout Above Supply Zone
1. A confirmed candle close above 47,150 would invalidate the short-term bearish bias.
2. In that case, 47,150 may flip into support, opening room for 47,300 – 47,400 as the next bullish targets.
________________________________________
🧭 Technical Outlook
• The rejection of the previous high at 47,100 confirms a key resistance zone.
• Momentum is slowing, suggesting a likely short-term pullback before any new highs.
• Potential strategy: Wait for bearish confirmation (e.g., rejection candle, lower-high formation) around 47,000 – 47,150 before making any decision.
________________________________________
Disclaimer
This analysis is for educational and technical purposes only — not financial advice.
Always manage risk and follow your own trading plan before taking any trades.
Please like and comment below to support our traders. Your reactions will motivate us to do more analysis in the future 🙏✨
Harry Andrew @ ZuperView

Us30 Trade Set Up Oct 24 2025Price is trading higher due to CPI news and has swept BSL and could sweep ATL but it price closes under those levels i will look for internal structure to target Asia lows/SSL or 4h FVG. But if prices comes down first to sweep SSL i will look for buys to ATH

DowJones bullish reaction to US 3% Inflation dataKey Support and Resistance Levels
Resistance Level 1: 47156
Resistance Level 2: 47285
Resistance Level 3: 47413
Support Level 1: 46450
Support Level 2: 46270
Support Level 3: 46126
This communication is for informational purposes only and should not be viewed as any form of recommendation as to a particular course of action or as investment advice. It is not intended as an offer or solicitation for the purchase or sale of any financial instrument or as an official confirmation of any transaction. Opinions, estimates and assumptions expressed herein are made as of the date of this communication and are subject to change without notice. This communication has been prepared based upon information, including market prices, data and other information, believed to be reliable; however, Trade Nation does not warrant its completeness or accuracy. All market prices and market data contained in or attached to this communication are indicative and subject to change without notice.

24-10-2025 Intraday Plan (CPI + NY Open Scenario) – US30 5M/1M💬 Intraday Plan (CPI + NY Open Scenario) – US30 5M/1M
📍 Bias remains bullish above 46,700 (structure still forming higher lows).
📍 Expecting CPI at 13:30 to create a liquidity grab — ideally sweeping lows into the ascending trendline/support.
📍 After CPI spike settles, looking for a NY Open breakout above 46,850 (key resistance).
📍 If we get a break + retest of 46,850, I’ll look for long entries targeting:
✅ TP1: 47,000
✅ TP2: 47,100
✅ TP3: 47,200 (liquidity extension)
❌ If CPI breaks below 46,700 and fails to recover, I’ll reassess for a bearish scenario.
🕒 No trades during initial CPI spike – waiting for structure confirmation post-news & into NY session.
📌 Plan: CPI grab → NY breakout → retest entry → continuation.

US30 | CPI to Dictate Market DirectionUS30 | Direction Awaits CPI Data
The Dow Jones is set to react strongly to today’s CPI release —
a higher-than-expected reading could trigger bearish momentum,
while a softer print may extend the bullish trend.
Technically:
The index shows bullish potential if it can close a 1H candle above 46,915, targeting 47,090 → 47,230.
However, a 1H close below 46,780 would shift momentum bearish, opening the path toward 46,600 → 46,420.
Pivot Line: 46,850
Resistance: 47,090 – 47,230
Support: 46,600 – 46,420

US30 (Dow Jones) Technical Breakdown – 10/24/2025📍 US30 (Dow Jones) Technical Breakdown – 10/24/2025
US30 bouncing strong off the 46,500 demand zone and reclaiming EMAs 📈 Bulls showing strength again, but price now pressing into a major resistance area near 46,830–46,900, where it’s been rejected multiple times 🔥
📊 Market Behavior:
🔹 EMAs flipped bullish after a clean higher low
🔹 Price retesting key structure at 46.8K
🔹 Buyers defending the 46.5K region aggressively
📌 Key Levels:
🔹 Resistance Zones:
46,830 → current intraday cap
46,900 → breakout confirmation
47,100 → bullish continuation target
🔹 Support Zones:
46,520 → local demand
46,300 → EMA retest zone
45,550 → major higher-timeframe support
🧠 Bias:
Bullish ⚡
➡️ Above 46,900 → bullish breakout toward 47,100+
⬅️ Below 46,500 → possible correction back to 46,300

US30 Bearish Leg from $46,800Hi everyone,
Sharing a 15m US30 chart for you guys.
This morning, price traded above previous days high and then gave a bearish reaction.
On the shared chart I have the Asian Low (AL) marked out, which has not been swept or traded below yet.
So this could potentially be a good interim bearish target.
This current $46,800 price level could potentially act as a pivot point if the correct confluences form on the lower time frame such as the 5m chart.
Confluences @ $46,800:
- 61.8% FIB
- OB area
- 1h FVG area
Kind regards,
Aman

US30 long idea-Price broke previous daily high 1 hour before the start of London session indicating the search for new highs.
- 3am volume should be enough to continue the bullish momentum until a new level of resistance is hit or until buyers lose their power.
- 50% Gann key zone broke then used as sturdy support to climb 80 pips so far
- Bearish FVG at 46,882 created on Oct 22 9am is still yet to be filled/hit.
I am not a financial advisor. This is simply my opinion/bias

US30 longI see great buying power coming.
sentiments are looking risk on and positive for US stocks as Us and china look to be interested in making a trade deal.
technicals show that at the current price levels buyers have come in to purchase driving price up
Us30 Trade Set Up Oct 23 2025We are now in a strong bearish trend so i will be looking for price to sweep BSL before making internal bearish structure on the 1m-5m looking for IFVG and CISD to take sells to lower SSL

Us30 Trade Secured 1500 Pipstrade played out perfectly, made LH/LL on the 15m, closed under daily BSL so i knew the target had to the daily FVG as imbalance. Waited for BSL to be taken with a BOS in the 15m to push down

DowJones at pivotal 46450 levelKey Support and Resistance Levels
Resistance Level 1: 47156
Resistance Level 2: 47285
Resistance Level 3: 47413
Support Level 1: 46450
Support Level 2: 46270
Support Level 3: 46126
This communication is for informational purposes only and should not be viewed as any form of recommendation as to a particular course of action or as investment advice. It is not intended as an offer or solicitation for the purchase or sale of any financial instrument or as an official confirmation of any transaction. Opinions, estimates and assumptions expressed herein are made as of the date of this communication and are subject to change without notice. This communication has been prepared based upon information, including market prices, data and other information, believed to be reliable; however, Trade Nation does not warrant its completeness or accuracy. All market prices and market data contained in or attached to this communication are indicative and subject to change without notice.

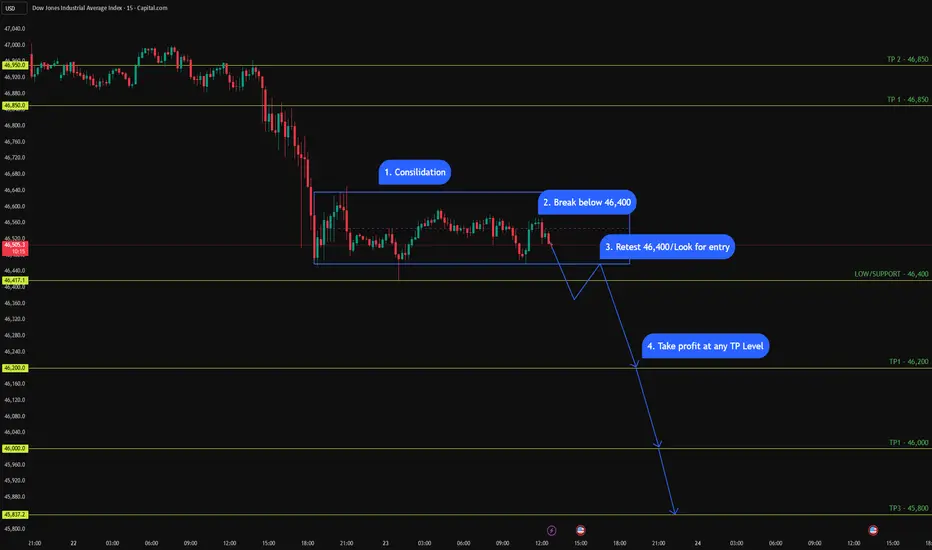
US30 (15M - 1M Daily Setup) - Bearish Bias US30 (15M - 1M Daily Setup) - Bearish Bias 📉
Price is consolidating under key resistance, forming lower highs. I’m watching 46,400 as the make-or-break level.
✅ Plan:
1️⃣ Consolidation phase complete
2️⃣ Looking for a clean break below 46,400
3️⃣ Retest → possible short entry
4️⃣ Target zones:
• TP1 → 46,200
• TP2 → 46,000
• TP3 → 45,800
📍 Bias stays bearish as long as price remains below 46,850 – 47,000.
Let’s see if the breakdown plays out. 👀
US30 BEARISH SETUP Price is currently knocking on resistance 46783. By the momentum of the double bottom price should push to new levels

Continuation to the upside Us30 indicated continuation to the upside on 30 to H1 timeframe and has supported on both and expected to go for all time high

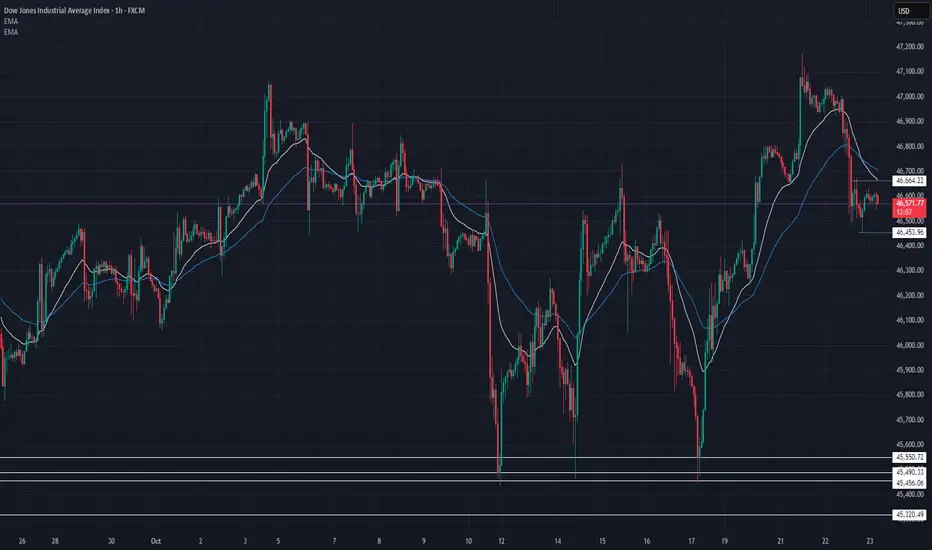
US30 Technical Breakdown – 10/23/2025📍 US30 Technical Breakdown – 10/23/2025
US30 seeing a sharp rejection from the 47,100 area, now consolidating around the 46,600 zone. Bears have regained short-term control as EMAs flip bearish — momentum slowing after recent upside pushes 😴📉
📊 Market Behavior:
🔹 Clean rejection off 47,000 resistance
🔹 EMAs crossing down, showing bearish pressure
🔹 Price ranging between 46,450 – 46,700
📌 Key Levels:
🔹 Resistance Zones:
46,664 → intraday resistance
46,850 → key supply zone
47,100 → breakout threshold
🔹 Support Zones:
46,450 → near-term demand
46,226 → structure support
45,550 → macro support for bulls
🧠 Bias:
Bearish ⚠️
➡️ Below 46,450 → sell momentum could push to 46,200
⬅️ Above 46,700 → bulls may try to retest 46,900
uptrend Given the failure of the resistance area, the consolidation above the resistance area is expected to continue the upward trend to the specified resistance levels.
