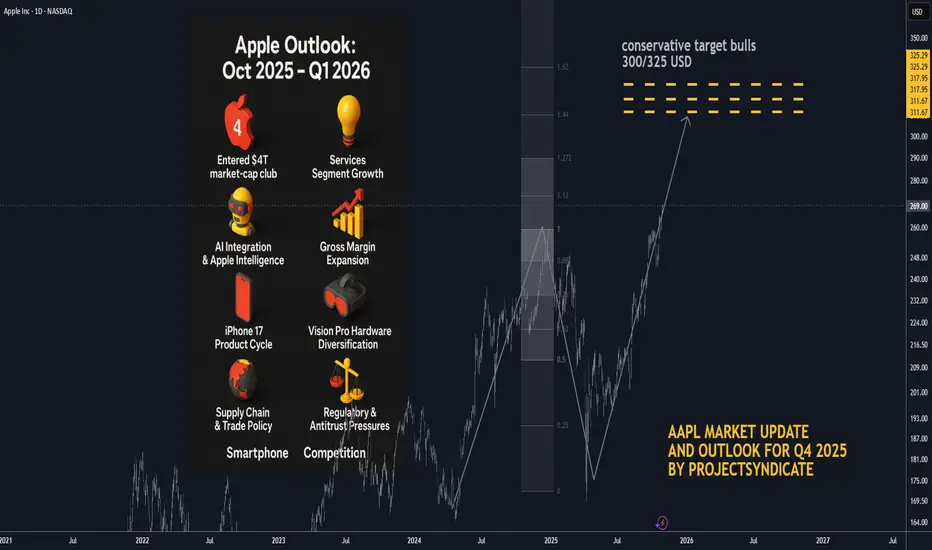
AAPL: Q1 2026 Target and Updated Outlook BULLS🍏 Apple Outlook: Oct 2025 – Q1 2026
🧠 Status and Tape Read. Apple (AAPL) has entered the $4 T market-cap club on Oct 28–29 2025, propelled by strong iPhone 17 sell-through and Services momentum. Shares pushed toward the $270 area intraday before easing, marking a powerful reversal from mid-year consolidation. Near-term, positioning is elevated into Thursday’s print; options imply ~±4% move on earnings.
📈 Path into Q1’26. Our base case shifts from a prolonged correction to a higher-low / buy-the-dip regime: dips toward the mid-$240s–$250s should attract sponsorship unless Services rolls over or China iPhone demand fades. A constructive tape through Q1’26 hinges on (1) Apple Intelligence engagement metrics, (2) iPhone 17 replacement/Android switcher rates, and (3) regulatory overhang.
📰 What’s New and recent headlines
🏆 Apple hits $4 T market value for the first time, joining Nvidia and Microsoft. Drivers: iPhone 17 traction and Services strength; stock up sharply since spring.
🗓️ Earnings set for Thu, Oct 30 (after-close); Street looking for growth in revenue/EPS; Services eyed >$100 B annual run-rate.
🔼 Loop Capital upgraded AAPL to Buy with $315 PT ahead of the move, citing iPhone cycle acceleration.
🧾 “Who Bought 8 Million Shares?”
🧺 JPMorgan Large Cap Growth Fund (SEEGX) increased its Apple position by ~8.15 million shares to ~32.9 million shares, per latest fund tracking.
⚙️ Catalysts Shaping Apple’s Stock Price in 2025–26
🤖 AI Integration & Apple Intelligence — Strength: 9/10
Rollout of on-device Apple Intelligence and upgraded Siri remains the core narrative into 2026. Look for user engagement datapoints and third-party app integrations at/after earnings. A positive read-through would validate the iPhone super-cycle argument.
💡 Services Segment Growth — Strength: 8.5/10
Consensus expects Services to push past a $100 B annual clip; durability watched versus regulatory pressure (DMA in EU, global app store scrutiny). A sustained >13% YoY growth print keeps multiple support intact.
📊 Gross Margin Expansion & Cost Efficiencies — Strength: 8/10
Management has guided 46–47% GM for FQ4 (tariff headwind embedded). Mix shift to Services + component deflation support FY26 margin resilience.
📱 iPhone 17 Product Cycle — Strength: 8/10 (↑ from 7.5)
Early sell-through outpacing prior gen in the U.S. and China within first days; the iPhone 17 (incl. “Air”) is the incremental driver restoring unit momentum.
🥽 Vision Pro & Hardware Diversification — Strength: 7/10
Next-gen devices + Apple Intelligence tie-ins create optionality; still niche near-term but adds ecosystem gravity.
💵 Capital Returns — Strength: 7/10
$110 B buyback authorization remains a floor; watch cadence vs. stock at ATHs and post-print cash deployment commentary.
🌏 Supply Chain & Trade Policy — Strength: 6.5/10
China exposure/tariffs remain a swing factor; Apple has been absorbing some costs rather than pushing through prices on key models.
⚖️ Regulatory & Antitrust Pressures — Strength: 6/10
DMA compliance and global app store cases could trim Services take-rate; monitor any remedial changes called out on the call.
📈 Macro & Rates — Strength: 5/10
“Higher for longer” limits multiple expansion; any disinflation/soft-landing upside would expand P/E support.
🥊 Smartphone Competition — Strength: 5/10
Android OEM velocity still high in EM; Apple’s cycle needs sustained switcher share to outrun.
💼 Earnings Set-Up: FQ4 reporting Thu Oct 30 2025
📅 Consensus into print:
• Revenue: ~$101–104 B (TipRanks ref: $102.2 B)
• EPS: ~$1.74–$1.82 (TipRanks ref: $1.78)
• Gross Margin guide: 46–47% (company indication)
• Services: watch for >$100 B annualized pace confirmation
• Implied move: options pricing ~±4%
🎧 Watch items on the call: Apple Intelligence activation/MAUs, iPhone 17 channel inventory, China mix, Services take-rate headwinds (EU), GM puts/takes (tariffs), cap-return cadence.
🎯 Street Positioning & Targets
🔼 Loop Capital: Buy, PT $315 (Oct 20/21 2025).
📊 General take: Many houses remain Overweight; focus turning to 2026 EPS power and AI monetization path.
🧭 Tactical View 0–3 Months
📈 Into/after print: Choppy but constructive. Chasing at ATHs is risky; prefer buy-on-weakness zones near $248–255 with stop discipline. A bullish guide/Services beat could sustain a breakout; a light AI engagement update or China wobble likely gets faded back into the mid-$250s.
⚠️ Risk-case: Regulatory headline or guide below mid-single-digit growth could quickly compress P/E and retest the $240s.
🚀 Bull-case: Clean beat/raise + AI usage KPIs → re-rate toward $290–300 into holiday.
🏁 Quick Milestone Recap
🥇 $4 Trillion Market Cap achieved on Oct 28–29 2025, making Apple the third public company (after Nvidia, Microsoft) to reach the level; iPhone 17 momentum and Services strength cited across coverage.
Trade ideas
The Phantom TradeThe Phantom Trade .... In the spirit of Halloween ...
NOTE – This is a post on mindset and emotion. It is not a trade idea or strategy designed to make you money. My intention is to help you preserve your capital, focus, and composure — so you can trade your own system with calm and confidence.
You missed it.
The setup you’d been watching for days, maybe weeks finally played out.
Clean. Precise. Exactly as planned.
But you weren’t in it.
Maybe you hesitated.
Maybe the trigger didn’t line up perfectly.
Or maybe you just weren’t at your desk.
Either way, it’s done.
But your mind doesn’t let it go.
You replay it.
Frame by frame.
You check where you would have entered, where you would have exited.
You tell yourself it’s “reviewing.”
But it’s not.
It’s rumination.
A mental loop that feels productive but keeps you stuck in what can’t be changed.
You’re not trading the market anymore… you’re trading your memory of it.
And every replay reinforces the belief that you should’ve done better.
The body joins in too.
Tight chest. Restless legs.
An urge to make it back .
That’s the real danger.
Because the next trade isn’t about opportunity, it’s about redemption.
And redemption trades rarely end well.
The skill isn’t in ignoring the regret.
It’s in recognising it for what it is: the echo of unmet expectation.
Ask yourself: what am I actually trying to fix here?
The missed trade… or the feeling of not being enough?
The point here is:
Reflection helps you grow.
Rumination keeps you stuck.
Learn to tell the difference.
That’s where real mastery begins.

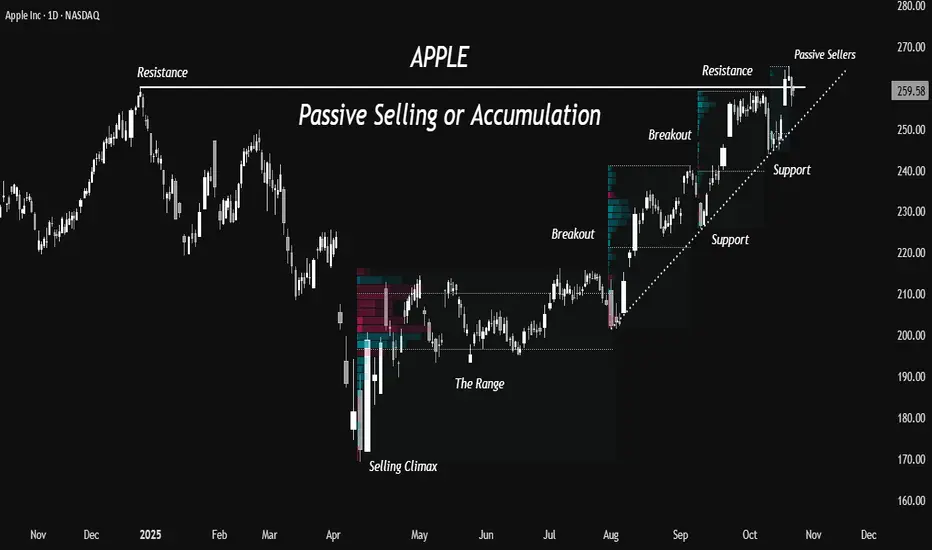
Apple- Passive Selling or More Accumulation?A Bottom and Accumulation
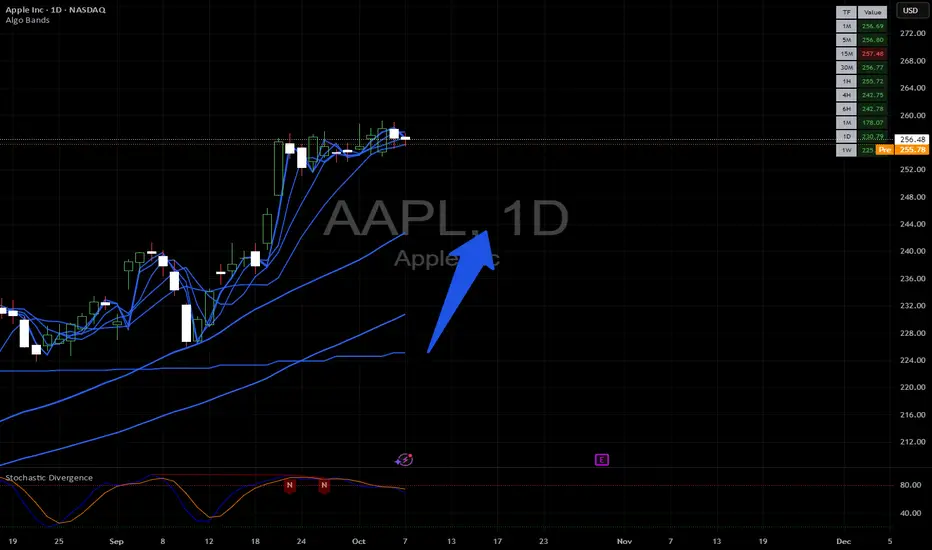
The stock formed a top near 260 in December 2024 and a bottom near 169 in April 2025.
After a sharp bounce of 25% from the lows in just 4 days, the stock consolidated for about 76 sessions in a range from 193 to 214- roughly a 10% range. This created a well-defined base structure, suggesting a period of accumulation.
Breakouts with Volume
The range broke out with strong volume expansion in the beginning of August, confirming a shift in market structure from accumulation to markup. Since then, the stock has maintained a steady uptrend, experiencing only brief pullbacks of about 5 to 6 percent- typical of a healthy trending phase.
Passive Selling at Highs
Currently the stock is trading near its previous highs of 260. It broke out of this resistance and then pulled back below this level. Passive selling is seen around 260 level which means sellers are stepping up, trying to absorb buyers. and the next few sessions will reveal whether this zone turns into a distribution area or simply a retest before continuation.
Trendline Buyers
Pullback buyers are watching the up trendline support which has held the previous shakeouts at two occasions (in Sep and Oct). As long as the stock sustains above this trendline, trend-following participants are likely to continue adding on dips, providing structural support to the uptrend.
Two Scenarios
A sustained move above 260, supported by strong volumes, would reaffirm bullish control and open the door for further upside momentum. Conversely, a break below the trendline could trigger long liquidation from those who bought above 260, leading to broader profit booking and a possible retracement toward 240 or even 225.
What do you think about the stock?
Will it fail the current breakout or sustain?
Do comment below 💬
#For educational purpose only, not a buy/sell recommendation.
Apple: New All-Time High!Apple has recently seen a period of heightened volatility, marked by sharp gains and notable pullbacks. We’re allowing for magenta wave (5) to break above the $260.10 resistance level, which would complete green wave . However, our alternative scenario, which carries a 34% probability, calls for a new corrective low in blue wave alt.(IV) . In this case, Apple would have just finished beige wave alt.b slightly above $260.10 and would next decline in wave alt.c , falling below support at $212.94. Even so, the alternative corrective low would remain above the $168 level.

$AAPL📱 NASDAQ:AAPL Earnings This Week! 🍎
Apple’s earnings are right around the corner, and I’ve been noticing strong demand for the new iPhones even older models are still holding solid in the market.
After the latest iOS update, my older phone started slowing down a bit, which pushed me to upgrade (I use my phone daily for trading and keeping up with news). That experience alone made me realize how Apple continues to drive upgrades and repeat buyers.
With the holiday season coming up, I expect Apple products especially iPhones and accessories to stay in high demand. Accessories themselves are a massive market that shouldn’t be overlooked.
I’m also watching for retail traders to step in this week. Sellers seem willing to raise prices, so it’ll be interesting to see who takes profits and who rides it higher.
Let’s see if NASDAQ:AAPL delivers a strong report and keeps that momentum going. 🚀📊

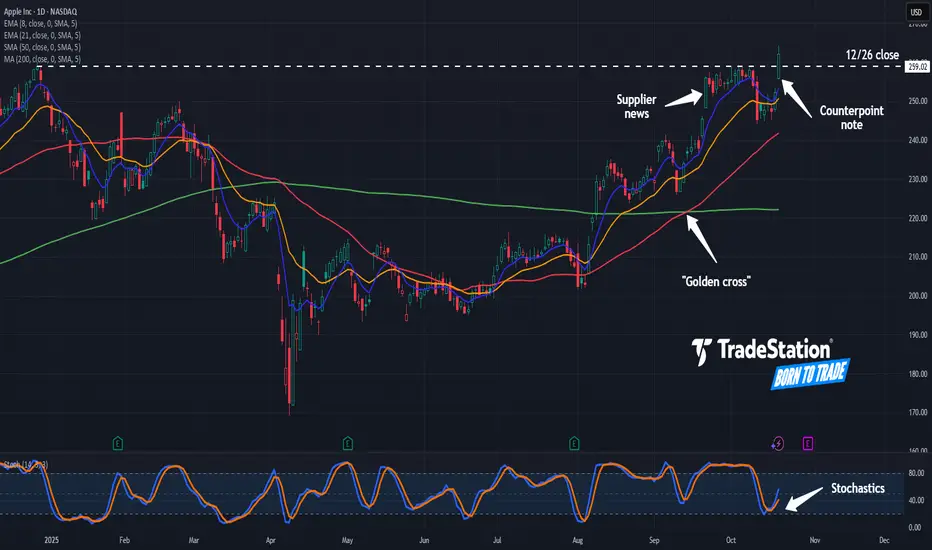
Potential Breakout in Apple Apple has been trapped as the broader Nasdaq rallies, but that might have changed yesterday.
The first pattern on today’s chart is the December 26 closing price of $259.02. AAPL paused near that level in early October but closed above it yesterday. That may be viewed as a potentially bullish breakout.
Second, the tech giant surged on September 22 after The Information reported suppliers were told to increase component production. That was the first clue of strong demand for the iPhone 17. Another report from Counterpoint Research on Monday noted strong early sales of the new handset.
Third, the 50-day simple moving average (SMA) had a bullish “golden cross” above the 200-day SMA last month. That may suggest its longer-term trend is getting more bullish.
Fourth, the 8-day exponential moving average (EMA) is above the 21-day EMA. That may reflect a bullish short-term trend.
Next, stochastics recently turned up from an oversold condition.
Finally, AAPL is a highly active underlier in the options market. (Its average daily volume of 790,000 contracts ranks fifth in the S&P 500, according to TradeStation data.) That could help traders take positions with calls and puts.
TradeStation has, for decades, advanced the trading industry, providing access to stocks, options and futures. If you're born to trade, we could be for you. See our Overview for more.
Past performance, whether actual or indicated by historical tests of strategies, is no guarantee of future performance or success. There is a possibility that you may sustain a loss equal to or greater than your entire investment regardless of which asset class you trade (equities, options or futures); therefore, you should not invest or risk money that you cannot afford to lose. Online trading is not suitable for all investors. View the document titled Characteristics and Risks of Standardized Options at www.TradeStation.com . Before trading any asset class, customers must read the relevant risk disclosure statements on www.TradeStation.com . System access and trade placement and execution may be delayed or fail due to market volatility and volume, quote delays, system and software errors, Internet traffic, outages and other factors.
Securities and futures trading is offered to self-directed customers by TradeStation Securities, Inc., a broker-dealer registered with the Securities and Exchange Commission and a futures commission merchant licensed with the Commodity Futures Trading Commission). TradeStation Securities is a member of the Financial Industry Regulatory Authority, the National Futures Association, and a number of exchanges.
Options trading is not suitable for all investors. Your TradeStation Securities’ account application to trade options will be considered and approved or disapproved based on all relevant factors, including your trading experience. See www.TradeStation.com . Visit www.TradeStation.com for full details on the costs and fees associated with options.
Margin trading involves risks, and it is important that you fully understand those risks before trading on margin. The Margin Disclosure Statement outlines many of those risks, including that you can lose more funds than you deposit in your margin account; your brokerage firm can force the sale of securities in your account; your brokerage firm can sell your securities without contacting you; and you are not entitled to an extension of time on a margin call. Review the Margin Disclosure Statement at www.TradeStation.com .
TradeStation Securities, Inc. and TradeStation Technologies, Inc. are each wholly owned subsidiaries of TradeStation Group, Inc., both operating, and providing products and services, under the TradeStation brand and trademark. When applying for, or purchasing, accounts, subscriptions, products and services, it is important that you know which company you will be dealing with. Visit www.TradeStation.com for further important information explaining what this means.
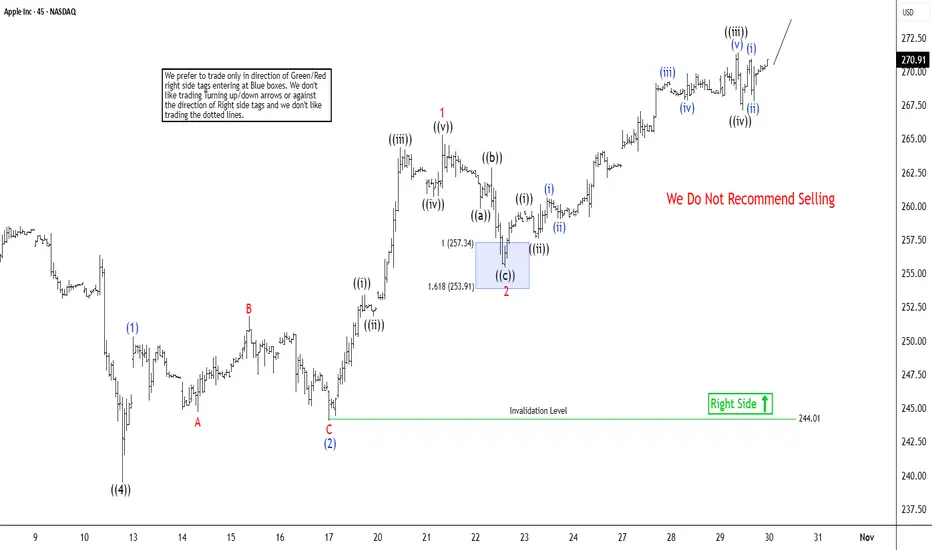
AAPL in Wave ((5)) to New All-Time High as Nested PatternApple (AAPL) has surged to a new all-time high, extending an impulse wave that began from the April 2025 low. Wave ((4)) of this larger impulse concluded at $239.49, as clearly illustrated on the 45-minute chart. Now, wave ((5)) advances higher in the form of a nested impulse structure. Rising from the wave ((4)) base, wave (1) completed at $250.65 before wave (2) pulled back to $244.01. From there, the stock nested upward again, with wave 1 ending at $265.29 and wave 2 correcting to $255.43. Apple then extended further in wave 3, which itself unfolds as an impulse of lesser degree.
Within wave 3, wave ((i)) topped at $259.67, followed by a dip in wave ((ii)) to $257.55. Wave ((iii)) pushed higher to $271.41, and wave ((iv)) retraced to $267.11. Wave ((v)) of 3 should finish soon, leading to a pullback in wave 4 before the uptrend resumes with renewed strength.In the near term, the bullish outlook remains intact as long as the pivot low at $244.01 holds. Any dips are likely to find support in 3, 7, or 11 swing sequences, setting the stage for continued upside. This Elliott Wave progression underscores persistent momentum, with nested impulses reinforcing the primary trend and positioning Apple for additional gains ahead.
Can AAPL Earnings Fuel Its Rally?Apple (AAPL) extended gains to a record high, briefly pushing its market capitalization past the USD 4 trillion mark as strong iPhone 17 demand and a broad tech rally buoyed sentiment. Early data from Counterpoint Research showed iPhone 17 sales outpacing the previous generation by 14% in the first 10 days across the US and China, underscoring resilient consumer demand despite higher price points. However, signs of moderating lead times and delayed AI feature rollouts may temper momentum ahead of Thursday’s earnings, where investors will focus on iPhone sustainability and progress in Apple’s AI strategy.
From a technical perspective, AAPL is approaching the resistance at 127.2% Fibonacci Extension at 275. A break above this level may prompt a further rise toward the 161.8% Fibonacci Extension at 290. Conversely, a retracement may prompt a retest of the support at 245.
By Li Xing Gan, Financial Markets Strategist Consultant to Exness

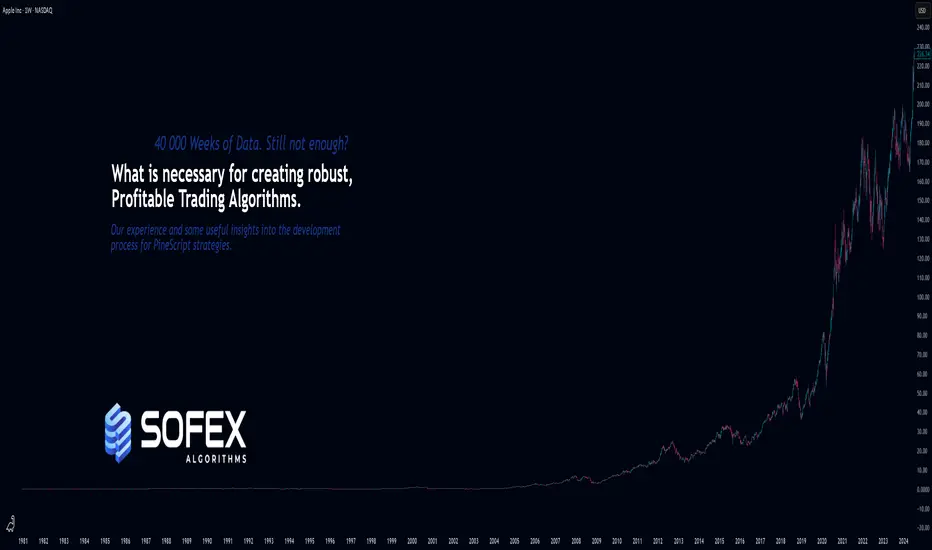
A few important steps for creating robust and winning StrategiesAs the title says, I want to share knowledge & important insights into the best practices for creating robust, trustworthy and profitable trading Strategies here on TradingView.
These bits of information that my team I have gathered throughout the years and have managed to learn through mostly trial and error. Costly errors too .
Many of these points more professional traders know, however, there are some that are quite innovative for all levels of experience in my opinion. Please, feel free to correct me or add more in the comments.
There are a few strategic and tactical changes to our process that made a noticeable difference in the quality of Strategies and Indicators immediately.
Firstly and most importantly, we have all heard about it, but it is having the most data available. A good algorithm, when being built NEEDS to have as many market situations in its training data as possible. Choppy markets, uptrends, downtrends, fakeouts, manipulations - all of these are necessary for the strategy to learn the possible market conditions as much as possible and be prepared for trading on unknown data.
Many may have heard the phrase "History doesn't repeat itself but rhymes well" - you need to have the whole dictionary of price movements to be able to spot when it rhymes and act accordingly.
The TradingView Ultimate plan offers the most data in terms of historical candles and is best suited for creating robust strategies.
___
Secondly, of course, robustness tests. Your algorithm can perform amazingly on training data, but start losing immediately in real time, even if you have trained it on decades of data.
These include Monte-carlo simulations to see best and worst scenarios during the training period. Tests also include the fundamentally important out-of-sample checks . For those who aren’t familiar - this means that you should separate data into training sets and testing sets. You should train your algorithm on some data, then perform a test on unknown to the optimization process data. It's common practice to separate data as 20% training / 20% unknown / 20% training etc. to build a data set that will show how your algorithm performs on unknown to it market movements. Out of sample tests are crucial and you can never trust a strategy that has not been through them.
Walk-forward simulations are similar - you train your algorithm on X amount of data and simulate real-time price feeds and monitor how it performs. You can use the Replay function of TradingView to do walk-forward tests!
When you are doing robustness tests, we have found that a stable strategy performs around 90% similarly in terms of win rate and Sortino ratio compared to training data. The higher the correlation between training performance and out of sample performance, the more risk you can allocate to this algorithm.
___
Now lets move onto some more niche details. Markets don’t behave the same when they are trending downward and when they are trending upwards. We have found that separating parameters for optimization into two - for long and for short - independent of each other, has greatly improved performance and also stability.
Logically it is obvious when you look at market movements. In our case, with cryptocurrencies, there is a clear difference between the duration and intensity of “dumps” and “pumps”. This is normal, since the psychology of traders is different during bearish and bullish periods. Yes, introducing double the amount of parameters into an algorithm, once for long, once for short, can carry the risk of overfitting since the better the optimizer (manual or not), the better the values will be adjusted to fit training data. But if you apply the robustness tests mentioned above, you will find that performance is greatly increased by simply splitting trade logic between long and short. Same goes for indicators.
Some indicators are great for uptrends but not for downtrends. Why have conditions for short positions that include indicators that are great for longs but suck at shorting, when you can use ones that perform better in the given context?
___
Moving on - while overfitting is the main worry when making an algorithm, underoptimization as a result of fear of overfitting is a big threat too . You need to find the right balance by using robustness tests. In the beginning, we had limited access to software to test our strategies out of sample and we found out that we were underoptimizing because we were scared of overfitting, while in reality we were just holding back the performance out of fear. Whats worse is we attributed the losses in live trading to what we thought was overfitting, while in reality we were handicapping the algorithm out of fear.
___
Finally, and this relates to trading in general too, we put in place very strict rules and guidelines on what indicators to use in combination with others and what their parameter range is. We went right to theory and capped the values for each indicator to be within the predefined limits.
A simple example is MACD . Your optimizer might make a condition that includes MACD with a fast length of 200, slow length of 160 and signal length of 100. This may look amazing on backtesting and may work for a bit on live testing, but these values are FUNDAMENTALLY wrong (Investopedia, MACD). You must know what each indicator does and how it calculates its values. Having a fast length bigger than the slow one is completely backwards, but the results may show otherwise.
When you optimize any strategy, manually or with the help of a software, be mindful of the theory. Mathematical formulas don’t care about the indicator’s logic, only about the best combination of numbers to reach the goal you are optimizing for - be it % Return, Profit Factor or other.
Parabolic SAR is another one - you can optimize values like 0.267; 0.001; 0.7899 or the sort and have great performance on backtesting. This, however, is completely wrong when you look into the indicator and it’s default values (Investopedia, Parabolic SAR).
To prevent overfitting and ensure a stable profitability over time, make sure that all parameters are within their theoretical limits and constraints, ideally very close to their default values.
Thank you for reading this long essay and I hope that at least some of our experience will help you in the future. We have suffered greatly due to things like not following trading theory and leaving it all up to pure mathematical optimization, which is ignorant of the principles of the indicators. The separation between Long / Short logic was also an amazing instant improvement.
View the linked idea where we explain the psychology of risk management and suggest a few great ways to calculate and manage your risk when trading - just as important as the strategy itself!
What do you think? Do you use any of these methods; Or better ones?
Let us know in the comments.
Apple's Upcoming Earnings Could Propel Stock Beyond $275 Current Price: $262.82
Direction: LONG
Targets:
- T1 = $275.00
- T2 = $285.00
Stop Levels:
- S1 = $258.00
- S2 = $252.00
**Wisdom of Professional Traders:**
This analysis synthesizes insights from thousands of professional traders and market experts, offering consensus-driven analysis to identify high-probability trade setups on Apple stock. The collective intelligence regarding Apple suggests strong bullish sentiment, driven by expectations of robust fiscal year 2025 guidance, increased iPhone sales amid a successful product launch cycle, and reinvigorated growth from services revenue. Traders and analysts observed consistent institutional accumulation in recent weeks, pointing toward sustained investor confidence.
**Key Insights:**
Apple recently launched its highly anticipated iPhone 16 lineup, which has been met with strong consumer demand, particularly in international markets. Coupled with its growing subscription-based revenue streams in services like iCloud and Apple TV+, Apple continues to demonstrate its ability to diversify its revenue sources beyond hardware. Notably, advancements in artificial intelligence integration within iOS further position Apple as both a tech leader and key player in the AI revolution.
Financially, Apple is set to announce its fiscal Q4 2025 earnings on November 1, 2025, and many traders expect the company to beat analysts' estimates once again. Apple's significant investments in hardware innovations and supply chain optimization point to solid gross margin improvement. The market is also keeping a close eye on any updates regarding Apple's automotive and healthcare ambitions, which have the potential to unlock new revenue streams, resulting in a further valuation boost.
**Recent Performance:**
Apple has been rallying steadily over October following the broader market rebound that saw gains across major indices like the S&P 500. The stock recently broke through key resistance at $260, spurred on by better-than-expected demand for their latest products and an upward revision in analyst price targets. In the past month, Apple shares appreciated by nearly 8.5%, which has led traders to take optimistic positions ahead of its upcoming earnings report.
**Expert Analysis:**
Top analysts from Morgan Stanley and Goldman Sachs have reiterated their bullish outlook on Apple with a price target range of $280-$300 based on sustained growth across segments like wearable devices, enterprise solutions, and Apple Services. Technically, Apple’s breakout above $260 is supported by high volume, indicating strong momentum. RSI metrics remain neutral at 58, implying room for further upward movement without being overbought.
Experts also underscore management's capital allocation strategy, highlighting massive share buyback programs that support upward price pressure. Furthermore, Apple’s adherence to disciplined innovation while managing macroeconomic challenges has reinforced major institutional positions.
**News Impact:**
Apple’s iPhone 16 launch and increased activity around its augmented reality (AR) product line have supported positive market sentiment. Reports of partnerships with major healthcare providers on its Health platform could provide a growth catalyst, creating a narrative about Apple’s ecosystem expansion into untapped industries. Headlines anticipating a major beat in fiscal Q4 2025 earnings will likely drive traders to aggressively accumulate in the days leading up to earnings, further supporting near-term price action.
**Trading Recommendation:**
Based on the amalgamated analysis, traders should consider initiating a LONG position on Apple at current levels ($262.82) ahead of its fiscal Q4 2025 earnings. A breakout above $275 would signal the next leg higher with an upside target of $285. However, multiple stop levels at $258 and $252 serve as protection against any potential volatility. Given strong growth catalysts, a highly resilient business model, and favorable technicals, Apple presents a compelling opportunity for long-term investors and short-to-medium-term traders alike.
Do you want to save hours every week? Register for the free weekly update in your language!

Apple Smashes Expectations with iPhone 17Apple Smashes Expectations with iPhone 17: Sales Up 14% in Just 10 Days
By Ion Jauregui – Analyst at ActivTrades
Apple (NASDAQ: AAPL) has made another bold move with the launch of its iPhone 17. According to Counterpoint, the latest model sold 14% more than the iPhone 16 in its first 10 days in key markets such as China and the United States. Growth is even more remarkable in China, where the base model almost doubled its sales compared to the iPhone 16. Overall, sales across both markets surged 31%, consolidating Apple as the undisputed leader in the sector.
The secret behind this success seems simple but effective: a better chip, enhanced display, upgraded front camera, and larger storage capacity, all while maintaining the same price as last year. Apple’s “more for the same” strategy has, at least so far, proven highly profitable.
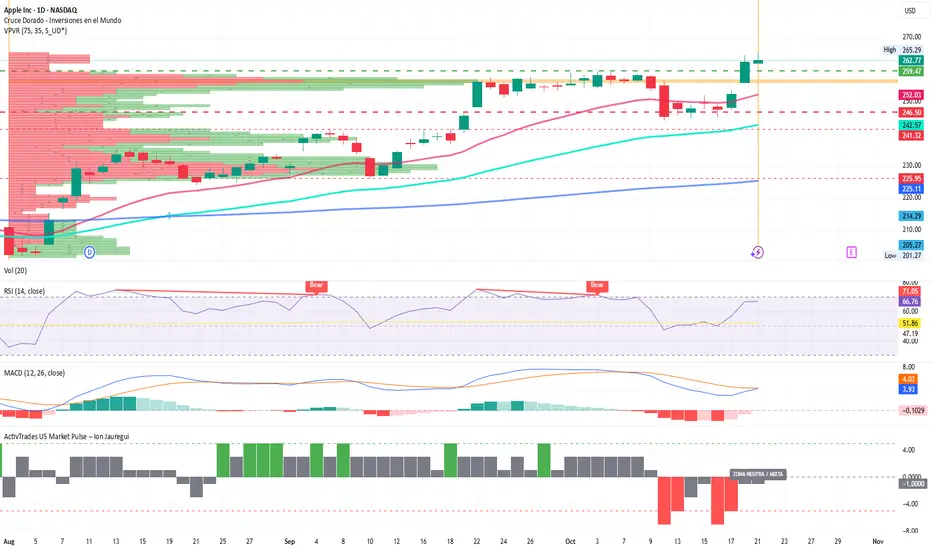
AAPL Technical Analysis
From a technical perspective, Apple shares show a solid bullish momentum following the iPhone 17 announcement:
The price has broken key resistance at $259.47, consolidating above the 50-day moving average for two consecutive sessions.
Relative Strength Index (RSI) indicators are in slightly overbought territory but show no immediate correction signals.
MACD indicates the early stages of a bullish crossover.
Trading volume has increased significantly in recent days, confirming strong institutional interest.
In this context, current support is around $246.50, with the next support above $241.28 near the 100-day moving average, while the previous key support is at $225.95, coinciding with the 200-day moving average. The ActivTrades US Market Pulse indicates a neutral risk balance, suggesting that these moves are largely driven by speculation around Apple.
For Apple, these figures represent more than just a commercial victory. The company needed a sales boost to justify its position in an increasingly competitive market, and early indicators show it is succeeding.
The iPhone 17 not only strengthens investor confidence in Apple but also sets a new benchmark for the tech industry at a time when innovation and demand for premium devices are higher than ever.
*******************************************************************************************
La información facilitada no constituye un análisis de inversiones. El material no se ha elaborado de conformidad con los requisitos legales destinados a promover la independencia de los informes de inversiones y, como tal, debe considerarse una comunicación comercial.
Toda la información ha sido preparada por ActivTrades ("AT"). La información no contiene un registro de los precios de AT, o una oferta o solicitud de una transacción en cualquier instrumento financiero. Ninguna representación o garantía se da en cuanto a la exactitud o integridad de esta información.
Cualquier material proporcionado no tiene en cuenta el objetivo específico de inversión y la situación financiera de cualquier persona que pueda recibirlo. La rentabilidad pasada y las estimaciones o pronósticos no son sinónimo ni un indicador fiable de la rentabilidad futura. AT presta un servicio exclusivamente de ejecución. En consecuencia, toda persona que actúe sobre la base de la información facilitada lo hace por su cuenta y riesgo. Los tipos de interés pueden cambiar. El riesgo político es impredecible. Las acciones de los bancos centrales pueden variar. Las herramientas de las plataformas no garantizan el éxito.
APPLE What Next? BUY!
My dear followers,
I analysed this chart on APPLE and concluded the following:
The market is trading on 245.33 pivot level.
Bias - Bullish
Technical Indicators: Both Super Trend & Pivot HL indicate a highly probable Bullish continuation.
Target - 251.49
About Used Indicators:
A super-trend indicator is plotted on either above or below the closing price to signal a buy or sell. The indicator changes color, based on whether or not you should be buying. If the super-trend indicator moves below the closing price, the indicator turns green, and it signals an entry point or points to buy.
Disclosure: I am part of Trade Nation's Influencer program and receive a monthly fee for using their TradingView charts in my analysis.
———————————
WISH YOU ALL LUCK

Relative Strength Tipped Off AAPL’s Rally Before Price DidAbove is a 5-minute chart of AAPL, and in the lower pane, I’ve plotted the ratio line of AAPL versus SPY. What really caught my attention this morning was what happened around 10:00 ET. While AAPL itself had only opened slightly higher, the ratio line had already broken out to a new high. That was the early clue, the relative strength line was quietly signaling that AAPL was outperforming the market before the actual price move confirmed it.
TheRelativeStrengthTrader

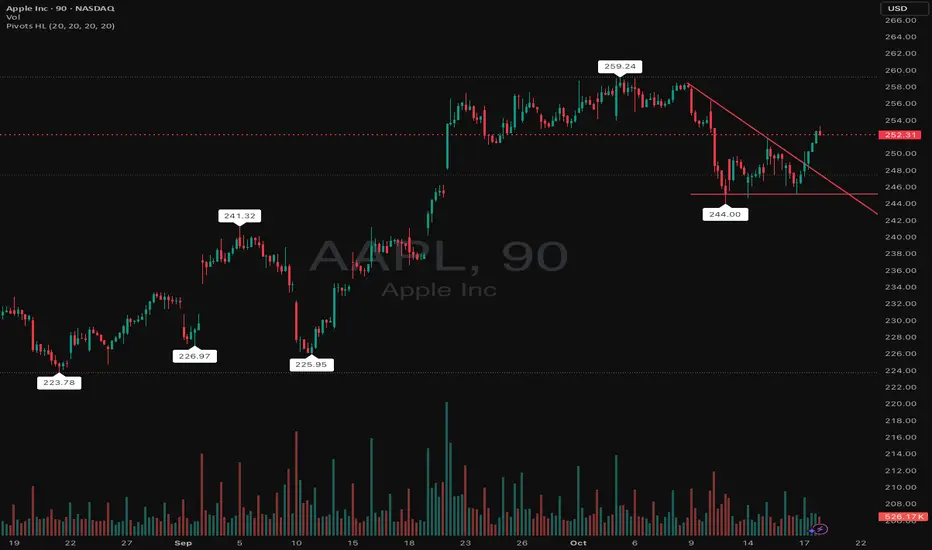
AAPL - A true breakout toward ER or BULL TRAPHappy Sunday.
On High Watch of this week is AAPL.
It has kinda formed a triple bottom here. The bounce from $244 forms a higher low, showing buyers stepping in. Breaking above the trendline resistance shifts the short-term structure to BULLISH. Next target if momentum continues is $256-$259 zone, which was the previous resistance cluster. However, if the price falls below $250 then this breakout is a bull trap. Below $244 then Bearish continue.
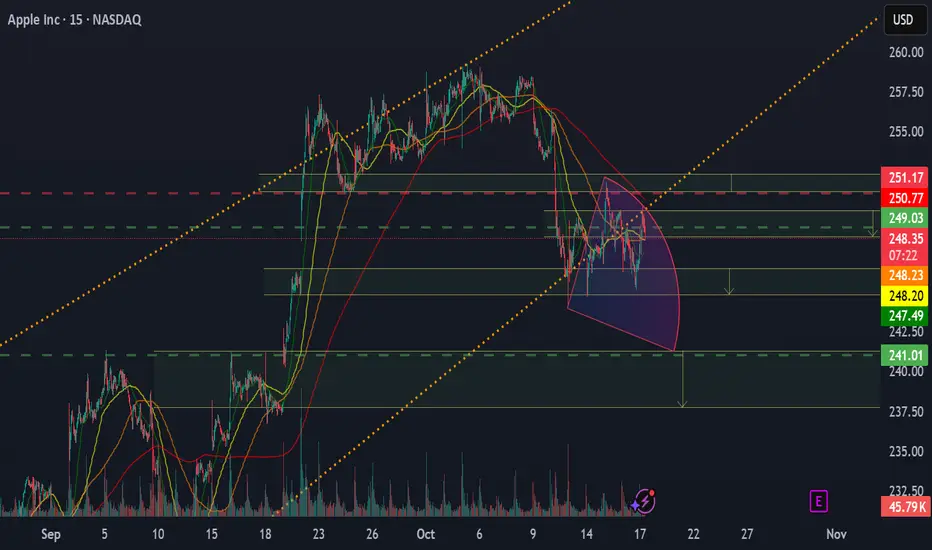
APPLE/AAPL Stock: Movement Scenarios and Key Reaction PointsThese are all the key stock levels for Apple that are fully and precisely displayed in the image – including supports, resistances, and potential reaction points for traders NASDAQ:AAPL

AAPL watch $256-257: Double Golden fib zone that caused last TOPAPPL has been confidently climbing the wall of worries.
Now testing the Double Golden zone at $256.75-257.41
Look for a Break-n-Retest (likely) or a Dip-to-Fib for entry.
.
Previous Analysis that caught the EXACT TOP:
Hit BOOST and FOLLOW for more such PRECISE and TIMELY charts.
========================================================
.

Apple (AAPL) Shares Hit an All-Time HighApple (AAPL) Shares Hit an All-Time High
On 26 September, we noted that Apple (AAPL) shares were nearing a record peak. Less than a month later, that forecast has materialised: according to the chart, AAPL surged more than 4% yesterday, surpassing its December 2024 high. This marks:
→ a new all-time record;
→ a return to second place by market capitalisation (Apple has overtaken Microsoft, while Nvidia remains in first position).
Why Are Apple Shares Rising?
→ Strong sales figures. Counterpoint Research reported that sales of the new iPhone 17 series in the US and China during the first ten days were 14% higher than those of the iPhone 16 last year. Analysts note that the base model offers significant improvements at the same price, encouraging consumers to upgrade.
→ Analyst forecasts. Loop Capital not only raised its rating to Buy (with a target price of $315) but also declared the start of a “long-awaited upgrade cycle”. In their view, this is not a short-term surge but the beginning of sustained growth in shipments expected to continue until 2027.
Optimism is also fuelled by anticipation of Apple’s upcoming earnings report and the festive shopping season, which could further accelerate iPhone 17 sales.
Technical Analysis of Apple (AAPL) Shares
Price movements in 2025 have formed a broad upward channel (shown in blue). Within this structure:
→ the channel’s median line acted as support in mid-October;
→ yesterday’s rally lifted the price into the upper quarter of the channel.
From a demand perspective:
→ Trading opened with a bullish gap (see arrow), and the price jumped rapidly in the first minutes — evidence of strong buying interest.
→ The psychological level of $250 is losing its role as resistance and may become future support.
→ The price remains within a steep rising channel (marked in orange).
From a supply perspective:
→ The RSI indicator shows overbought conditions;
→ Some investors may take profits at the new record high.
Taking these factors into account, once the current bullish momentum cools, AAPL could see a short-term pullback — potentially towards the area of the bullish gap or one of the orange trendlines (solid or dotted).
This article represents the opinion of the Companies operating under the FXOpen brand only. It is not to be construed as an offer, solicitation, or recommendation with respect to products and services provided by the Companies operating under the FXOpen brand, nor is it to be considered financial advice.

Apple short ideaApple looks overextended after the recent rally, showing signs of exhaustion near resistance. Price momentum is slowing, and volume confirms reduced buying pressure. I expect a short term correction as the market takes profits and sentiment cools down.
I am opening a short position with a target at 241. After that, I’ll review the situation and reassess the direction, but it’s very likely that we’ll correct deeper.
A break below the recent local lows could accelerate the move toward that level.
⚠️ Not financial advice.
$AAPL Buy levelUnlike NASDAQ:META , NASDAQ:AAPL is strong. If, however, NASDAQ:AAPL starts to come down, $225 offer a good level to go long off. $225 is also a level to sell puts against.
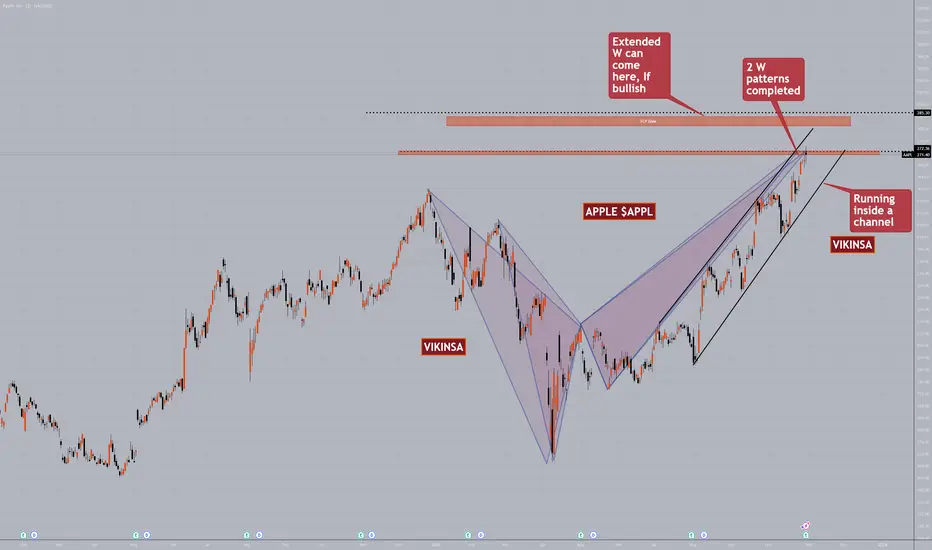
Is APPLE $APPL ready and primed for a correction?Apple BSE:APPL had a great run so far in the past few weeks. It has also been running inside a channel which has pushing the price upwards. However, now it has just completed an extended W pattern. In fact 2 of them got completed exactly at the same level.
The current price level is something that needs to eb watched very closely. When W patterns complete, markets tend to have a correction. Market is still bullish and is still inside the channel so even if the correction comes, we will have to be careful with the shorts.
If the market stay bullish from this point above at least on daily/weekly basis then we have an upper FCP zone where it can reach possibly take a correction from there.
In all cases, we must remember to wait for confirmations and obviously manage the risk.
Natural Gas Rallies on Weak InventoriesNatural Gas surged up 6% today.
Inventories came out 74B vs 71B estimate.
Despite the weaker report the commodity still surged.
This is showing a great relative strength trade.
A bull flag could be primed for a breakout on the daily chart.
Nat gas equities are beginning to look cheap again.

Long trade 📘 Trade Journal Entry
Symbol: AAPL (Apple Inc.)
Direction: Buy-Side Trade
Date: Fri 10 Oct 25
Time: 11:00 am
Session: LND to NY Session AM
Timeframe: 1 Hour
🔹 Trade Details
Metric Value
Entry 248.43
Profit Level (TP) 278.00 (+11.88%)
Stop Level (SL) 243.56 (–1.98%)
Risk–Reward (RR) 6.0 R
🔸 Technical Context
Structure:
Price broke out from an extended accumulation zone with confirmation from a BOS (Break of Structure) and Demand Zone Retest on the 15-minute and 1-hour timeframes.
The move aligns with a strong fair value gap fill and retest of the order block around 244–245, which acted as a springboard for the next impulsive leg.
Fibonacci Expansion:
1.618 projection → 261.30 (short-term target)
2.618 projection → 267.60 (intermediate)
3.618 projection → 274.00 (high-probability swing)
4.236 projection → 277.92 (extended TP)
Volume Confirmation:
Volume spikes visible at the breakout candle reinforce institutional participation, marking a clear transition from consolidation to markup phase.
🔹 Narrative & Bias
Apple continues to exhibit buyside momentum after consolidating above the September accumulation range. The breaker block re-entry at 245 aligned with fib 0.618 retracement and strong volume demand, confirming bullish continuation.
Current structure mirrors prior accumulation-distribution cycles seen before major upside runs.
Macro Context:
Tech sector rotation in line with AI & earnings optimism.
Broader equity market stability encouraging risk-on positioning in mega-cap tech names.
Projection:
Price expected to extend toward 267–278 levels before the next major consolidation phase, with potential for partial take-profits near the 1.618 extension.

AAPL Apple Options Ahead of EarningsIf you haven`t bought the dip on AAPL:
Now analyzing the options chain and the chart patterns of AAPL Apple prior to the earnings report this week,
I would consider purchasing the 255usd strike price Calls with
an expiration date of 2025-11-21,
for a premium of approximately $18.65.
If these options prove to be profitable prior to the earnings release, I would sell at least half of them.
