AMZN on WatchLooking for a pull back to around $209.50 or a break out above $215.
Why:
20EMA and $209 resistance are lining up
On an uptrend
Possible Cup and Handle forming
Trade ideas

AMZN — Accumulation Zone or Just a Healthy Pullback?📦Amazon (AMZN) is offering an interesting opportunity after a healthy correction from its 2025 highs. With continued AWS expansion and aggressive investment in AI infrastructure, the fundamentals remain solid — but short-term volatility opens the door for strategic entries.
🎯 Entry Points
🔹 $194 – First key support, ideal for early buyers
🔹 $187 – Strong technical congestion zone
🔹 $169 – Deep value zone with higher risk/reward potential
💰 Profit Targets
✅ TP1: $210 – First resistance and psychological level
✅ TP2: $227 – Last swing high area
✅ TP3: $241+ – Full recovery path if momentum holds
🧠 Strategy Insight
This setup suits a swing trade horizon (30–60 days). Scaling into the position and adjusting stops under $160 offers a risk-managed approach. The upcoming earnings on July 31, 2025 could be the trigger for a major move — watch AWS growth numbers and forward guidance closely.
⚠️ Disclaimer: This analysis is for educational purposes only. It is not financial advice. Always do your own research and manage risk accordingly.
AMZN Struggles at Trend-Barrier and ResistancePrice is still in upward mode.
Why am I bearish?
1. Rejection in the Resistance Zone
2. Second Hagopian
3. Close below the Red Forks 1/4 Line
PTG1 is the Center-Line.
Potential further PTG's below at the 1/4 Line and then of course the L-MLH.
Playing it with Options which give me much more leeway. For a hard Stop I would put it right behind the last high above the TB.

AMZN: Watch for a Break Above 218.00If NASDAQ:AMZN manages to push above 217.85 , there's a strong chance we’ll see a move toward 219.96 . However, caution is advised around the 218.00 level – both premarket and postmarket sessions showed hesitation and failed to hold above that resistance.
A more conservative approach would be to wait for a clean break above 218.00 before entering.
🔍 Context:
We’re currently in a solid uptrend. On the daily chart, we’ve seen a rejection of the downside, marked by an inside bullish candle with a notable wick – suggesting upward pressure that the market may try to release. Given recent premarket activity, the 218.00 area remains a key battleground for bulls and bears alike.

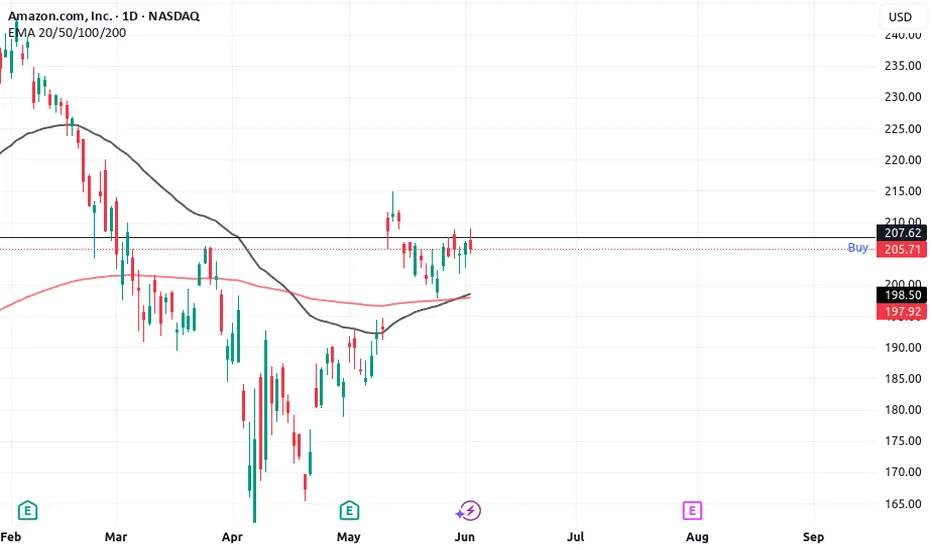
AMZN – Breaking Out From Handle in Cup & Handle BaseAmazon ( NASDAQ:AMZN ) is breaking out from the handle of a well-formed cup and handle base, offering a defined, low-risk entry with a strong technical structure.
📈 Entry Zone: 214.84 – 225.25
🛑 Stop Range: 203.88 – 197.23 (5–8% below entry, based on risk preference)
🎯 Target: 242.50
📌 Will consider adding above all-time highs if momentum builds
Price is riding above all major moving averages (10, 21, 50, 200), with bullish alignment across the board. The handle showed tight price action before this breakout, a constructive sign for continuation.
Relative strength is not leading, but it's starting to slope upward — signaling early participation. In a market where growth stocks are volatile, names like AMZN provide a more stable trend with potential for measured upside.
Fundamentally, Amazon continues to deliver across AWS, logistics, and advertising — with consistent earnings growth backing the technical picture.

UNISWAP - Long Term Buy Opportunity 🚨MartyBoots here , I have been trading for 17 years and sharing my thoughts on UNI here.🚨
UNI vs ETH | Why Uniswap Deserves a New All-Time High
In this video, we dive deep into the fundamentals of Uniswap (UNI) and explore its close relationship with Ethereum (ETH)—the blockchain it’s built on. While ETH has regained massive attention with its expanding ecosystem and institutional adoption, UNI is still massively undervalued in comparison, despite powering one of the largest DeFi protocols in the world.
⸻
Fundamentals Breakdown:
• Uniswap is the backbone of decentralized trading, facilitating billions in volume without intermediaries.
• Fee switch mechanics and upcoming v4 upgrades have the potential to drive real yield to UNI holders.
• Unlike ETH, which serves as a Layer 1 gas token, UNI represents governance and future revenue potential over a growing protocol.
⸻
Why UNI Has Upside:
• UNI still trades far below its all-time highs—even as Ethereum ecosystem activity rebounds.
• ETH has already made major recovery moves, but UNI hasn’t caught up yet—creating a bullish divergence.
• With the rise of on-chain liquidity, tokenized real-world assets, and institutional DeFi, Uniswap is positioned to be a key infrastructure layer.
⸻
My Thesis:
• ETH = Base Layer | UNI = DeFi Rail
• As ETH grows, Uniswap scales alongside it—capturing more swap volume, TVL, and governance power.
• If Uniswap activates protocol revenue, UNI transitions from a governance token to a yield-bearing asset, giving it real valuation metrics and long-term investor interest.
⸻
Watch to see my full breakdown, including:
• UNI vs ETH price chart comparison
• On-chain stats, dominance shifts, and upcoming catalysts
• Why I believe UNI is set for a breakout back toward new all-time highs
⸻
Like, comment, and follow for more deep-dive crypto breakdowns and technical setups.
#Uniswap #UNI #Ethereum #ETH #CryptoAnalysis #DeFi #TradingView #AltcoinSeason #PineScript #FundamentalAnalysis

AMZN cup and handle completed - LONGAmazon cup and handle completed - Long on open above above 215, Stop loss at 202, Target 240

AMZNThis is a company I believe can become one of the most valuable companies by market cap I think they have a toe in every sector at this point. AI is a massive one and robots also them just possibly replacing all employees with AI and robots. That could make them extremely efficient and profitable short term target of 250 with longer term targets of 300. Not a professional and this is not financial advice just what I am speculating.

AMAZONAMZN is getting ready for another push towards 230 level.
Disclosure: We are part of Trade Nation's Influencer program and receive a monthly fee for using their TradingView charts in our analysis.

AMAZON Resistance Ahead! Sell!
Hello,Traders!
AMAZON keeps gaining
Bullish momentum so we
Are bullish biased mid-term
However it will soon hit a
Horizontal resistance of 219.00$
From where we will be expecting
A local bearish correction
Sell!
Comment and subscribe to help us grow!
Check out other forecasts below too!
Disclosure: I am part of Trade Nation's Influencer program and receive a monthly fee for using their TradingView charts in my analysis.

The 3 Step Rocket Booster StrategyOn this trade we are looking at the NASDAQ:AMZN
trade.Now the special thing
about this trade is that instead of focusing on
the daily chart we are focusing on the weekly chart.
You may be thinking
“Why are we focusing on the weekly chart?”
Well this is because you have to be ahead of the crowd nd see
the coming trend.
If you want to do your own trading strategy
thats okay but if you want
to learn more about the Rokcet booster strategy
Then you need to follow these 3 steps
• The price has to be above the 50 EMA
• The price has to be above the 200 EMA
• The price should gap up in an uptrend
This is the rocket booster strategy
In order to learn more
Rocket boost this content
Disclaimer:Trading is risky you will lose money
so please use a simulation trading account
before you trade with real money.Also learn
Risk management and profit taking strategies.
AMZN BUYBUY AMZN at 182.00 to 173.00, riding it back up to 240.00 to 255.00 as Profit Targets, Stop Loss is at 161.00!
If anyone likes mumbo jumbo long useless analysis,
than this is NOT for you.
Also, if you are afraid of risk, failure, and want only a 100% sure thing, than...
run as fast as you can from here and from the markets,
because it is definitely NOT for you.
WARNING: This is just my opinion of the market and its only for journaling purpose. This information and any publication here are NOT meant to be, and do NOT constitute, financial, investment, trading, or other types of advice or recommendations. Trading any market instrument is a risky business, so do your own due diligence, and trade at your own risk. You can loose all of your money and much more.

Amazon UpdatePrice has re-entered the target box. I mentioned last week that price could still try to target the 1.618 @ $220.01. Judging by the ES, I think it is highly likely that is what is going on. We're still currently trading on hidden bearish divergence which doesn't bode well for a sustained move higher. I think it more likely that we make another slight high towards the 1.618 on neg div setting up the larger move lower for minor C.
The key support price we need to breach that will point us lower is $196. If we can get below that, the momentum will change to the downside. First, we will likely make OMH though. We manage to breach $196 though, and sub $140 comes into view. This will take time. Don't think that it will happen tomorrow or even next week. Minor C will take weeks if not months to complete.

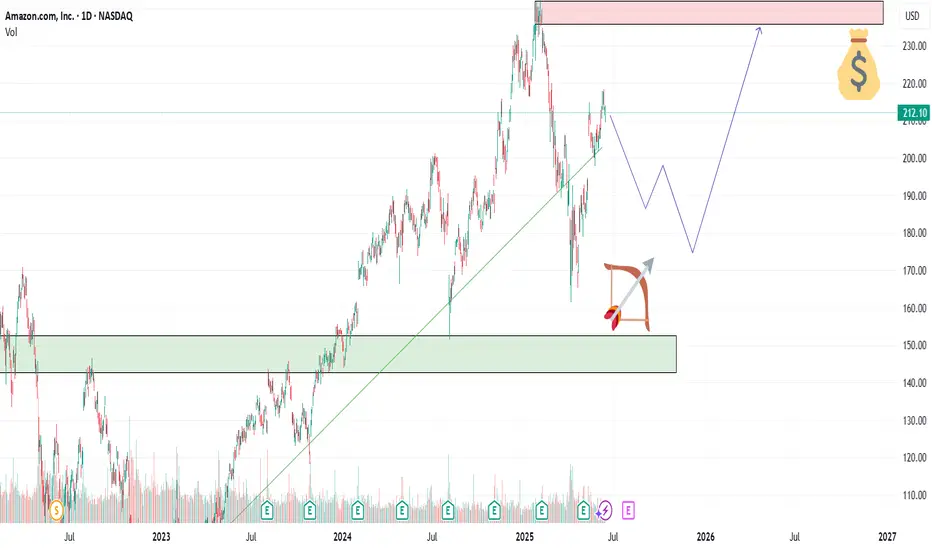
AMAZON eyes $255 on the 3rd such buy signal in 18 months!AMAZON Inc. (AMZN) has been trading within a 18-month Bullish Megaphone pattern whose latest bottom was on the April 07 2025 Low. Since then, the pattern has started its new Bullish Leg, which has been confirmed by the break-out above its 1D MA50 (blue trend-line) and the 1W RSI's above its MA.
The previous two Bullish Legs hit at least their 3.5 Fibonacci extension levels and the 2nd Bullish was +30% more than the 1st. If the stock achieves a +60% gain from its April bottom again, it will be almost exactly on its 3.5 Fib ext.
As a result, we believe that a $255 Target (on the 3.5 Fib), is more than realistic to be achieved by September.
-------------------------------------------------------------------------------
** Please LIKE 👍, FOLLOW ✅, SHARE 🙌 and COMMENT ✍ if you enjoy this idea! Also share your ideas and charts in the comments section below! This is best way to keep it relevant, support us, keep the content here free and allow the idea to reach as many people as possible. **
-------------------------------------------------------------------------------
💸💸💸💸💸💸
👇 👇 👇 👇 👇 👇

AMZN | Long | Strong Earnings Momentum | (May 28, 2025)AMZN | Long | Strong Earnings Momentum + Structural Breakout | (May 28, 2025)
1️⃣ Quick Recap: We're in a long trade on Amazon (AMZN), and the setup is unfolding well. TP1 and TP2 have already been hit after flipping key resistance into support. The trend is intact, and we're now aiming for higher levels as long as the structure holds. 💪📊
2️⃣ Trade Parameters:
Bias: Long
Entry: Previously established
Stop Loss: Moved to Entry (risk-free position)
TP1: ✅ Hit
TP2: ✅ Hit ($201)
TP3: $217
TP4: $241
Partial Exits: Ongoing — looking to scale out at remaining targets
3️⃣ Key Notes:
✅ Amazon continues to show strong growth fundamentals:
– Revenue: $637B
– Net Income: $60B
– Market Cap: $2.18T
– EPS: 6.26
– PE Ratio: ~33
✅ Strong employee growth (+31K, a 2% increase), signaling continued expansion
✅ Financial forecasts suggest solid growth for the next 4 quarters and full-year estimates — with a potential slowdown only beginning Q1 2026
✅ The technical structure flipped resistance into support, confirming a bullish continuation
❌ A deeper macro slowdown or disappointing forward guidance in late 2025/early 2026 could pressure valuations — monitor this closely
4️⃣ Follow-Up: As long as price holds above our entry zone, we’ll keep managing this trade toward $217 and $241. If momentum continues, we may revisit the setup for potential re-entries or compounding opportunities.
Please LIKE 👍, FOLLOW ✅, SHARE 🙌 and COMMENT ✍ if you enjoy this idea! Also share your ideas and charts in the comments section below! This is best way to keep it relevant, support us, keep the content here free and allow the idea to reach as many people as possible.
Disclaimer: This is not a financial advise. Always conduct your own research. This content may include enhancements made using AI.

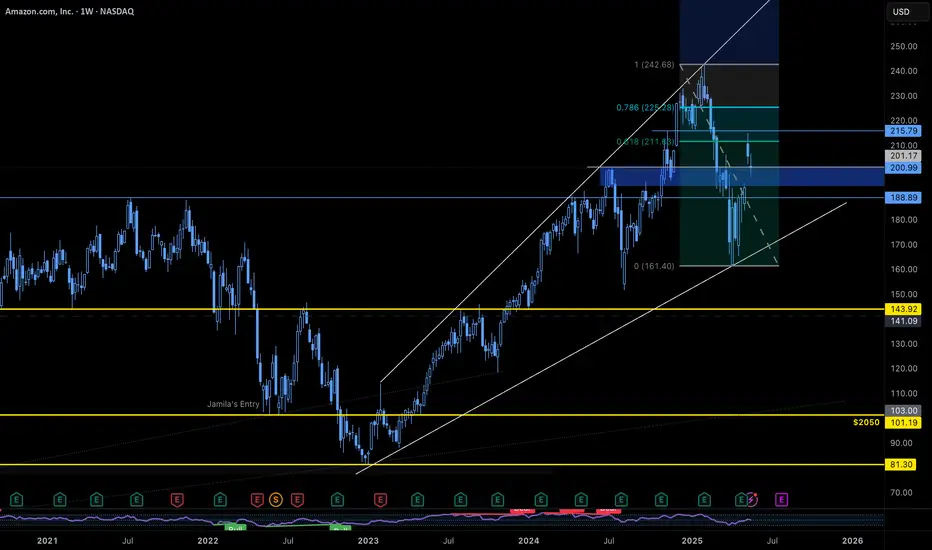
$AMZN Weekly Setup – Watch the $193 GapHere's what we're seeing on the weekly chart:
Price recently hit the 61.8% fib retracement from the all-time high to the April 2025 low
Sitting on strong support from the July 2024 high
A gap at $193 is just below current levels
If the gap closes and holds, we could see a continuation of the recent move higher — setting up a powerful weekly higher low. This could offer broader momentum in the large-cap tech space.
NASDAQ:AMZN
$AMZN Cracks Once AgainIt should be no surprise that after massive gains such as we have seen lately, stocks tend to retrace 60-70% or more back to the origin from whence they came.
This is largely due to the Market Maker "Making a Market" for everyone to play in, but mostly so they don't loose any money.
The Tech space in general and Especially names like NASDAQ:TSLA , NASDAQ:AMZN , and NASDAQ:NVDA are flashing warning signs. A Major pullback event is coming.
Likely the second wave down to our first tariff wave seen earlier in march.
The CCI is rejecting on the High time frame, along with a rather lartge Head and Shoulders Pattern forming.
Some may call it a Double Bottom. Truth be told it's not fat a booty unless it worth slapping, and at these prices, she's all dried up.
Target 119 to close the Weekly box then accumulate with caution.

Amazon should be closely look for resistanceAmzon has importance resistance to be break at 218.25 USD with closed candle above 218.25. if it not close over 218.25 after it test this resistance. it might have a chance for dropped by 10%++. However, if it closed above 218.25 and stay drop for time frame 240 min. this is a chance for long to test 233.58 resistance.

Heikin Ashi VS Regular candlesticks - EducationalNASDAQ:AMZN
Everything is explained in the video.
I hope you will find it very educational and test it. Those who trade stocks will probably switch to Heikin Ashi :)
Thank you!

AMZN - PULLBACK INTO NEXT SWINGGood Morning,
AMZN - Another stock that initiated a pullback. Not to fear, AMZN is trending towards a support. If it does not hold we would experience lower lows. My opinion is that it will hold given the strong bullish momentum. We will see it complete its final wave and then a correction.
ENJOY!

$NVDA $TSLA $META $AMZN – Triangle Squeeze Incoming?📊 Symmetrical triangle formations are building across these tech giants — and volatility is compressing.
🔍 What to watch:
📈 Breakout above upper trendline = bullish momentum
📉 Breakdown below lower trendline = bearish confirmation
📉 RSI on NASDAQ:NVDA is at 73.04 = overbought warning
⚠️ NASDAQ:NVDA earnings drop May 28, could be a trigger for resolution
These coils don’t last forever. Price is building pressure — and one strong candle could break the dam.
Stay sharp, and tighten your stops.
This is where risk management matters most.
👇 Which side are you betting on — breakout or breakdown?

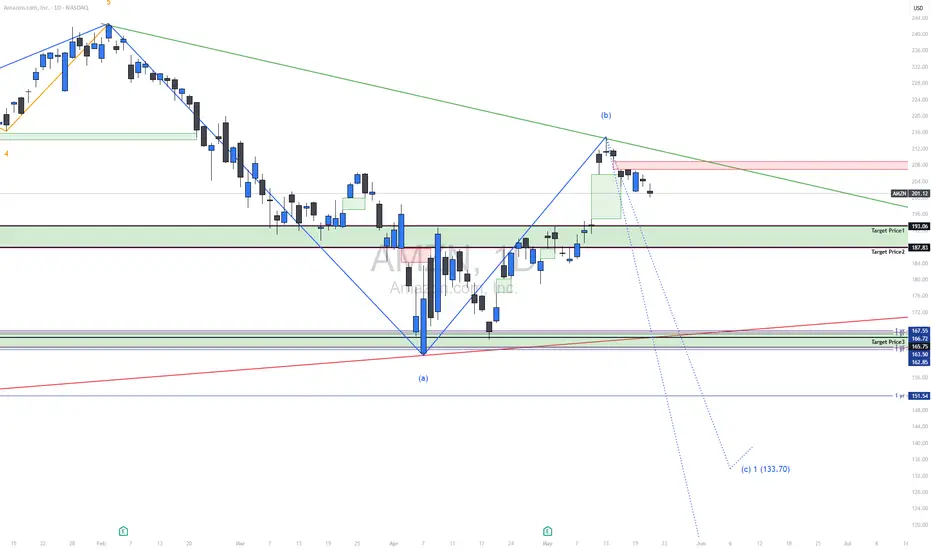
SHORT | AMZN NASDAQ:AMZN
Current Price Action:
Price: $201.12
Recent Drop: -2.95 (-1.45%)
Support and Resistance Levels:
Immediate Resistance: $208–$212 (recent rejection zone)
Immediate Support: $193.06 (Target Price 1)
Further Supports:
Target Price 2: $187.83
Target Price 3: $167.55
Target Price 4: $164.72 / $163.55
Target Price 5: $151.54
Final Wave Target (c): $133.70
Trendlines:
Green Downtrend Line: Remains respected; price rejected at confluence.
Red Long-Term Support Trendline: Still valid; could act as a structural bounce level if tested.
Recent price action shows a breakdown from the short-term bullish move, indicating possible start of wave (c) to the downside.
Wave Structure:
Completion of corrective wave (b) followed by potential impulsive wave (c) targeting lower support areas.
Elliott Wave count suggests $133.70 is a possible wave (c) extension zone under bearish pressure.
Target Prices:
Target Price 1: $193.06
This zone is a minor support where bulls may attempt a defense.
Target Price 2: $187.83
A structural level from previous consolidation and a high-probability zone for price reaction.
Target Price 3: $167.55 – $163.55
Consolidated support zone; may attract buying interest or lead to acceleration if broken.
Target Price 4: $151.54
1-year support and psychological level.
Target Price 5 / Wave (c): $133.70
If the bearish wave unfolds fully, this is the projected terminal zone.
Summary:
Amazon (AMZN) has rejected a key resistance zone and appears to be entering wave (c) of a broader correction. The structure is bearish below the downtrend line and indicates further downside. Critical support levels to watch are $193.06 and $187.83 in the short term, with deeper targets at $167.55 and possibly as low as $133.70. This correction could accelerate if key support zones are breached.
Market prep 5-21The market sold off overnight, but nothing dramatic. A further move down and then recovery is a possibility. Gold pullbacks will likely be bought.
