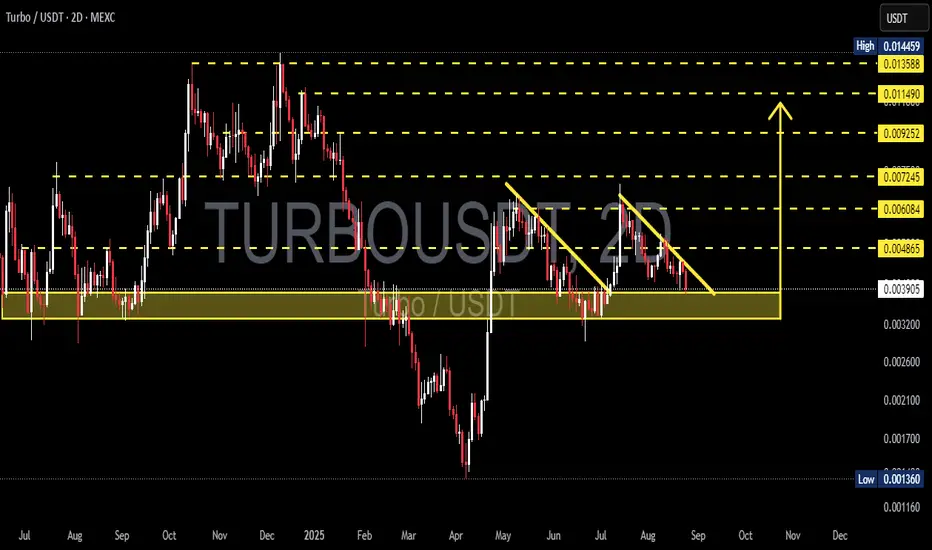
TURBO/USDT – at Key Demand Zone! Falling Wedge Near Breakout?📊 Full Analysis:
Currently, TURBO/USDT is trading at a very critical level. The chart shows price consistently being pressed down by the descending trendline (yellow), forming a Falling Wedge pattern—a structure that often signals a bullish reversal once broken to the upside.
At the same time, pric
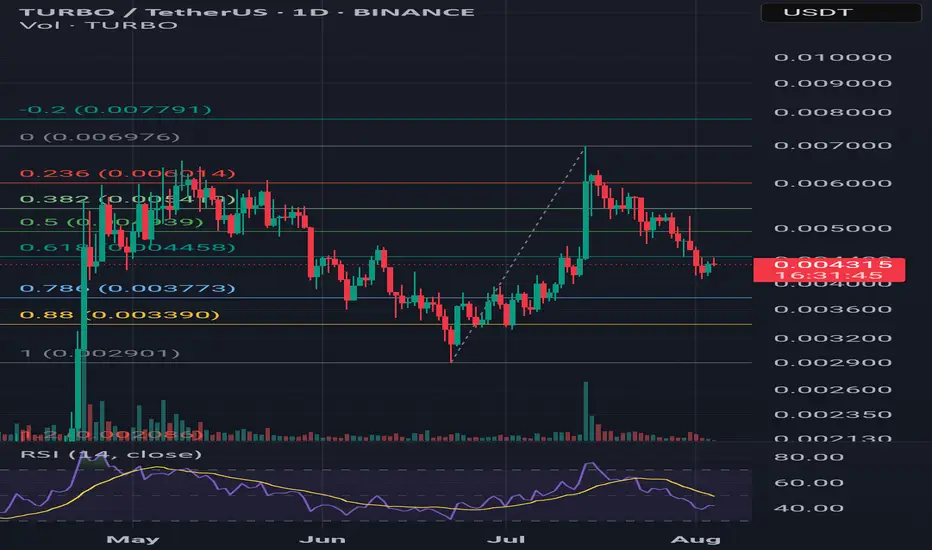
TURBO : Points I want to buyHello friends
Given the good growth we had, we have now achieved important price support with Fibonacci in the price pullback and I think the price can move from these areas to the specified targets.
*Trade safely with us*

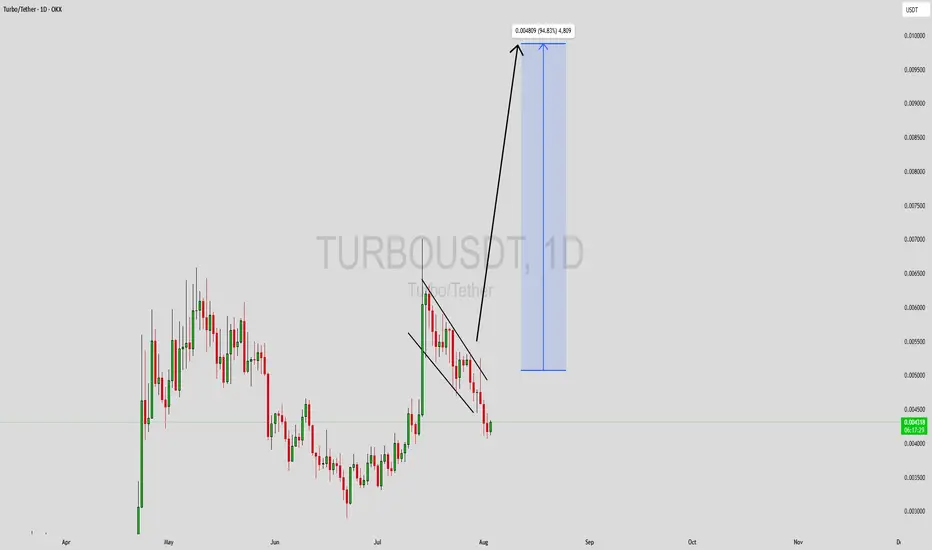
Turbo Breakout and Upcoming Cycle Low StrategyTurbo has broken out of its narrowing wedge and most likely flipped it into support. This could be a breakout-retest-resumption, but its next cycle low is coming up quickly around October 4th. I have a feeling the cycle low will extend to October 6th to sync up with BTC and stocks. I’ve made my core

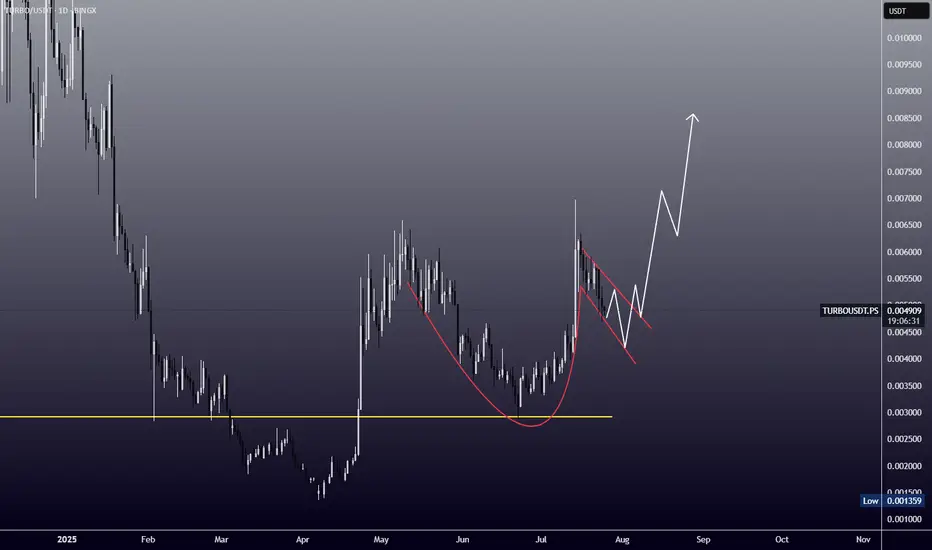
TURBO/USDT – Cup and Handle Formation (1D Chart)Overview:
TURBO/USDT is potentially forming a textbook Cup and Handle pattern on the 1-day chart. Price action suggests a rounded bottom (the “cup”) followed by a consolidation range (the “handle”), setting up for a possible breakout.
---
🔍 Pattern Structure:
- Cup Formation:
Price rallied fr
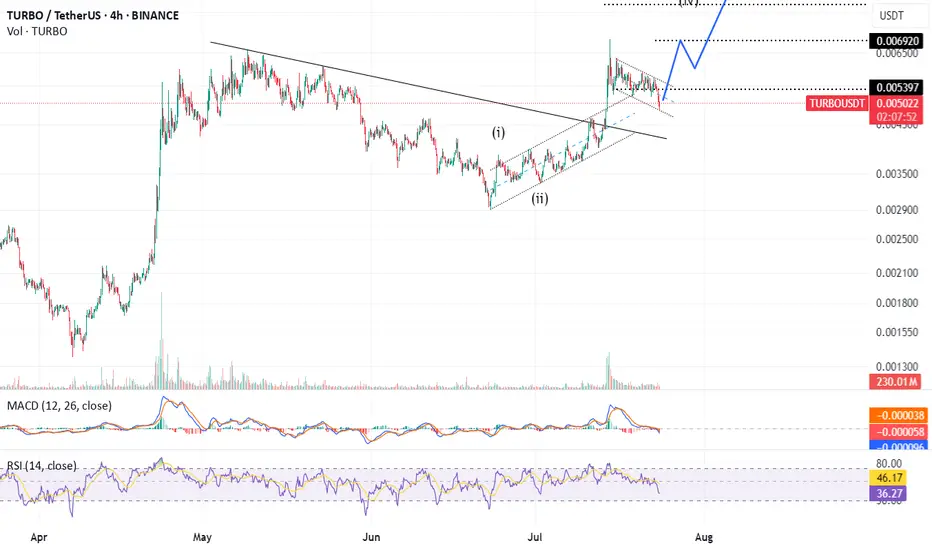
TURBOUSDT Forming Bullish PennantTURBOUSDT is currently exhibiting a bullish pennant pattern on the charts—a continuation setup that often leads to strong upward movement after a period of consolidation. This pattern typically forms after a sharp upward move, followed by a tightening range that resembles a pennant or small symmetri
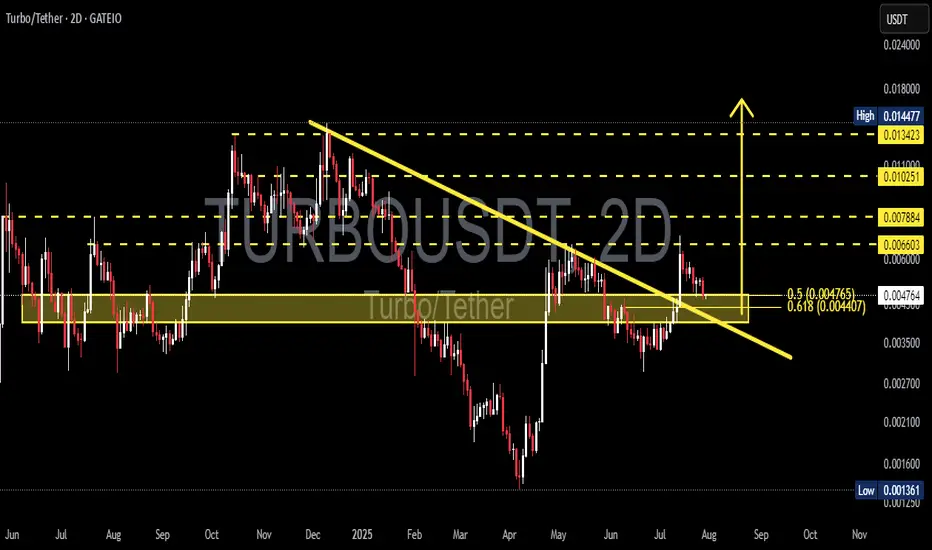
TURBO/USDT: Critical Decision Point – Breakout or Bull Trap?🧩 Overview
TURBO/USDT is currently sitting at a decisive technical juncture. After a prolonged downtrend since its late 2024 peak, the price has recently shown signs of a momentum shift by breaking out from a major descending trendline. The key question now: Is this the beginning of a bullish rever
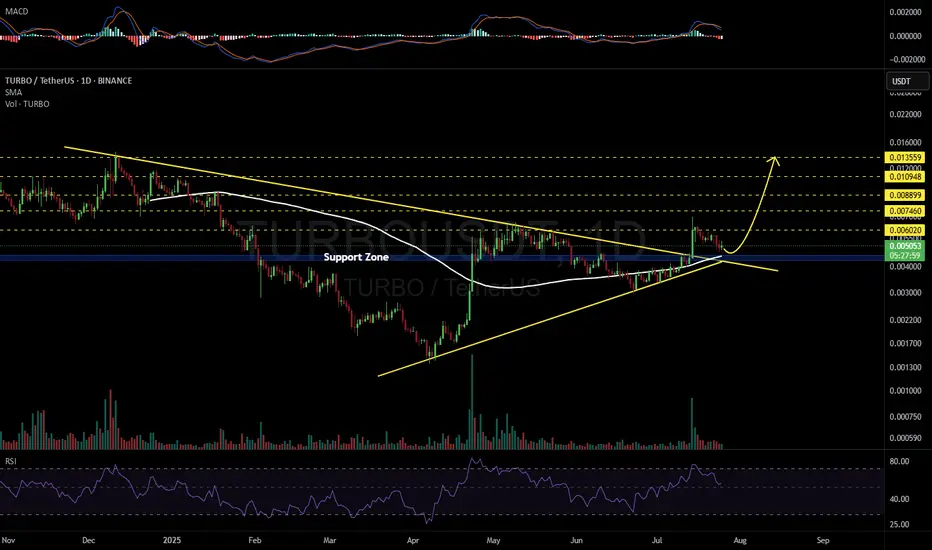
TURBOUSDT 1D#TURBO has broken above the symmetrical triangle and is now testing the support zone. This zone is further strengthened by multiple layers of support, including the Ichimoku Cloud and the SMA100 — making it a strong area for a potential bounce. We're expecting a price reversal from this zone. In cas
Cup and handle on TOSHIEvery time I look at the TURBO chart I can't help but see this cup and handle formation.
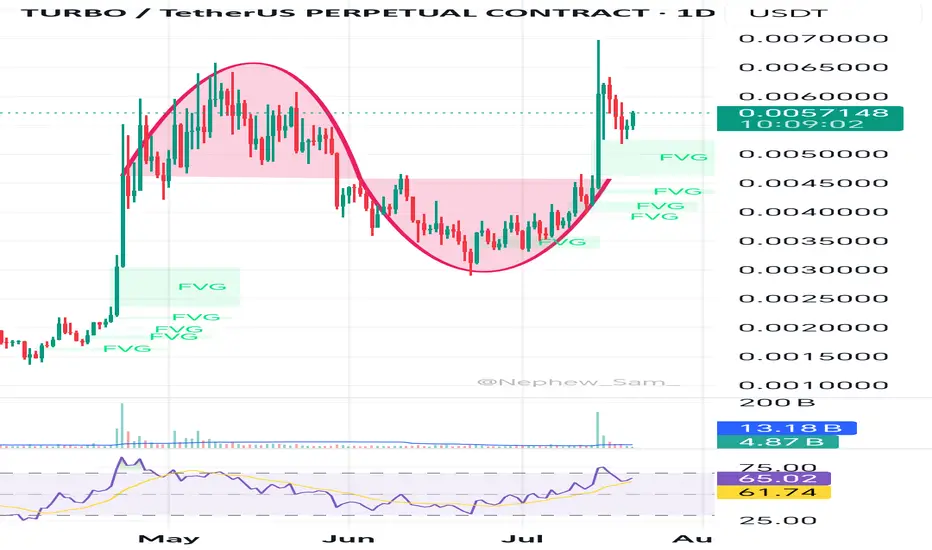
TURBOStill in a corrective wave with larger wave up, the correction may have ended already at 0.004842
The confirmation would be the break out of the corrective wave channel
See all ideas
Summarizing what the indicators are suggesting.
Oscillators
Neutral
SellBuy
Strong sellStrong buy
Strong sellSellNeutralBuyStrong buy
Oscillators
Neutral
SellBuy
Strong sellStrong buy
Strong sellSellNeutralBuyStrong buy
Summary
Neutral
SellBuy
Strong sellStrong buy
Strong sellSellNeutralBuyStrong buy
Summary
Neutral
SellBuy
Strong sellStrong buy
Strong sellSellNeutralBuyStrong buy
Summary
Neutral
SellBuy
Strong sellStrong buy
Strong sellSellNeutralBuyStrong buy
Moving Averages
Neutral
SellBuy
Strong sellStrong buy
Strong sellSellNeutralBuyStrong buy
Moving Averages
Neutral
SellBuy
Strong sellStrong buy
Strong sellSellNeutralBuyStrong buy
Displays a symbol's price movements over previous years to identify recurring trends.