Nvidia (NVDA) Share Price Growth SlowsNvidia (NVDA) Share Price Growth Slows
Equity markets are on the rise:
→ The S&P 500 index (US SPX 500 mini on FXOpen) has reached a new all-time high;
→ The Nikkei 225 (Japan 225 on FXOpen) hit a fresh record high yesterday;
→ Gains are also seen across other assets — for example, Ethereum has climbed to its highest level since November 2021.
The CNN Fear & Greed Index indicates market “greed”, but it is worth noting that one of the market leaders, Nvidia (NVDA), is not matching the broader bullish momentum.
Technical Analysis of Nvidia (NVDA)
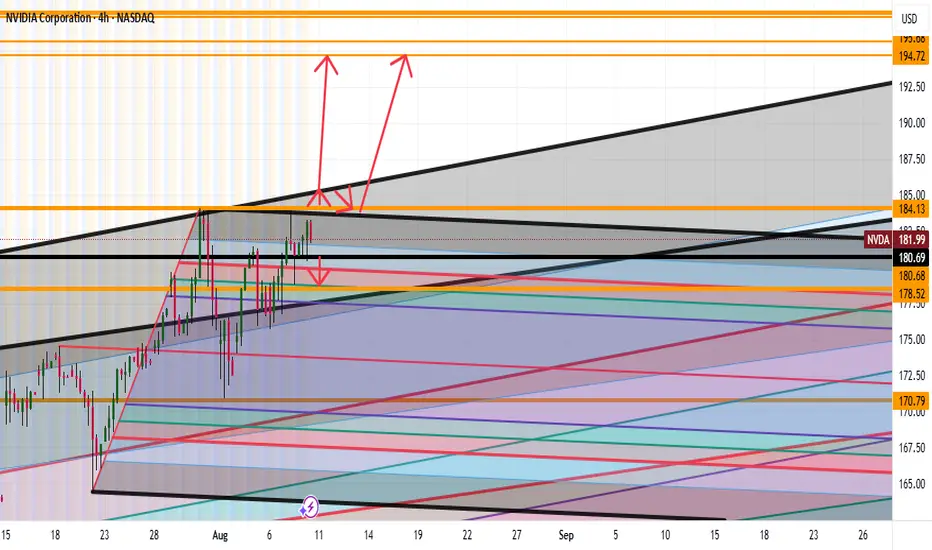
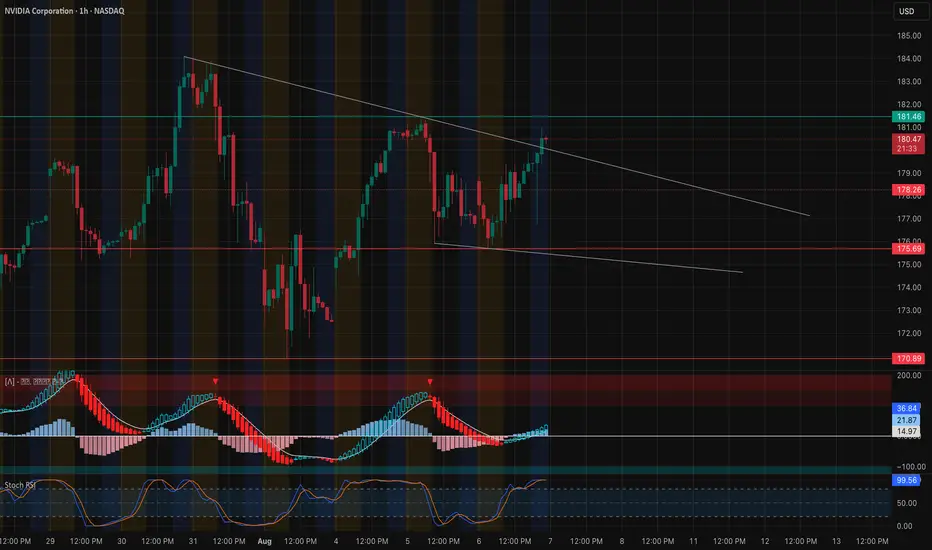
Although NVDA’s share price remains within a long-term ascending channel (shown in blue), holders have valid reasons for concern.
The NVDA chart shows that price growth is capped by the $183 resistance level, with a series of bearish signals emerging (as indicated by the arrows):
→ Following a bullish gap in late July, the price failed to sustain its highs and quickly retreated, erasing the upbeat sentiment;
→ A bearish engulfing pattern on 7 August suggests that the median line of the ascending channel is acting as resistance;
→ The RSI indicator peaked on 29 July, but subsequent price increases have not been accompanied by higher RSI highs — a sign of bearish divergence.
As a result, NVDA price is consolidating within a narrowing triangle:
→ On the one hand, higher lows indicate that buyers are still supporting the price;
→ On the other hand, the $183 level continues to cap the advance of this market leader despite the broader bullish environment.
Bulls need to show determination soon to break through the key $183 resistance; otherwise, the ascending channel in place since early July risks being breached. In that scenario, the August low near $172 could be retested.
This article represents the opinion of the Companies operating under the FXOpen brand only. It is not to be construed as an offer, solicitation, or recommendation with respect to products and services provided by the Companies operating under the FXOpen brand, nor is it to be considered financial advice.
NVDAN trade ideas

NVDA: 183.16 WEDNESDAYBullish Entry: 186.00 / 188.00 – Target: 188.00 – Stop: 184.00
Bearish Entry: 182.00 / 180.00 – Target: 180.00 – Stop: 183.50
breaks out with strength and volume, it could extend even to 190.00 intraday.
180.00 could act as a potential rebound.

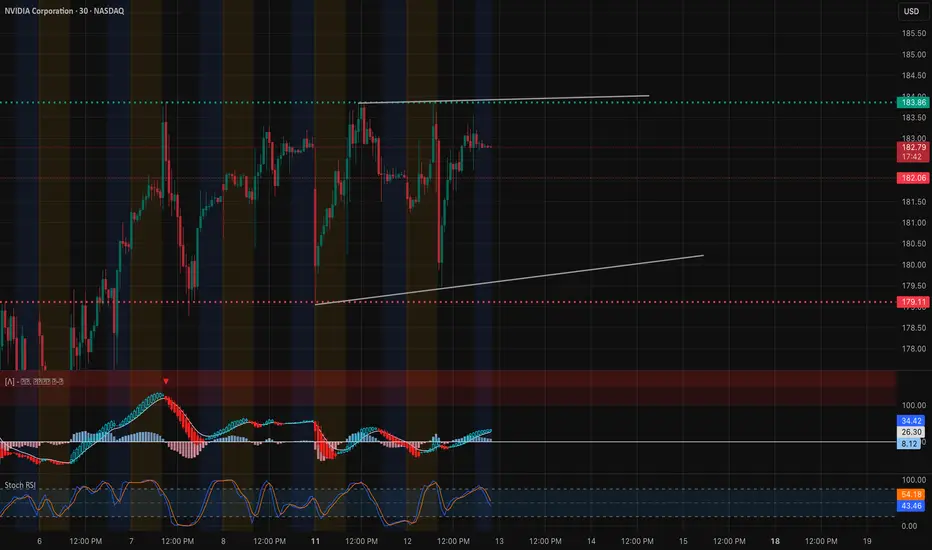
NVDA – TA + GEX Confluence for August 13, 202530-Minute Price Action
NVDA is trading in a tight consolidation range near $183.86, repeatedly testing resistance without a confirmed breakout.
* Resistance: $183.86 – multiple tests with no close above, forming the top of the range.
* Support: $182.06 – intraday pivot; $179.11 – deeper support and prior demand zone.
* Indicators:
* MACD is flat, reflecting indecision and reduced momentum.
* Stoch RSI is mid-range, suggesting room for either a breakout or a fade depending on market catalysts.
1-Hour GEX Insights
* Highest Positive NET GEX / Gamma Wall: $183.86 – matches perfectly with 30m resistance, showing strong hedging activity.
* Call Walls Above: $187.5 (2nd gamma wall), $190 (major call wall & 3rd gamma level).
* Put Support: $177.5 (1st defense), $175 (stronger floor), $172.5 (secondary gamma floor).
* IVR: 16.2 – relatively low implied volatility rank, keeping long option premiums reasonable.
TA + GEX Combined Read
The 30m chart’s repeated tests of $183.86 line up exactly with the largest GEX wall on the 1h chart.
* A breakout above $183.86 could trigger gamma-driven momentum into $187.5 and potentially $190 if volume supports.
* A rejection at $183.86 could bring a retest of $182.06, and if that fails, a move toward $179.11 and $177.5 GEX support.
Trading Scenarios for August 13
* Bullish Breakout: Long calls or debit spreads above $184 targeting $187.5–$190.
* Bearish Rejection: Puts or put spreads if $183.86 rejects and $182.06 breaks, targeting $179.11–$177.5.
* Neutral Range: Credit spreads between $179–$184 may work if consolidation continues, but be ready to close early on breakout.
Reasoning
The 30m chart’s tight range reflects market indecision, but the 1h GEX data highlights $183.86 as a key pivot for tomorrow. Breaks above this level open the path to the next gamma cluster, while rejection keeps NVDA in range or triggers a pullback toward strong GEX-supported floors.
NVDA goes to $200NVDA keeps pushing towards $200 major resistance area, a very good momentum showed by a clear bullish trendline and stochastic momentum. No sign of bearish yet but still we've seen a slow but steady gain over the last couple days. Trend-based fibonacci is used to project the target price for NVDA. Short-term downward momentum might appear, however if NVDA isn't break down the 1.618 fibonacci level ($165-$170 price range) from the previous trend-based fibonacci, we could say that NVDA still remain bullish. Stop loss is optional on that level.

$NVDA - $280-300 YEAR END TARGET Trend is your friend, just keep it simple. Lots of runway ahead accompanied with improved gross margins of mid 70% during back half of the year on already high margins. Technical trend channel has a price objective between $280 to almost $300.

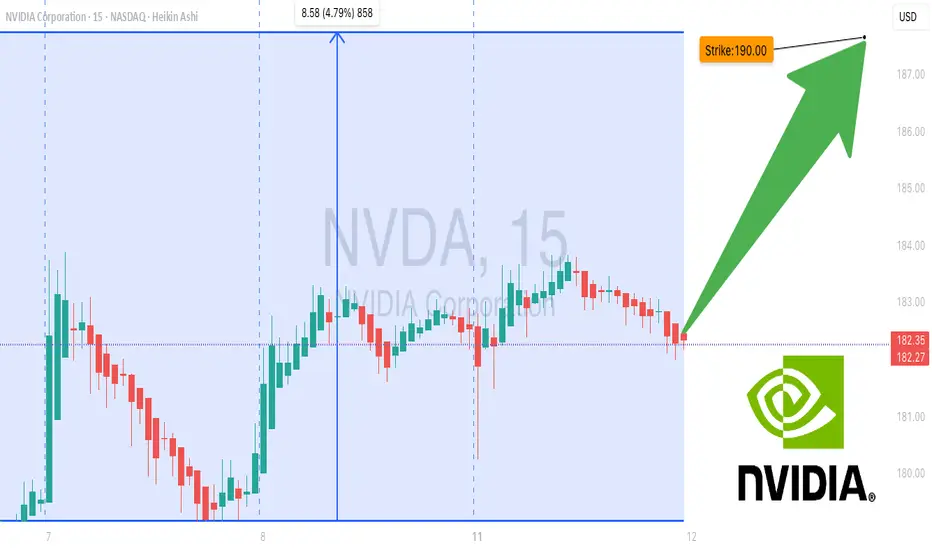
NVDA don’t Miss Out--$190 Call Target, Momentum on Fire## 🚀 NVDA Weekly Options Breakdown (Aug 11, 2025) 🚀
### 🔥 Market Sentiment: Bullish Bias Across Models
* **Grok/xAI**: Strong Bullish — rising RSI & bullish flow, but *watch weak volume*.
* **Claude/Anthropic**: Moderate Bullish but *no trade* due to policy risks & volume doubts.
* **Gemini/Google**: Moderate Bullish, recommends **\$192.5 calls** with stop loss — volume risk noted.
* **Llama/Meta**: Bullish — buy **\$190 calls**, manage volatility & premium decay.
### ✅ Consensus Trade Setup:
**Buy \$190 Calls** expiring Aug 15 @ \$0.70 premium
* 🎯 Profit Target: \$0.91
* 🛑 Stop Loss: \$0.35
* 📊 Confidence: 70%
* ⏰ Entry: Market Open Next Trading Day
### ⚠️ Key Risks:
* Policy/news impact on semiconductor sector
* Moderate gamma risk & possible volatility spikes near expiry
---
### 🔍 Model Insights Breakdown
| Model | Sentiment | Trade Idea | Confidence |
| ---------------- | ---------------- | ------------------------------ | ---------- |
| Grok/xAI | Strong Bullish | Buy \$190 Calls | 70% |
| Claude/Anthropic | Moderate Bullish | No trade (high news risk) | 45% |
| Gemini/Google | Moderate Bullish | Buy \$192.5 Calls w/ stop loss | 65% |
| Llama/Meta | Bullish | Buy \$190 Calls w/ risk mgmt | 70% |
---
### 💡 Why This Matters
* RSI and options flow point strongly bullish — calls dominate puts 1.2+ ratio
* Volume confirmation weak, so *manage risk tightly*
* Position best for aggressive traders ready to manage fast moves
---
📈 **NVDA Weekly Options Trade Summary**
```json
{
"instrument": "NVDA",
"direction": "call",
"strike": 190.0,
"expiry": "2025-08-15",
"confidence": 0.70,
"profit_target": 0.91,
"stop_loss": 0.35,
"size": 1,
"entry_price": 0.70,
"entry_timing": "open",
"signal_publish_time": "2025-08-11 10:33:48 UTC-04:00"
}
```
NVDA NVIDIA Price Target by Year-EndNVIDIA Corporation (NVDA) remains a dominant force in the AI and semiconductor markets, with its forward price-to-earnings (P/E) ratio currently at 19.37—a reasonable valuation considering its growth trajectory and market position.
NVIDIA’s leadership in the AI sector, particularly through its cutting-edge GPUs, has driven strong demand from data centers, cloud providers, and AI developers. The company’s recent product launches, including the Hopper and Blackwell architectures, have further solidified its competitive edge.
Despite recent market volatility, NVIDIA's consistent revenue growth and expanding profit margins support the bullish case. The current P/E of 19.37 reflects a balanced risk-reward profile, suggesting that the stock is not overvalued despite its impressive performance.
A price target of $145 by year-end reflects approximately 15% upside from current levels, driven by sustained AI demand and growing market penetration. Investors should watch for quarterly earnings reports and updates on AI chip demand, as these will likely act as key catalysts for upward momentum.

Nvidia 184 CallsNvidia 184 Calls
🔍 Pattern Analysis
• You’ve identified an ascending triangle pattern:
• Rising trendline support (black line).
• Flat resistance near the $183.78 level (green box).
• This is a bullish continuation pattern, especially in an uptrend like NVDA has been in.
Key Levels
• Current Price: ~$182.83
• Resistance / Breakout Zone: ~$183.78 (clearly marked)
• Support Levels:
• Short-term: $182.16, $181.49
• Risk Level (Stop): ~$178.90
• Stronger Support: $175.75, $174.57
• Target (Take Profit): ~$190.03 (marked in green)
Trade Setup (Buy Breakout)
• Entry: Around the breakout of $183.78
• Stop Loss: ~$178.90 (below recent lows)
• Take Profit: ~$190.03
• Risk/Reward Ratio: Roughly 1:2, which is solid
Volume Observation
• Volume has been decreasing during consolidation, which is typical before a breakout.
• Watch for a volume spike to confirm the breakout above $183.78.
Risks & Notes
• Price is currently near resistance; wait for a confirmed breakout (candle close above $183.78).
• If it rejects this level again, a break below the ascending trendline could flip the setup bearish.
• If support at $181.49 or $178.90 breaks, NVDA could pull back toward $175 or even $171.
Final Thought
This is a bullish setup, but confirmation is key. Either:
• Enter on breakout with volume confirmation.
• Or wait for a retest of $183.78 as support after the breakout.

Nvidia 184.00 Calls aboveNvidia 184 Calls
🔍 Pattern Analysis
• You’ve identified an ascending triangle pattern:
• Rising trendline support (black line).
• Flat resistance near the $183.78 level (green box).
• This is a bullish continuation pattern, especially in an uptrend like NVDA has been in.
⸻
📊 Key Levels
• Current Price: ~$182.83
• Resistance / Breakout Zone: ~$183.78 (clearly marked)
• Support Levels:
• Short-term: $182.16, $181.49
• Risk Level (Stop): ~$178.90
• Stronger Support: $175.75, $174.57
• Target (Take Profit): ~$190.03 (marked in green)
⸻
📈 Trade Setup (Buy Breakout)
• Entry: Around the breakout of $183.78
• Stop Loss: ~$178.90 (below recent lows)
• Take Profit: ~$190.03
• Risk/Reward Ratio: Roughly 1:2, which is solid
⸻
📌 Volume Observation
• Volume has been decreasing during consolidation, which is typical before a breakout.
• Watch for a volume spike to confirm the breakout above $183.78.
⸻
⚠️ Risks & Notes
• Price is currently near resistance; wait for a confirmed breakout (candle close above $183.78).
• If it rejects this level again, a break below the ascending trendline could flip the setup bearish.
• If support at $181.49 or $178.90 breaks, NVDA could pull back toward $175 or even $171.
⸻
🧠 Final Thought
This is a bullish setup, but confirmation is key. Either:
• Enter on breakout with volume confirmation.
• Or wait for a retest of $183.78 as support after the breakout.
Let me know if you want a bearish scenario or a shorter time frame breakdown.

Bullish Continuation Based on this strong resistance here around 183.82, there's some strong upside if price breaks through. If it rejects there's light support around 179 and strong support around 178.

NVDA Technical Analysis & GEX Outlook. Aug. 11Technical Analysis (1H Chart)
NVDA is currently trading at 182.81, forming a rising wedge pattern — typically a bearish reversal setup, especially when nearing resistance. Immediate resistance is at 183.37, the upper bound from recent swing highs. Support is layered at 180.70, 178.75, and 175.70. MACD shows momentum flattening after a bullish run, while Stoch RSI is in mid-range, suggesting room for either a continuation push or a rejection. A break below the wedge’s lower trendline could trigger a retracement toward 178.75 first.
Bullish Case: Break and hold above 183.37 could retest 185–187 in short order, with momentum needing confirmation from volume.
Bearish Case: Failure to push past 183.37 and a wedge breakdown could accelerate selling toward 180.70, then 178.75.
GEX & Options Sentiment (1H View)
* Key Gamma Resistance: 185.0 — largest positive NET GEX and call wall.
* Above 185: Next strong resistance is 187.5 (33.3% / GEX7), then 190 (2nd call wall).
* Support Levels: 172.5 (2nd put wall, -2.16%), 167.5 (put support, -2.86%).
* Options Metrics: IVR 17.1 (low), IVX avg 42.6 (slightly declining -3.65%), Calls 2.1%, GEX +47m (positive skew).
Implication: Positive GEX above 182.5 suggests dealer hedging could dampen upside momentum, but a breakout over 185 could trigger a gamma squeeze toward 187–190. If price drops below 180, downside could accelerate toward 175–172 zone due to put wall positioning.
Thoughts & Strategy
* For Calls: Safer above 185 on volume confirmation for a push toward 187–190.
* For Puts: Watch for wedge breakdown below 180.70 to target 178.75–175.70.
* Avoid mid-zone trades between 181–183 without strong momentum confirmation.
Disclaimer: This analysis is for educational purposes only and not financial advice. Always manage risk and do your own research before trading.

NVDA Approaching Premium Supply – Breakout or Double Top?📊 Market Breakdown
NVDA is trading at $182.70 and pressing into the Premium/Supply Zone ($184.36). The stock is riding a strong ascending wedge pattern, but with RSI at 69.70 (near overbought) and price stretched from the equilibrium, we’re at a critical decision point.
Trend: Strong uptrend from the $123–$135 base, breaking above previous highs.
Key Structure: Price launched from the equilibrium zone (~$135), skipping retests and heading straight toward supply.
Volume: Recent push has healthy volume, but we’re starting to see signs of slowing.
Indicators:
MACD: Bullish but momentum is flattening.
RSI: 69.70 – close to overbought, increasing risk of pullback.
🛒 CALLS (Bullish Scenario)
Buy Zones:
🎯 Aggressive Entry: Bounce from $175–$178 support within wedge
✅ Confirmation Entry: Break & daily close above $185 with volume
Take Profits:
1️⃣ $195 – Psychological round number
2️⃣ $210 – Wedge breakout target
3️⃣ $225 – Extension target if momentum remains strong
Stop-Loss: $172
Why This Works: Breakout above $185 clears supply and could spark a momentum run to $195+ in 2–3 weeks.
🛑 PUTS (Bearish Scenario)
Sell Zones:
🚨 Aggressive Entry: Rejection at $184–$185 supply zone
📉 Breakdown Entry: Close below $175 support
Take Profits:
1️⃣ $160 – Mid-wedge support
2️⃣ $135 – Equilibrium zone
3️⃣ $123 – Major prior demand
Stop-Loss: $188
Why This Works: Rejection at supply with overbought RSI could send NVDA back toward $160–$135 in 1–2 weeks.
🔍 Technical Highlights
Pattern: Ascending wedge nearing apex; breakout or breakdown imminent.
Supply Zone Test: $185 is a key resistance level; watch reaction closely.
Macro Watch: NVDA is highly sensitive to AI sector momentum and NASDAQ performance.
⏳ Option Expiration Strategy:
1 Week: Rejection play off $185
2–3 Weeks: Breakout targeting $195–$210

NVDA: Week of Aug 11Expectations for NVDA is.. shocker.. continuation up .
Here is the summary of what to know for next week on NVDA:
Forecasts
Weekly 30 minute: bullish, trending up after initial consolidation into beginning of week.
Weekly hourly: bullish trending up.
Daily for Monday: Rally off open but fades and consolidates for the day. Consistent between 1-minute and 5-minute forecasts.
Fibs
183 is 0% retracement, expect initial resistance here.
Chart Patterns
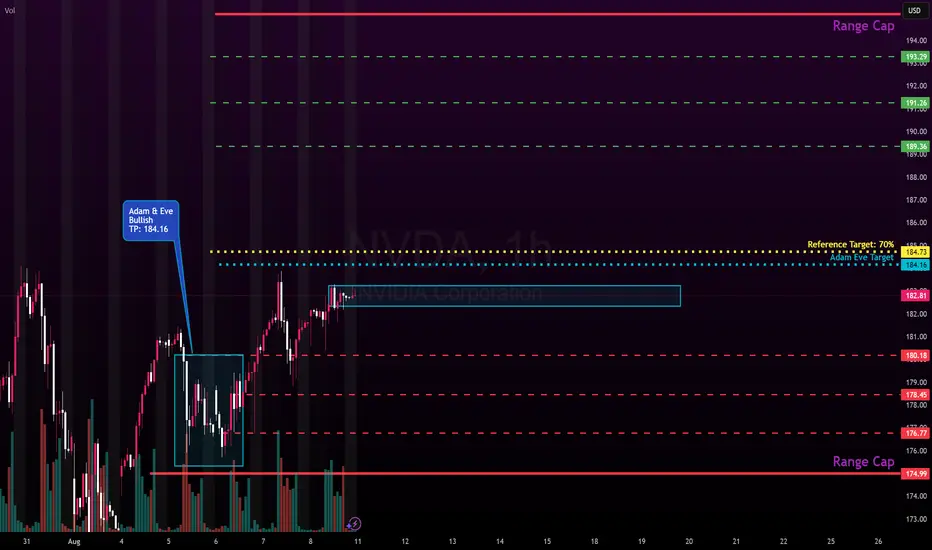
Bullish adam eve on the hourly formed, with TP listed in chart.
Math Projections
In addition to forecast, the following are modelled projections for next week:
Projected high: 191.65
Projected low: 179.73
Reference target (modelled target) 184 with a 70% hit rate, so watch that. Open above it, its a bearish target. Open below it, its a bullish target.
Options:
Flow alert on a really random ITM 2.0 contract of 614.7K premium with 2026-01-06 expiry.
Put/call skew PUTs 19.6% / CALLs 80.4%
Also 1.59 Mil in premiums on the 120 strike
Implied high: 191.50
Implied low: 173.89
CPI and PPI into Tuesday and Wednesday so be watchful of that.
Just sharing observations and projections, not advice.
Safe trades!
$NVDA filled the gap. NASDAQ:NVDA filled the gap on the downside. A lot of bearish flow came in yesterday. But today the flow was bullish early.
NVDA Don’t Miss Out## ⚡ NVDA Swing Setup (2025-08-08) ⚡
**Bias:** 📈 **Moderate Bullish** — RSI hot (67), trend up, low VIX, but volume still meh.
**🎯 Trade Plan**
* **Ticker:** \ NASDAQ:NVDA
* **Type:** CALL (LONG)
* **Strike:** \$185.00
* **Entry:** \$3.15 (near open)
* **Profit Target:** \$4.65 (+48%)
* **Stop Loss:** \$2.13 (-30%)
* **Expiry:** 2025-08-22 (14DTE)
* **Size:** 1 contract
* **Confidence:** 75%
**📊 Key Notes**
* RSI strong = momentum on your side ✅
* VIX favorable for calls ✅
* Weak volume & neutral flow = confirm before adding size ⚠️
* Watch breakout above **\$183.88** for momentum kick
**💡 Play Idea:**
Ride momentum to \$195+, take 50% profits at \$4.65, trail stops to lock gains.

NVDA Going to 194 Full AnalysisGood afternoon Traders
So looking at NVDA we have a strong monthly bullish trend
Micro though we see the following:
Bearish: If we break the lows of 180 expect to see 178 getting hit
Bullish: Break 184 highs then expect to see a punch up to 185 then small correction then a big up to 190's or we miss the correction and blow right through to the 190's
Happy Trading Folks
Trade Smarter Live Better
Kris
NVDA: 180.77Bullish Entry: 184.00 / 186.00 Bullish Stop 180.50 Bullish Target 188.00
Bearish Entry: 180.00 / 176.00 Bearish Stop 182.00 Bearish Target 174.00

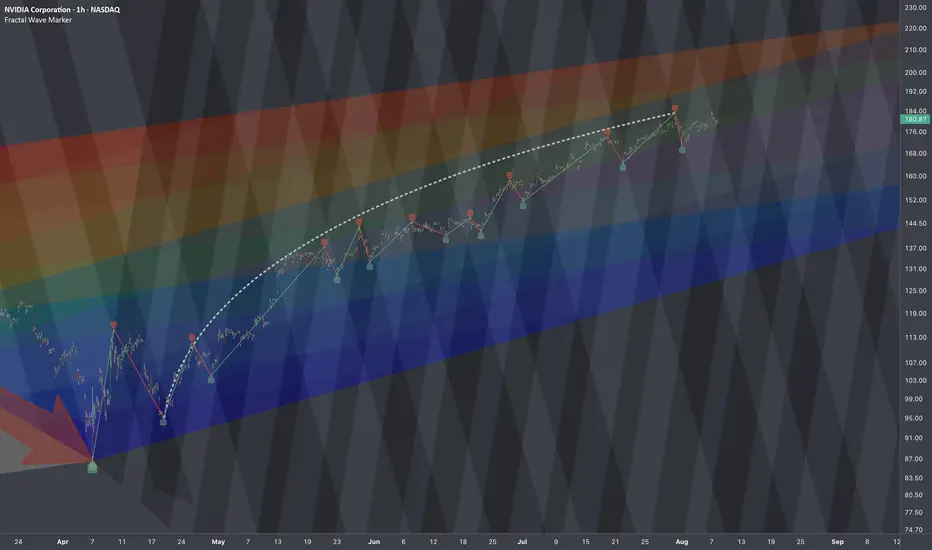
$NVDA: Tracking Formations🏛️ Research Notes
Frames of Reference
Interconnection of 3rd degree points fractal hierarchy
Multi-scale Interconnection
Merging into probabilistic layout
Market movement reflects proportional relationships inherent to its own scale. Fibonacci ratios, appear not by accident but as structural constants within this probabilistic environment. Price and time intervals often align with these ratios because markets are recursive systems where past structures inform the formation of new ones through scaled transformation. In this framework, the golden ratio serves as more than a tool for retracements or extensions, as encodes the geometry of market behavior itself via frames of reference. Whether in the spacing of pivots, the rhythm of cycles, or the layering of trends, its presence points to a self-organizing principle at work.
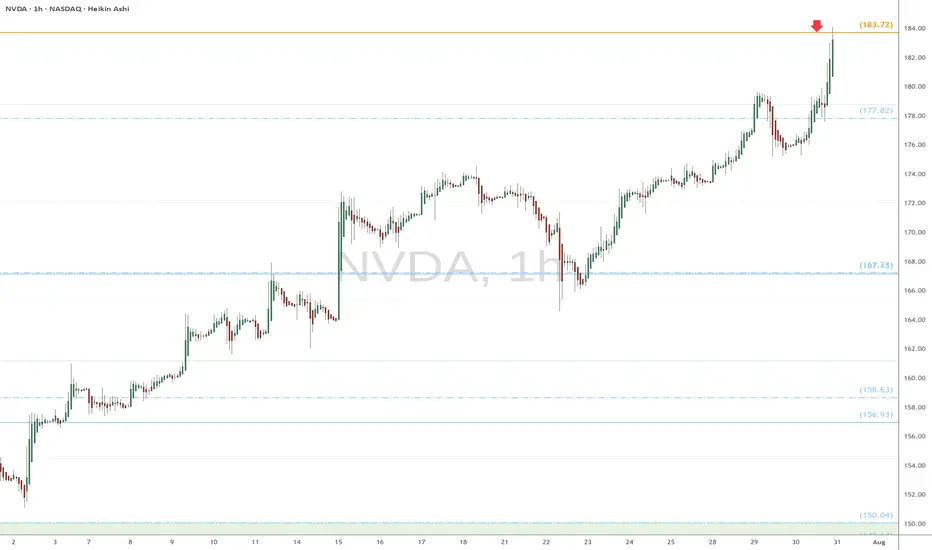
NVDA heads up at $183.72: Golden Genesis fib to mark a TOP?Chips have been flying high since the April lows.
NVDA has just hit a Golden Genesis fib at $183.72
This is a "very high gravity" fib so expect a reaction.
It is PROBABLE that we "orbit" this fib a few times.
It is POSSIBLE that we reject to form a major top.
It is PLAUSIBLE that we Break-n -Retest to continue.\
.
See "Related Publications" for previous EXACT plots ------>>>>>>>>
Such as this post at the last Golden Genesis:
Hit the BOOST and FOLLOW for more such PRECISE and TIMELY charts
============================================================
.
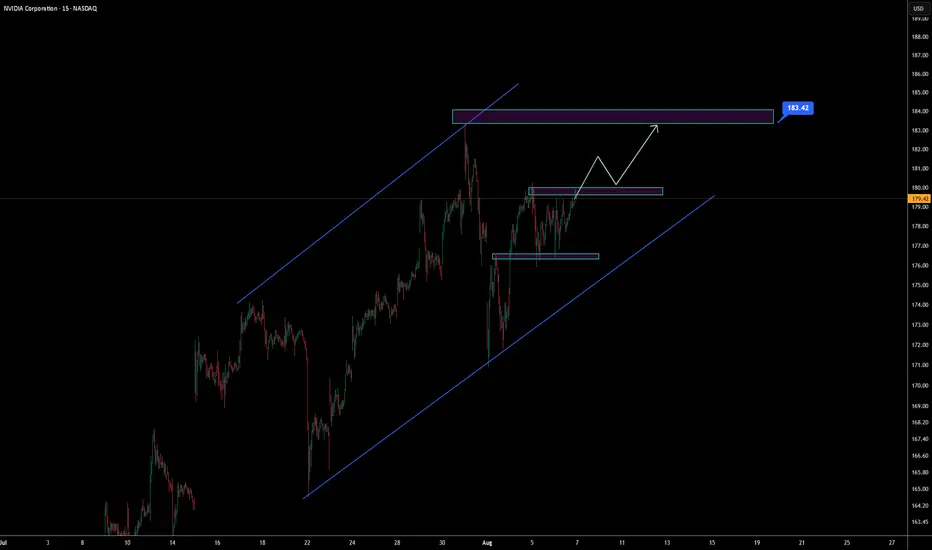
NVIDIA Approaching Breakout – Targeting 183.42 Within AscendingNVIDIA is moving within a well-defined ascending channel.
The price is currently consolidating near a local resistance area, showing signs of bullish continuation.
A breakout above this zone could confirm momentum toward the upper boundary of the channel, with a projected target around 183.42.
Watching for bullish structure and volume confirmation.
NVIDIA at the Crossroads: Will This Breakout Hold or Fake? Aug 7🧠 Technical Analysis – 1H + 15M Chart
NVDA is testing the upper bound of a symmetrical triangle on the 1-hour chart — a critical spot that could either break for continuation or reject back into the wedge.
* Trendline resistance from previous highs is pressing NVDA around 180.80–181.50.
* Stochastic RSI is overheated (>99), suggesting a potential pullback or fakeout before true breakout strength.
* MACD is crossing bullish with increasing histogram momentum — short-term buyers are stepping in.
On the 15-minute chart, we see:
* Tight coil forming near 181.00.
* Minor resistance at 181.46 from previous rejection.
* A bullish breakout above 182.00 on volume would confirm a short-term rally.
⚠️ Keep an eye for a potential fakeout above trendline and reversal back below 179.70 — a CHoCH could trap late bulls.
💥 GEX + Options Sentiment (Based on 1H Chart)
* GEX Map shows massive resistance forming around 182.5–185, with:
* 57.12% Call Wall at 182.5
* 51.68% Call Wall at 185
* Gamma is heavily concentrated just above current price — strong dealer hedging could cap upside moves if flow doesn't increase.
* Support Zones:
* 175 → Put support and HVL level
* 172.5 → Cluster of downside GEX risk (-7.23%)
* IVR is at 19.3 (low), with Call flow only at 3.4% — suggesting institutions are not aggressively chasing upside here.
🎯 Trade Scenarios
Bullish Breakout Setup
* ✅ Entry: Above 182.00 breakout
* 🎯 Target: 184.20 → 185.50
* 🛑 Stop: Below 179.50 or re-entry inside triangle
Bearish Rejection Setup
* 🔻 Entry: Rejection from 181.50–182.00 zone
* 🎯 Target: 178.20 → 175
* 🛑 Stop: Above 182.30
My Thoughts:
NVDA is at a decision point — either break out and squeeze through GEX walls or get trapped and fade to lower support zones. Volume and reaction at 182 will be key. This is a high-risk area for chasers — ideal zone for scalpers and short-term breakout traders with tight stops.
Disclaimer: This analysis is for educational purposes only and does not constitute financial advice. Always do your own research and manage your risk accordingly.
Nvidia - This is clearly not the end!📐Nvidia ( NASDAQ:NVDA ) will confirm the breakout:
🔎Analysis summary:
Over the past couple of months, Nvidia managed to rally about +100%, reaching top 1 of total market cap. Most of the time such bullish momentum just continues and new all time highs will follow. But in order for that to happen, Nvidia has to confirm the all time high breakout now.
📝Levels to watch:
$150
🙏🏻#LONGTERMVISION
SwingTraderPhil

NVDA: Bullish Channels and Momentum CheckWe're seeing a compelling case for continued upward momentum in NVDA, but it's crucial to understand the different layers of the trend and key resistance levels.
Macro Trend: The Expanding Bullish Channel
On the weekly timeframe, a larger expanding bullish channel has been forming. The price is currently near the top of this larger channel, which could act as a significant resistance level. This gives us a long-term context for the stock's current price action.
Micro Trend: The 'Small' Bullish Channel
Zooming in, NVDA is currently moving within a smaller, short-term bullish channel. The linear regression tool that I've created confirms this upward momentum. This smaller channel shows the real-time path buyers are following. It's a great way to see the current trend in detail and identify short-term support and resistance.
Momentum Check: The Weekly RSI
While the price action looks strong, a look at the weekly RSI (Relative Strength Index) suggests a note of caution. The RSI has been in a strong upward trend, but when comparing the current state to previous weekly RSI oversold positions, it appears the momentum could be "tapped a little harder." This might imply that the stock could experience a short-term pullback to cool off before a potential breakout, especially since we're currently close to the top of the large channel. Though I’m not necessarily seeing any pullback indicated yet, being we are currently sitting safe above the bottom of the current smaller bullish channel.
Conclusion: Key Levels to Watch
My analysis suggests that NVDA has strong upward momentum within two distinct bullish channels. I've marked various price targets that align with my charting and are designated by professionals as key levels to watch.
