#TESLA - $40 Swing?Date: 14-08-2025
#Tesla - Current Price: 339
#Tesla Pivot Point: 339 Support: 331 Resistance: 347
#Tesla Upside Targets:
| 🎯 Target 1 | 356 |
| 🎯 Target 2 | 365 |
| 🎯 Target 3 | 374 |
| 🎯 Target 4 | 384 |
#Tesla Downside Targets:
| 🎯 Target 1 | 323 |
| 🎯 Target 2 | 314 |
| 🎯 Target 3 | 304 |
| 🎯 Target 4 | 295 |
#TradingView #Nifty #BankNifty #DJI #NDQ #SENSEX #DAX #USOIL #GOLD #SILVER
TSLAN trade ideas

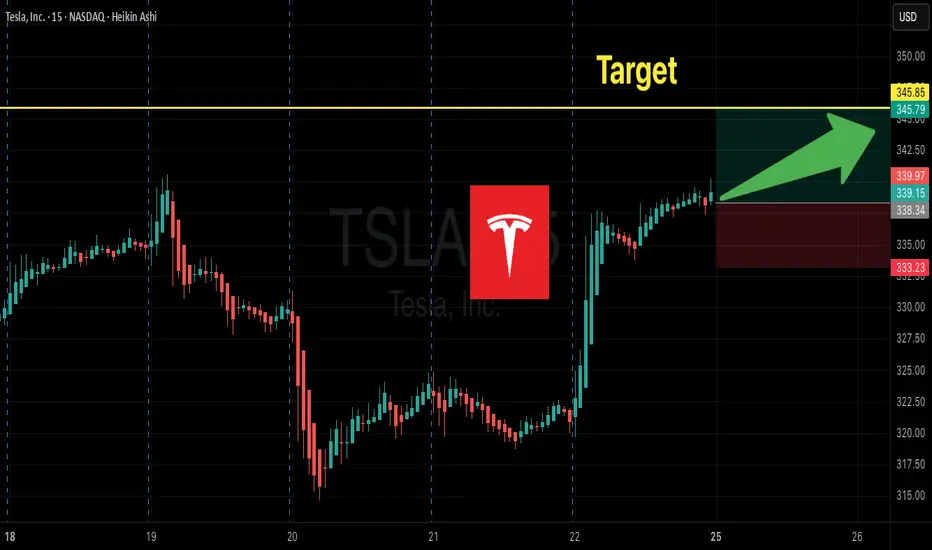
TESLA WILL KEEP GROWING|LONG|
✅TESLA is going up
Now and the stock made a bullish
Breakout of the key horizontal
Level of 346.00$ and the breakout
Is confirmed so we are bullish
Biased and we will be expecting
A further bullish move up
LONG🚀
✅Like and subscribe to never miss a new idea!✅

Tesla's Key Resistance Test: Why Price Action May Signal $400 Br
Current Price: $340.01
Direction: LONG
Targets:
- T1 = $380.00
- T2 = $400.00
Stop Levels:
- S1 = $325.00
- S2 = $310.00
**Wisdom of Professional Traders:**
This analysis leverages the collective expertise of thousands of professional traders and market specialists who closely monitor Tesla's price action and fundamental developments. By drawing from aggregated insights and technical consensus, this report identifies Tesla as a high-probability candidate for a bullish breakout, capitalizing on its current upward momentum and favorable market conditions.
**Key Insights:**
Tesla's current price action is showcasing strong upward momentum as the stock rebounds from technical support levels around $320. The recent push above the psychological barrier of $340 signals renewed investor confidence driven by robust fundamentals, including continued innovation in the EV space and improved delivery numbers. Additionally, Tesla's diversification into new segments, such as energy storage solutions, bolsters long-term growth potential.
From a technical perspective, Tesla is approaching a significant resistance level near $360, which, if broken, could accelerate price movement toward $380 and potentially $400 in the near term. Traders note that the Relative Strength Index (RSI) sits in a bullish yet non-overheated zone, suggesting further upside without imminent risk of correction. Moreover, increased volume in recent sessions implies strong institutional buying interest.
**Recent Performance:**
Tesla has demonstrated stability over the past month, recovering from a dip below $320. The stock has climbed approximately 6% in the last two weeks on the back of positive sentiment surrounding the company’s ability to outperform in a challenging macroeconomic environment. After reporting better-than-expected delivery figures for the previous quarter, Tesla's shares have seen heightened trading activity, indicating widespread interest among retail and institutional investors alike.
**Expert Analysis:**
Technical experts highlight Tesla’s well-established support levels around $325 as a strong base for continued upside. The stock is showing patterns consistent with ascending triangles, often seen as markers of bullish continuation. Furthermore, analysts point to Tesla’s improving gross margins and its ability to maintain pricing power in the EV market as critical factors supporting a sustained rally.
Tesla's ongoing product innovation, including advancements in battery technology and the anticipated release of its Cybertruck, has solidified investor sentiment. Analysts forecast that these developments could serve as additional catalysts to propel the stock toward its upper targets.
**News Impact:**
Recent reports about Tesla’s advanced self-driving technology and partnerships to expand its charging network have amplified the already positive outlook. Furthermore, strong quarterly delivery numbers reinforce Tesla's leadership in the EV industry, pushing markets to reassess its valuation upward. Policy support for green energy initiatives globally continues to favor Tesla, which remains the dominant player in renewable-focused automotive solutions.
**Trading Recommendation:**
A long position in Tesla at current levels is supported by technical indicators, robust fundamentals, and favorable industry dynamics. The breakout above $360 resistance could unlock substantial upside potential toward $400. With a recommended stop at $325, traders can limit downside exposure while capitalizing on Tesla's strategic positioning and momentum to the upside. This trade aligns with consensus-driven information and professional forecasts, emphasizing strong risk-reward potential.
Do you want to save hours every week? Register for the free weekly update in your language!

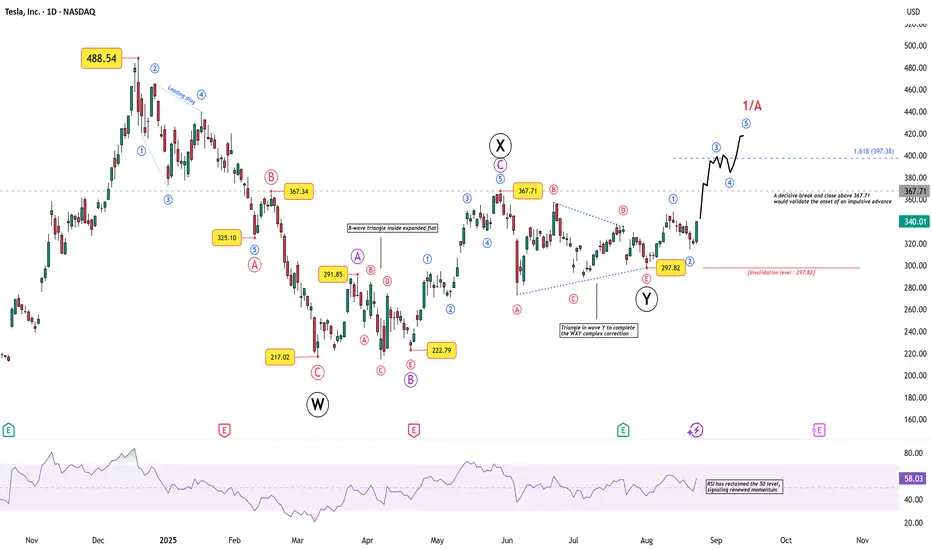
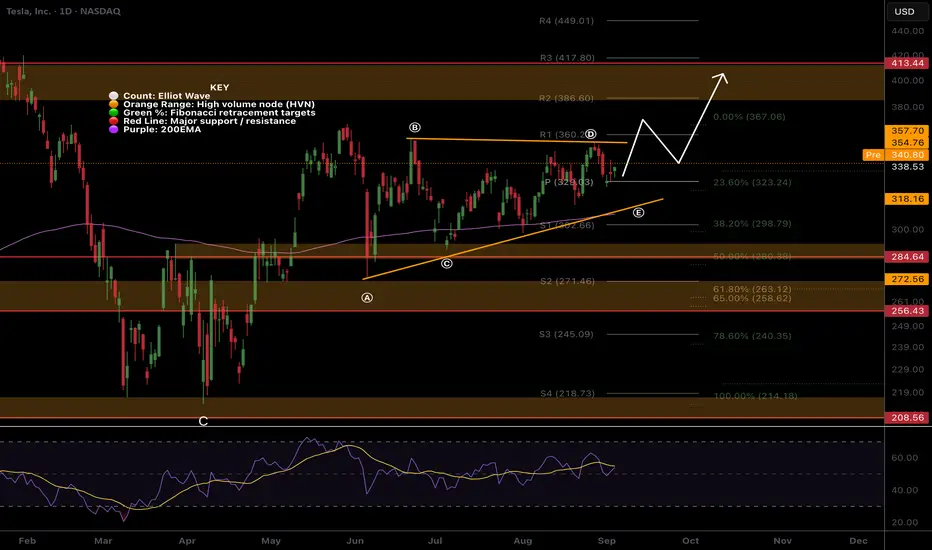
Tesla’s Breakout Test: Impulse or Fakeout?Tesla’s recent price action is stirring interest again, not just for retail traders but also for chart technicians who track Elliott Wave structures across global equities.
After a deep corrective phase that carried price down from 488.54 to 217.02 , Tesla has been carving out a multi-layered corrective structure. Here’s the breakdown:
Wave W completed into 217.02 , marking a sharp low.
This was followed by a complex X wave , which included an expanded flat where the B-wave unfolded as a triangle — a rare but valid corrective formation.
Wave Y then ended with a contracting triangle, neatly completing the W–X–Y correction near 297.82 .
From that point, Tesla appears to have begun an impulsive sequence:
Wave 1 and 2 are already visible, with the 297.82 low as the key invalidation level.
A decisive break and close above 367.71 would confirm the onset of Wave 3, targeting 397.38 (1.618× Wave 1).
Momentum is supporting the structure: RSI has reclaimed the 50 level, hinting at renewed strength.
What Next?
If the count holds, Tesla could be in the early stages of a larger impulsive rally, with Wave 1/A projecting toward the 400–420 zone . However, traders should remember that breaking below 297.82 invalidates the impulsive outlook and revives the broader corrective scenario.
Disclaimer: This analysis is for educational purposes only and does not constitute investment advice. Please do your own research (DYOR) before making any trading decisions.
TSLA Weekly Options Setup:345C--Don’t Miss Out
# 🚀 TSLA Weekly Options Setup: Bullish Momentum Play w/ \$345C 🎯 (Aug 29 Expiry)
### 🔑 Multi-Model Summary
✅ RSI (Daily 60.1 → Weekly 65) = Bullish momentum
✅ VIX \~14.2 = Favorable volatility regime
⚠️ Weak weekly volume (0.9x) + neutral options flow (C/P \~1.10)
⚖️ Mixed models → Some lean bullish (\$345–355C), others prefer **no trade** due to weak institutional flow
---
### 📊 Recommended Trade (If You Take It)
* 🎯 **Instrument**: \ NASDAQ:TSLA
* 📈 **Direction**: Call (Long)
* 🎯 **Strike**: \$345C
* 💵 **Entry**: \~\$6.00 (limit at open)
* 🛑 **Stop**: \$3.60 (40% risk control)
* 🎯 **Target**: \$9.00 (+50%)
* 📅 **Expiry**: 2025-08-29
* 📏 **Size**: 1 contract (scalable)
* ⚡ **Exit**: By **Thursday close** (avoid Friday gamma decay)
* 🔒 **Confidence**: 65% (moderate conviction)
---
### ⚠️ Key Risks
* Weak volume = no big-money confirmation
* Event risk (SpaceX headlines)
* 5 DTE = aggressive theta decay
* Gamma swings → fast intraday moves
---
### 📌 Conclusion
Momentum favors upside, but lack of strong institutional confirmation = **medium conviction**.
👉 Conservative traders: wait.
👉 Active traders: \$345C is the best balance of **delta, liquidity, and leverage** this week.
---
### 🔥 Hashtags
\#TSLA #OptionsTrading #WeeklyOptions #CallOptions #SwingTrade #DayTrading #MomentumTrading #OptionsFlow #BreakoutTrading #StockMarket 🚀📈💎🔥
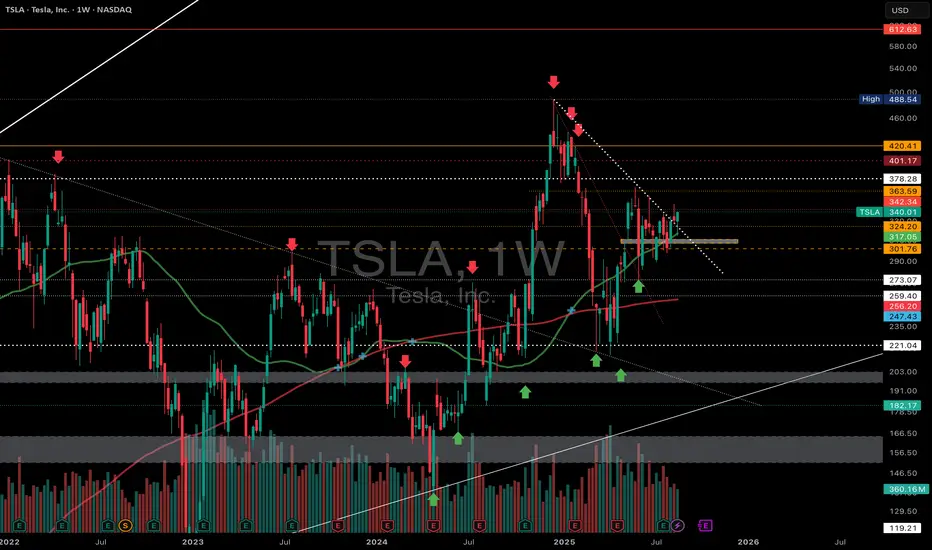
TSLA – Tesla Inc. | Daily Chart AnalysisNASDAQ:TSLA – Tesla Inc. | Daily Chart Analysis
Tesla ( NASDAQ:TSLA ) is currently navigating a critical technical region after a sharp +6.22% move, closing at $340.01.
🔍 Key Technical Developments:
• Break of Downtrend: Price broke above the descending trendline (dotted white) that had been rejecting rallies since the $488 peak. This breakout was followed by consolidation just above support.
• Support Zone: The $320–$325 region (highlighted box) has been tested multiple times and is now acting as a solid demand area.
• Moving Averages: TSLA is holding above both the 50 day (green) and 200-day (red) MAs bullish posture.
• Trend Reversal Structure: Higher lows forming since April 2025, supported by increasing volume on up moves a constructive bullish base.
📌 Key Levels to Watch:
• Resistance:
◦ $342.34 (current test)
◦ $363.59 (next major level)
◦ $378.28 and $401.17 as higher resistance zones
• Support:
◦ $324.20 / $321.84
◦ $301.76
◦ Below that: $273.07
📈 Current Price: $340.01 (+6.22%)
Tesla is attempting to break out of a long-term downtrend structure. A sustained move above $342–$344 could ignite momentum toward $360+.
📊 Watch for volume confirmation and reaction at major resistance zones.
#Tesla #TSLA #Stocks #TechnicalAnalysis #Breakout #ElonMusk #Trading #NASDAQ
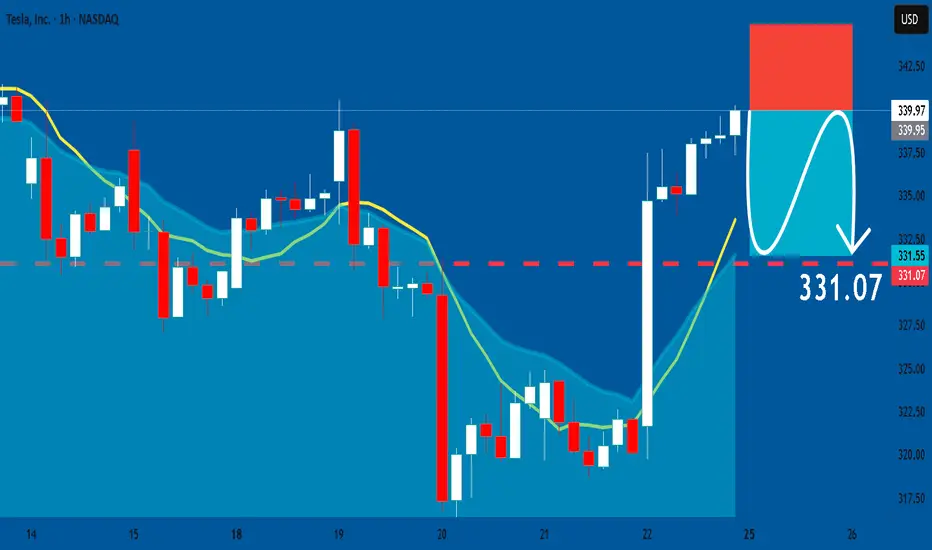
TESLA: Short Trading Opportunity
TESLA
- Classic bearish formation
- Our team expects fall
SUGGESTED TRADE:
Swing Trade
Sell TESLA
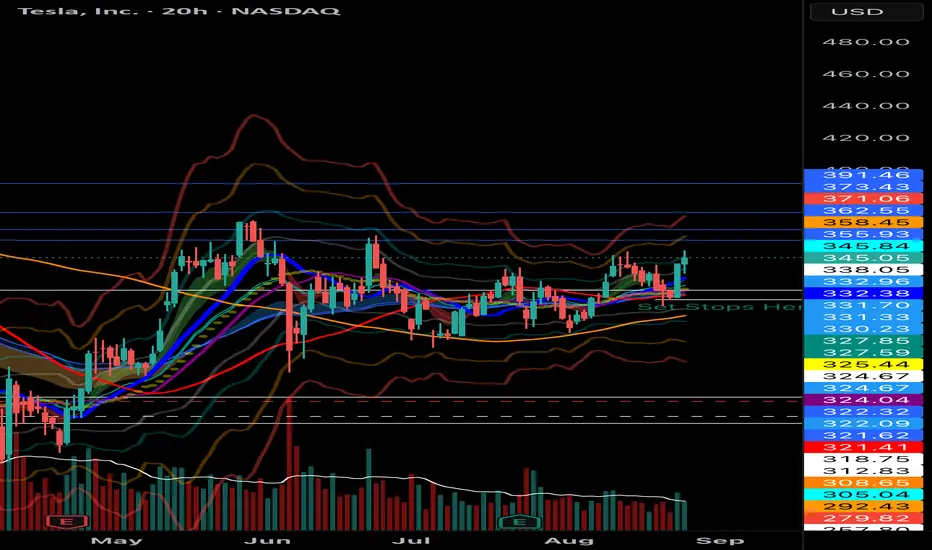
Entry Level - 339.97
Sl - 344.91
Tp - 331.07
Our Risk - 1%
Start protection of your profits from lower levels
Disclosure: I am part of Trade Nation's Influencer program and receive a monthly fee for using their TradingView charts in my analysis.
❤️ Please, support our work with like & comment! ❤️
TSLA on verge of major breakout on weekly?I have been waiting for this one... I averaged down. I bought call options. I bought TSLA 2x leverage in the form on TSLL. About f' ing time.
We had a false break out, a retest and now breaking out again. Momentum swinging to the upside and institutions are already in. Get ready for retail fomo.
A few good reasons why a person would want to buy. (Not financial advice)
Some current bullish catalysts for TSLA (Tesla) as of August 2025 include:
Full Self-Driving (FSD) Upgrades: Elon Musk announced Tesla is training a new FSD model with nearly ten times more parameters. A major software and video compression upgrade is scheduled, with an enhanced FSD vehicle targeted for release by the end of September. Progress toward regulatory approval in Europe and Australia is also in focus.
Robotaxi Expansion: Tesla is expanding its robotaxi launch into new U.S. regions (such as Northern California, Nevada, Arizona, Florida) with hands-free/eyes-off autonomy for FSD owners expected by year-end. The robotaxi rollout is a major narrative driver for growth.
Optimus Project: Tesla's humanoid robot initiative, Optimus, is expected to enter scale production in 2026. Optimus could open new growth sectors for Tesla beyond autos.
Technical Strength: TSLA recently bounced off key moving averages (the 50-day and 100-day SMA), with options activity (especially call volume at $340 strike) suggesting bullish sentiment. A breakout above $350 is viewed as confirming a renewed uptrend.
Macroeconomic Tailwinds: Dovish signals from the Federal Reserve have bolstered risk assets, supporting growth stocks like Tesla and improving sentiment in the sector.
Uptrend Indicators: The 10-day moving average crossed above the 50-day moving average (bullish), and the Aroon Indicator signaled an uptrend, historically associated with continued gains for TSLA.
TSLA: The thesis is coming to lightTesla is executing on Robotaxi's.
Poking holes through the FUD, and misleading articles.
Investors are beginning to see the thesis on the inevitable S curve that's incoming.
Speaking of incoming... $400 looks like a possibility in the coming month

BMW Puts on the Techie Suit to Challenge Elon🚘️ BMW Puts on the Techie Suit to Challenge Elon
By Ion Jauregui – Analyst at ActivTrades
BMW (Ticker AT:BMW) has fired up its engines in the technology race against Tesla. The Bavarian brand is launching the Neue Klasse, a platform that promises to revolutionize the electric car and will debut with the new iX3, unveiled ahead of the Munich Motor Show.
This is not just another electric SUV: the company has invested more than €10 billion to turn the car into a “superbrain on wheels.” Four central chips manage everything from infotainment to autonomous driving, with 20 times more computing power than current systems. Added to this are headline-grabbing features: 800 kilometers of range and 350 km of charge in just 10 minutes.
BMW, however, does not manufacture its own batteries. Instead, it relies on Chinese giant CATL (SSE:300750), with whom it has developed new cylindrical cells that halve costs and increase energy density. Six gigafactories spread across China, Europe, and North America will guarantee supply.
Shift to E-Mobility
The shift toward electrification does not come without sacrifices. In 2024, the group saw its net profit fall 37%, to €7.68 billion, due to heavy spending on R&D. However, pure EV sales grew 13.5%, supporting the transition.
BMW benefits from structural reductions in battery production costs, a diversified portfolio supported by solid alliances that integrate electric, hybrid, and combustion models under the same digital platform, and a premium positioning that continues to attract loyal customers. The risk lies in massive spending eroding margins at a time when Tesla (Ticker AT:TSLA) and Chinese manufacturers like Xpeng (NYSE:XPEV) are advancing aggressively.
Technical Analysis
BMW shares on the Frankfurt Stock Exchange show a consolidation trend after a volatile 2024 marked by profit cuts. The current key support at €88.18 seems to be holding, while resistance lies between €88.85 and the unbroken highs of €91.72. This resistance has repeatedly pushed the stock back to support levels after each upward attempt. Breaking through current highs would open a path toward €110, and possibly new yearly highs, while a drop below support could shake investor confidence and push the stock toward the Point of Control (POC) around €86.60.
The 50, 100, and 200-day moving averages have contracted sharply over the past month, which could indicate declining confidence if confirmed. On the other hand, the RSI at 42.05% signals oversold conditions, while the MACD is negative but with a histogram turning positive—another possible signal of recovery. Lastly, the ActivTrades Europe Market Pulse indicator shows a contraction back to neutral territory, suggesting investors may be returning to support the market.
BMW (Ticker AT:BMW)
Trend: Bullish in the medium and long term, with potential lateralization or short-term reversal.
Resistance: Strong zone at the highs of €91.72.
Supports: Key levels between €88 and €88.50, with critical supports at €88.22, €88.18, POC €86.60, €85.18, €83.18, €81.60, and €79.70.
Point of Control (POC): €86.60.
Technical Conclusion: Recent sideways consolidation, with upside potential if the €91.50–91.72 zone is broken.
Tesla
Following political frictions between Elon Musk and Trump, Tesla’s stock has been recovering, moving sideways between May and August, with a slightly upward bias within the range of $361.93 to $291.37. A mid-range area has formed around the POC of $311.43, acting as support for the latest rally.
The RSI stands at 53.96%, a relatively neutral level, while the MACD remains neutral with a histogram gradually entering negative territory, pointing to a strong consolidation move. Meanwhile, the ActivTrades US Market Pulse indicates the American market is in extreme RISK-ON, suggesting potential adjustments due to excessive greed.
Tesla (Ticker AT:TSLA)
Current Trend: Short-term bullish recovery after weeks of lateral consolidation, with positive signs from regaining key moving averages.
Resistances: Strong resistance around $361.93, which could open the way toward $420, the next major level lost in February’s death cross.
Supports: Key support at the POC of $311.43, followed by $291.37, $274.75, and $225.58.
Technical Conclusion: Tesla is at a decisive range. A break above recent highs could trigger an upward move toward $420 or beyond. Conversely, a drop below $320 would increase bearish pressure, potentially driving the stock down to test $291.
Conclusion
The Neue Klasse is not just a product launch—it is BMW’s boldest and riskiest bet in decades. The German manufacturer wants to stop being solely a premium icon and transform into a fully-fledged tech player. Elon Musk no longer runs alone: the racetrack is filling up with rivals hungry for disruption.
*******************************************************************************************
The information provided does not constitute investment research. The material has not been prepared in accordance with the legal requirements designed to promote the independence of investment research and such should be considered a marketing communication.
All information has been prepared by ActivTrades ("AT"). The information does not contain a record of AT's prices, or an offer of or solicitation for a transaction in any financial instrument. No representation or warranty is given as to the accuracy or completeness of this information.
Any material provided does not have regard to the specific investment objective and financial situation of any person who may receive it. Past performance and forecasting are not a synonym of a reliable indicator of future performance. AT provides an execution-only service. Consequently, any person acting on the information provided does so at their own risk. Political risk is unpredictable. Central bank actions can vary. Platform tools do not guarantee success.

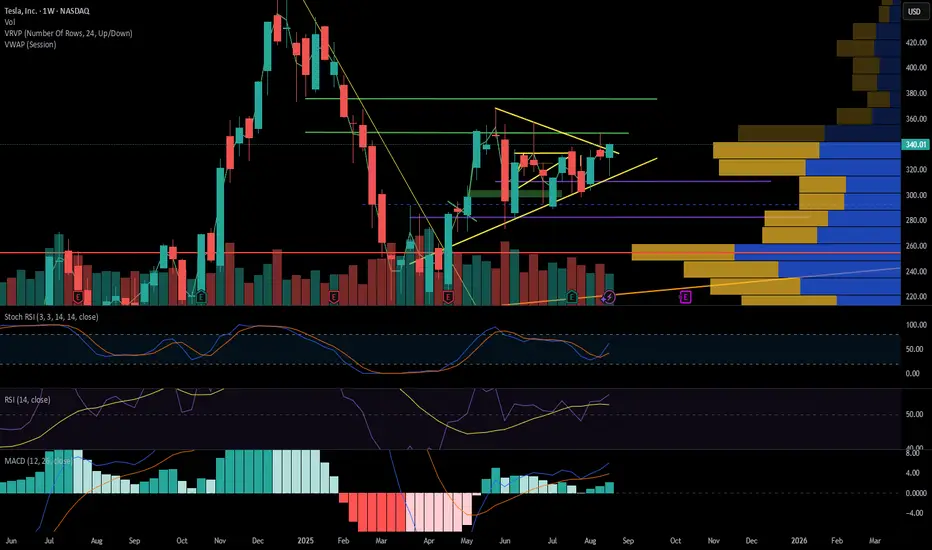
TSLA Creeping up from original triangle, but still in a larger tNASDAQ:TSLA continues to take the stairs of worry up to my trading signal target from the original triangle analysis, $386, but the pattern has morphed into what appears to be a barrier triangle now as price struggles at $360 with a series of higher lows.
RSI is comfortable at the EQ with room to grow while price remains above the daily pivot.
Analysis is invalidated below wave (C) $284
Safe trading
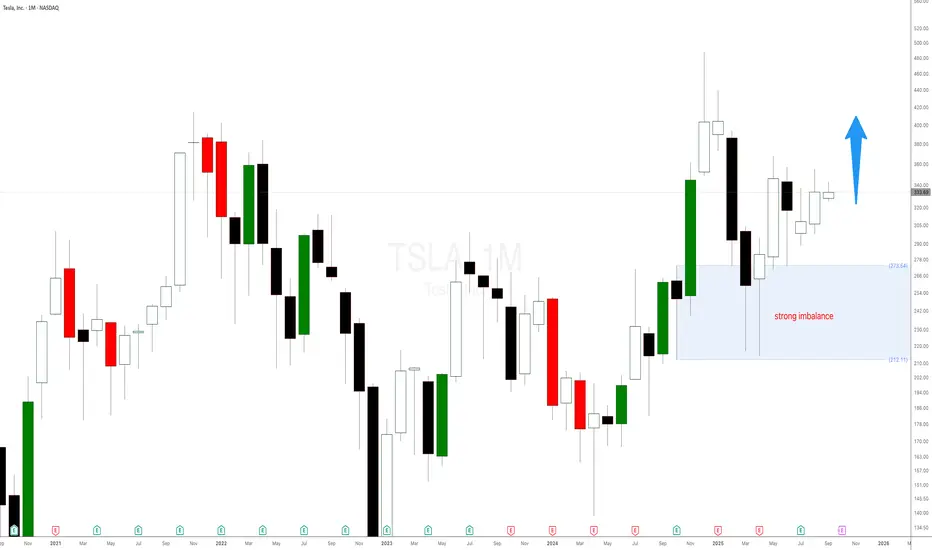
Tesla stock is printing new highs helped by the strong imbalanceTesla stock is printing new highs helped by the strong weekly imbalance as expected and mentioned in a previous Tesla stock analysis. The weekly demand level at $298 is playing out well. There is still a lot of room for NASDAQ:TSLA stock to keep on rallying. You can use the smaller timeframes to add more long positions or new imbalance to trade with even higher probability.
TSLA: 350 retestThe market is confused. Clarity is needed.
In the very short term $350 is clear. However, with plenty of resistance. Will likely chop, then rise of fall from there.
Long term the vision and execution remains supreme. Revenues will sky rocket, it's only a matter of time. From an investors perspective, I look to buy in times of extreme fear and oversold scenarios. I do nothing at these levels, but I like to stay alert with the price trends.

TSLA (daytrading) small tradeI already entered but didn’t post earlier because I was too busy. You guys can wait for a small pullback tomorrow. Take profit whenever you feel comfortable.
1. Bullish doji candle on the daily (D1).
2. Uptrend still intact on D1 and higher timeframes.
3. Retest of the 50 SMA on D1.
4. Price touched the trendline.
Plan: Buy call options at the closest strike price with expiry this week. Don’t forget to set a stop loss.

Investing in Tech Stocks: What Daxprime Investors Profited From The tech sector is once again in the spotlight. Despite fierce competition, rapidly shifting trends, and increasing regulation, technology stocks remained among the most profitable assets on the market in 2025.
The Daxprime team conducted an in-depth analysis of client portfolios, top-performing tech giants, and fast-growing startups. In this article, we reveal which stocks brought the biggest profits to Daxprime investors in 2025 — and the strategies that helped them grow their capital with minimal risk.
Tech Sector Overview in 2025
After strong growth in 2023–2024, tech stocks began 2025 with cautious recovery. Investor attention focused on:
Companies in artificial intelligence (AI)
Leaders in cloud computing and cybersecurity
Firms investing in microelectronics and neurotech
Startups rapidly capturing niches in automation and robotics
From January to the end of August 2025:
Nasdaq-100 grew +17.6%
XLK (Tech Select Sector SPDR) rose +14.8%
Individual stocks gained up to 70–90%
Top 5 Stocks That Generated the Most Profit for Daxprime Investors
1. NVIDIA (NVDA)
Growth (Jan–Aug 2025): +62%
Drivers: Soaring demand for AI chips, data centers, and autonomous driving
Clients profited from both price appreciation and short-term trades on earnings reports
2. Microsoft (MSFT)
Growth: +34%
Highlights: Expanding proprietary AI platforms, Azure cloud growth, strategic partnerships with OpenAI
MSFT served as a core holding in many Daxprime portfolios
3. Palantir Technologies (PLTR)
Growth: +85%
Strengths: Securing government contracts, SaaS expansion, aggressive growth in Europe
Considered medium-risk, high-potential
4. Supermicro (SMCI)
Growth: +91%
Role: Key AI infrastructure server provider
One of 2025’s “hidden champions”
5. Tesla (TSLA)
Growth: +29%
Catalysts: Launch of new EV models, global factory expansion
Still volatile, but favored for tactical/speculative strategies
Real Daxprime Investor Cases
Case 1: Aggressive Growth Strategy
Portfolio: 40% NVDA, 25% SMCI, 20% TSLA, 15% PLTR
Invested in January: $25,000
Value in August: $47,300
Return: +89.2%
Case 2: Moderate Approach
Portfolio: 50% MSFT, 30% NVDA, 20% AAPL
Invested: $50,000
Current value: $65,500
Return: +31%
Conclusion: Daxprime investors profit using both aggressive and balanced strategies — both work when built on quality analysis.
What Helped Investors Earn in 2025?
Timely portfolio rebalancing — shifting into AI leaders and out of underperforming sectors
Using earnings reports as entry points
AI-based analysis from Daxprime — trade signals, entry/exit timing
Investing in trends, not just “famous brands”
Risks and How They Were Managed
The tech sector remains volatile:
Supply chain disruptions can cause 10–20% drawdowns
Strong correlation with macro factors
Constant innovation leads to high competitive pressure
How Daxprime clients managed risk:
Diversifying between large caps and mid-caps
Holding defensive assets (e.g., ETFs, bonds)
Ongoing support from Daxprime analysts
Why Investors Choose Daxprime for Tech Stock Strategies
Access to real-time analytics on 500+ stocks
AI-powered entry/exit signals
Portfolio rebalancing tools
Personalized investment strategies
Access to IPOs and Pre-IPOs in the tech sector
Daxprime helps clients not just buy stocks, but build structured strategies that deliver profits — both in uptrends and sideways markets.
Conclusion
The year 2025 proved once again: technology companies are the engine of the stock market. Investors who bet on AI and cloud industry leaders — and adapted in time — earned substantial profits.
With Daxprime, you’re not just investing — you’re building a strategy where every step is based on data, experience, and smart decisions. That’s how you earn consistently while managing risk.

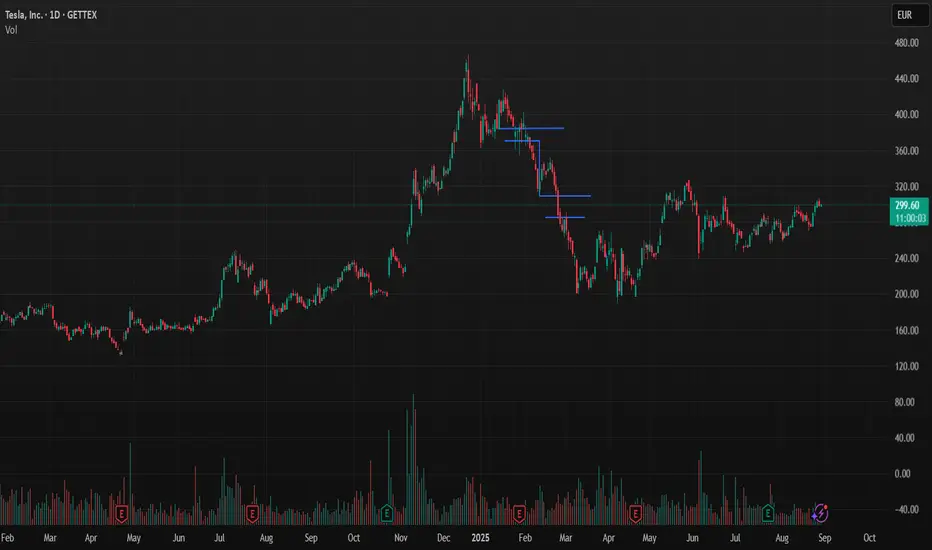
TESLA, pay attention to these numbers!!Despite the electric vehicle sector experiencing strong demand growth, with EV sales up 33.6% in July across the European market (source: Investing.com), Tesla appears to be struggling to keep up with the trend, posting a 40% drop in sales. In contrast, BYD continues to gain market share steadily.
Yet, Tesla is currently trading at a price that reflects an EPS multiple of 203.83x (with revenue growth expected to be -5.4% in 2025 and EPS falling by 12.1%) , an aggressive valuation that is difficult to justify given the company’s revenue has seen only modest growth over the past two years. This stagnation is largely due to weakening gross profit margins and broader macroeconomic headwinds that are weighing on performance. The current stock price still seems inflated by the momentum and hype generated by Tesla's strong performance up to 2022.
It is also worth noting that Elon Musk, during a key period, appeared to shift focus away from Tesla, impacting investor confidence and leadership credibility.
From a technical and statistical perspective, Tesla appears significantly overbought, with an estimated fair value that is 27.04% lower than the current price. On the chart, there’s a clear resistance zone between $346.04 and $351.22, and a support zone between $366.53 and $368.80.
(DISCLAIMER: The following is a personal opinion, not financial advice!!)
A potential short position in the coming days cannot be ruled out, with market reaction likely hinging on the earnings report due October 21. A stop-loss could be set around $368.80 (if the upward trend fails to confirm), with a take-profit range between $329.70 (200-day MA) and $302.00. An initial take-profit could be considered around $322.97, aligned with the 50-day moving average (MA50).
Let me know if you like the content and if you want give me a feedback!!
TSLA Volatility Contraction Pattern (VCP) LONG When TSLA breaks above 350 and closes, the price will launch to $390 very quickly.
A VCP is a technical pattern, showing lessening declines in a range bound formation. A bull flag showing higher-lows is the best, as seen with TSLA.
Volatility is going to breakout sharply to the upside. If you TSLA above 350 just buy and hold, you’re too late trying to get a better deal.
🚀🚀🚀🌖
#TSLA need some newsCorrect. Elon doesnt allow bears. Four hundred visible now. Some consolidation needed but how.

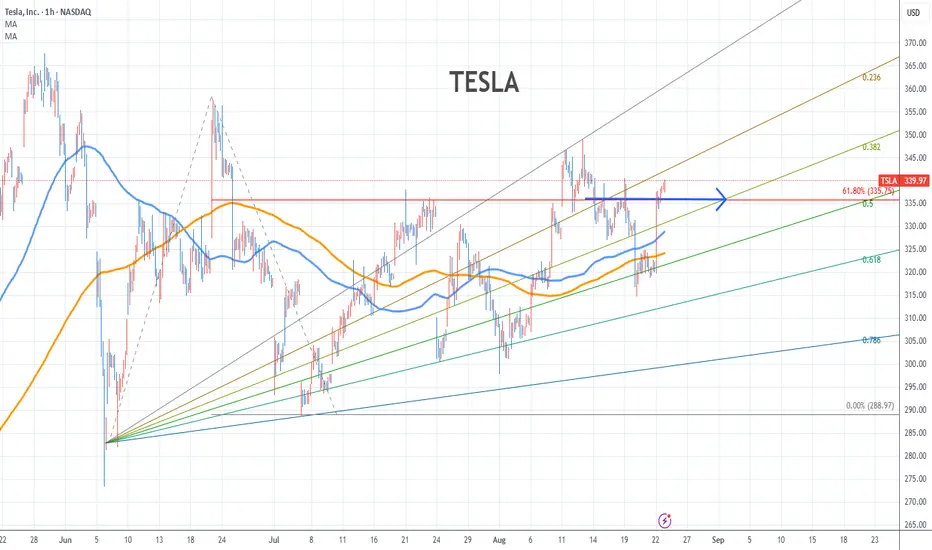
Tesla Stock Chart Fibonacci Analysis 082225Trading Idea
1) Find a FIBO slingshot
2) Check FIBO 61.80% level
3) Entry Point > 335/61.80%
Chart time frame:B
A) 15 min(1W-3M)
B) 1 hr(3M-6M)
C) 4 hr(6M-1year)
D) 1 day(1-3years)
Stock progress:C
A) Keep rising over 61.80% resistance
B) 61.80% resistance
C) 61.80% support
D) Hit the bottom
E) Hit the top
Stocks rise as they rise from support and fall from resistance. Our goal is to find a low support point and enter. It can be referred to as buying at the pullback point. The pullback point can be found with a Fibonacci extension of 61.80%. This is a step to find entry level. 1) Find a triangle (Fibonacci Speed Fan Line) that connects the high (resistance) and low (support) points of the stock in progress, where it is continuously expressed as a Slingshot, 2) and create a Fibonacci extension level for the first rising wave from the start point of slingshot pattern.
When the current price goes over 61.80% level , that can be a good entry point, especially if the SMA 100 and 200 curves are gathered together at 61.80%, it is a very good entry point.
As a great help, tradingview provides these Fibonacci speed fan lines and extension levels with ease. So if you use the Fibonacci fan line, the extension level, and the SMA 100/200 curve well, you can find an entry point for the stock market. At least you have to enter at this low point to avoid trading failure, and if you are skilled at entering this low point, with fibonacci6180 technique, your reading skill to chart will be greatly improved.
If you want to do day trading, please set the time frame to 5 minutes or 15 minutes, and you will see many of the low point of rising stocks.
If you want to prefer long term range trading, you can set the time frame to 1 hr or 1 day
$TSLA looks "Cheap" but it can always get cheaperTSLA has been consolidating in a flag here. While price could break up out of it, I actually lean towards price breaking to the downside. The reason is because there have been more tests on the downside, and I think if price falls and tests it again, it'll break.
That and, if you turn on Heikin Ashi candles, it looks like bearish momentum is starting on higher timeframes (1D-4D) and Ichimoku giving bearish warning signals in the cloud formation.
I think the most likely outcome is that we break lower and go test the box below for a new low. Everyone would get bearish down there, but that will be a great level to buy for the long term.

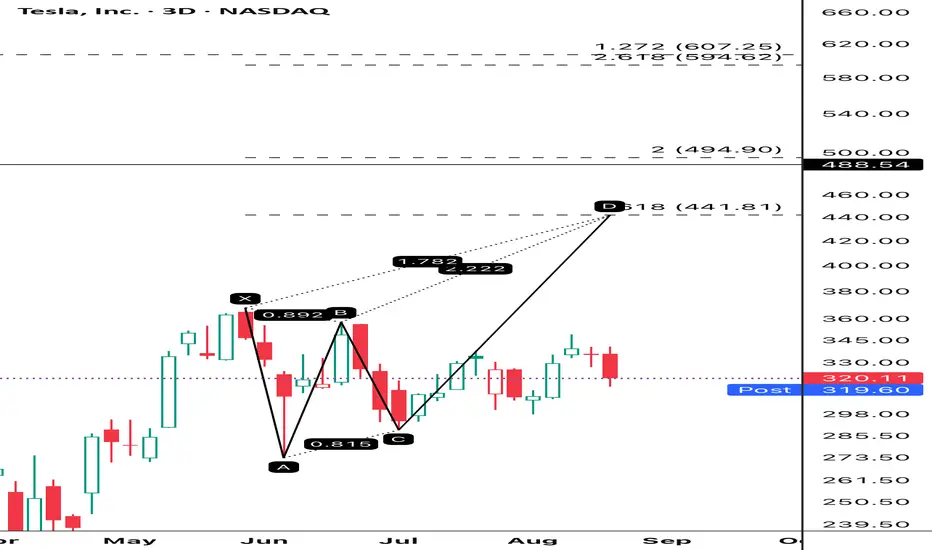
TSLA Is A BuyHello,
TSLA is showing a Deep Crab harmonic pattern.
Targets:
1) $450
2) $500
3) $550
4) $600
a flag breakout can be a bullish trade ideahere as per technical analysis , we can see several factor which can
aide a bullish take on TESLA stock on a very short term time frame .
1) pole and flag
2) prices above 20 Day sma ( h)
3) monthly pivot ( traditional ) crossover upside
Pole and flag : a pole and flag which has a decreasing volume during the flag formation , and not having much of retracement , aides the bullish view here
20 DSMA :till the time prices are above the 20 day sma (high) , we can keep our bullish trade intact ,
Pivot level monthly : recently the stock has crossed over monthly pivot level ( traditional ) , in an assuring manner
prices forming a floor above floor structure , where the prices are showing their initial motive towards upside , and then correcting in a slow manner in a retracement manner . a good time has been spent in the shadow of the impulsive motive ( upside ) , which creates a stronger base for the prices and shows no major selling has been happening here , and the profit booked at the higher levels are being bought out again ( re-entry into the market )
break of structure , the lesser candles demand zone which actually created a break of strcuture was respected recently ,
action plan , as soon as the flag pattern is breached on the upside , with a good volume candle , one can have a bullish entry here .
stoploss level at 330 , target price : 15% after the breakout of the flag.

TSLA: WAVE CTSLA has been consolidating within a range since early June and is expected to breakout over the next few weeks. As the markets are due to end a minor wave 4, the final wave 5 should allow TSLA to breakout out to the upside to a potential target of $422.
