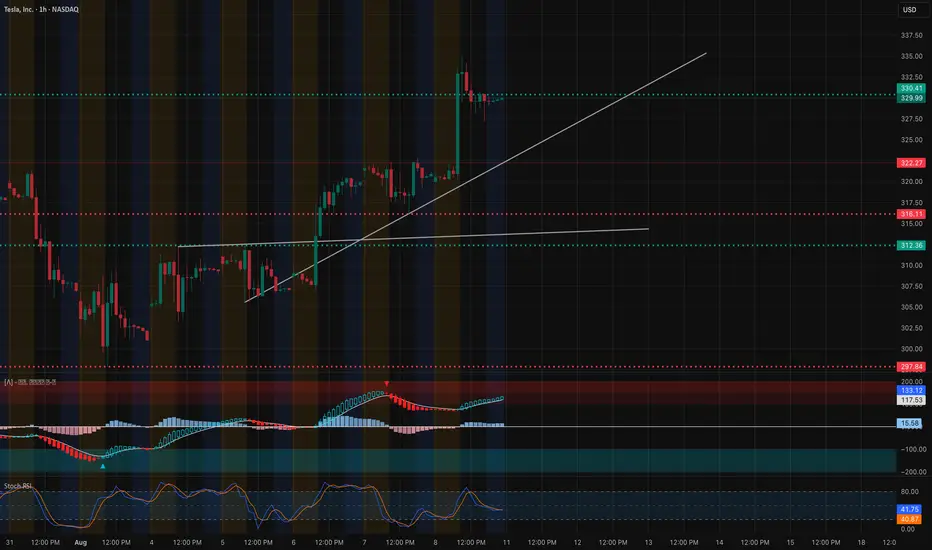
TSLA — Holding Momentum at Critical Levels. Aug. 11TSLA — Holding Momentum at Critical Levels: Can Bulls Push Through? 🚀
Technical Analysis (1H Chart)
TSLA has maintained a steady uptrend, respecting the rising trendline support from early August. The recent breakout above 325 pushed price into the 330–335 resistance zone, which aligns with a prior supply level and the high from earlier this month. Momentum indicators are still favoring bulls — MACD histogram remains positive and Stoch RSI is curling up from mid-range, hinting at potential continuation if price sustains above 330.41.
Immediate support is at 325 trendline confluence; a breakdown here could lead to a retest of 322.27 and deeper support at 316.11. Holding above 330 keeps the bullish bias intact with room toward 337–340 as the next technical target.
GEX / Options Sentiment
* Key Resistance (Calls / Gamma Walls):
* 335.00 → Highest positive NetGEX & major call wall resistance.
* 345.00 → GEX7 (47.48%), secondary upside barrier.
* 370.00 → GEX10 extreme bullish zone, unlikely without strong catalyst.
* Support (Puts / HVL Zones):
* 321.28 → HVL & strong support cluster.
* 310.00 → First PUT wall; loss here would open downside toward 300.
* 300.00 → Major PUT support (-16.97%), key bear target if breakdown occurs.
* Sentiment: Calls outweigh puts at 48.8%, IVR is low at 4.7 (cheap options), suggesting directional plays could be favored over premium selling.
Trade Thoughts:
* Bullish Scenario: Hold above 330.41 → Targets 335 then 345. Use 325 trendline as stop guide.
* Bearish Scenario: Break below 325 trendline → Targets 322.27 and 316.11, with possible extension toward 310.
* Options Angle: Low IVR supports debit strategies (buying calls/verticals) for bullish bias. Put spreads may work if breakdown starts below 325 with momentum confirmation.
Disclaimer: This analysis is for educational purposes only and does not constitute financial advice. Always do your own research and manage risk accordingly.
TSLAN trade ideas
TSLA - Larg Cap Gappers State 1 – In-depth Analysis of the Metric Table (TSLA)
Symbol: TSLA – Tesla, Inc.
Exchange: NASDAQ
Index Affiliation: Component of NASDAQ-100 (NDX) and S&P 500; highly liquid, large-cap with global market influence.---
1. Role of the Metric Table
The Metric Table compiles TSLA’s market stats, momentum conditions, volatility profile, and breakout readiness into one quick-reference tool. It enables traders to:
Confirm whether current price action supports momentum trading or requires patience.
Evaluate upside potential and downside protection zones.
Align entries with multi-timeframe trend structure.---
2. Key Data Group Insights
A. Core Stock Data
Auto Cap: Big Cap.
Market Cap: $879.48B – heavyweight market influence.
Volume: 92.1M – very high liquidity.
Public Float: 2.712B shares – large, requiring strong catalysts for outsized moves.
Leverage Multiplier: 0.03 – low natural leverage.
B. Momentum & Price Action
Pump % / Price Δ: +13.36% / +22.99% in recent rallies.
Prev Close / Now: $322.77 / $330.11 – current bullish bias.
Explosive Ratio (10d): 0.12 – moderate short-term move potential.
Natural Leverage (Now): 0.11 – stable for a large cap.
C. Technical Signals
Momentum Signal: Moderate Momentum – trending upward but not yet at breakout acceleration.
Beta Signal: Low Volatility – relatively stable compared to high-beta stocks.
Price Range Signal: Low Volatility – consolidation setting up for next move.
D. Risk Control Metrics
Estimated Stop Loss: $307 (H4) / $305 (1D).
Breakout Ready: L3 – nearing breakout alignment.
Trend Trigger: Levels in sequence for continuation if resistance is cleared.
E. Overall Status
Bull Momentum: YES.
Overall Signal: Excellent (Very Bullish).
Market Phase: Sideways consolidation within broader uptrend.---
State 2 – Risk Management & Trade Structure (TSLA)
Trading Style: Swing breakout strategy, large-cap momentum.
Share Size Scenario: Adjustable based on account size; risk per share determined by SL placement.---
1. Key Entry & Risk Zone
Setup Trigger Zone: $319 – optimal entry on pullback confirmation.
Capital Defense Line: $307 – hard stop for swing positions.
Smart Trailing Guard: $296 – deeper volatility cushion for longer holds.---
2. Breakout Targets
TP1 – Momentum Hold: $342 – first upside checkpoint.
TP2 – Intensity Zone: $353 – major resistance test.
TP3 – Breakout Shift Zone: $365 – aggressive swing target.
Max Exhaustion Limit: $391 – extended run potential on strong momentum.---
3. Trailing Stop Strategy
Entry at $319–$322:
After TP1 → move SL to breakeven.
After TP2 → secure 50% gains, trail remainder under prior 2–3 H1 lows.
If momentum continues into TP3/Max → tighten trailing to 15-min chart for profit lock.---
4. Timeframe Plan
Risk Direction: 4H chart for swing bias.
Entry Confirmation: 10-sec close rule on breakout/pullback candles.
Exit:
Short-term profit lock → 15-min chart.
Extended move → 1H trailing.---
5. Position Management
Size positions so that risk from entry to SL = 1–2% of account equity.
Take partial profits at TP1 & TP2 to secure gains and reduce exposure before major resistance zones.---
Disclaimer
ALGTP Watchlist is for educational purposes only, demonstrating trade setups and risk plans using ALGTP Indicators.
Members must have trading experience and know how to apply ALGTP Indicators.
Without ALGTP tools, traders must self-manage risk.
Not a buy/sell recommendation.

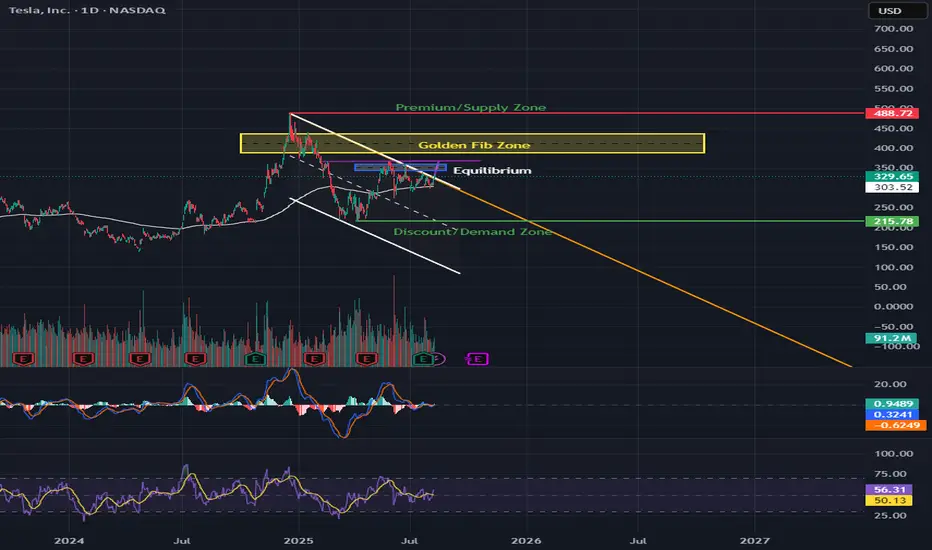
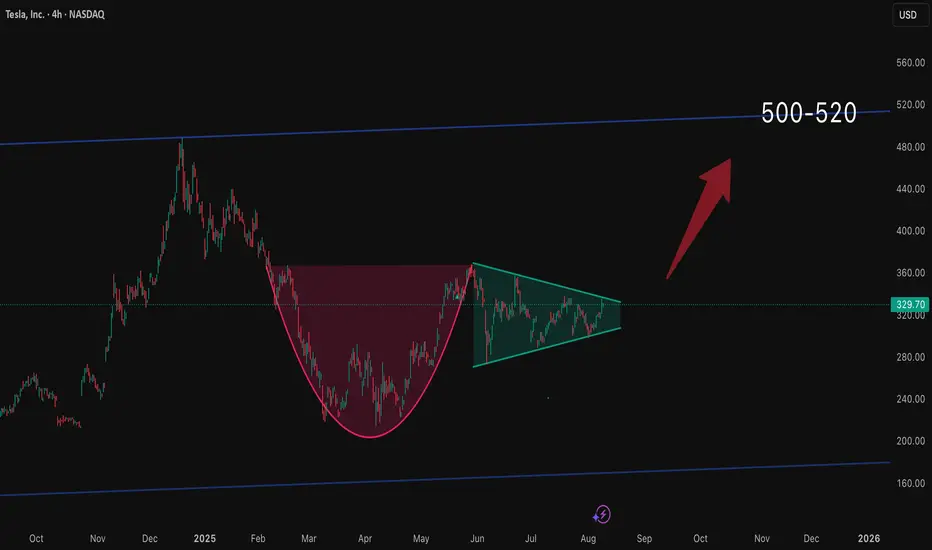
TSLA Golden Zone Test: Cup & Handle Breakout Ahead?📊 Market Breakdown
TSLA is trading at $329.65 and is caught between major zones — the Golden Fib Zone ($365–$385) above and the Equilibrium ($294) below.
Trend: Price recently broke out of a descending trendline but is still inside a bigger channel.
Pattern Watch: There’s a potential cup & handle forming. If confirmed, this could be the fuel that launches us toward the $365–$385 resistance area.
Momentum: MACD is flattening near zero (possible bullish crossover brewing), and RSI at 56 gives us room to push higher before overbought territory.
🛒 CALLS (Bullish Scenario)
Buy Zones:
🎯 Aggressive Entry: Bounce from $320–$325 support
✅ Confirmation Entry: Daily close above $340 with strong volume
Take Profits:
1️⃣ $365 – First target at the start of Golden Fib Zone
2️⃣ $385 – Fib Zone top and key resistance
3️⃣ $488 – Long-term premium/supply zone
Stop-Loss: $315 (just below recent support)
Why This Works: A breakout above $340 also breaks the handle of the cup, unlocking room to run toward $365+.
🛑 PUTS (Bearish Scenario)
Sell Zones:
🚨 Rejects $340 resistance with heavy selling
📉 Breakdown and daily close under $315
Take Profits:
1️⃣ $294 – Equilibrium
2️⃣ $250 – Key psychological level
3️⃣ $215–$220 – Discount/Demand Zone
Stop-Loss: $330 (above rejection point)
Why This Works: A failed breakout with a close under $315 breaks short-term bullish structure, opening the door for a drop back toward $294 equilibrium.
🔍 Technical Highlights
Cup & Handle Potential: Neckline around $340; break = bullish continuation.
EMA 200 ($219.82): Still far below, showing this is more of a swing/mid-term momentum play.
Volume: Recent spikes suggest institutions are active at these levels.
Macro Watch: TSLA moves with tech sentiment; keep an eye on NASDAQ trend.
⏳ Option Expiration Strategy:
1 Week: For quick bounce or rejection plays at $340
2 Weeks: Breakout targeting $365
3 Weeks: Full push toward $385–$488 supply zone
TESLA What Next? SELL!
My dear friends,
My technical analysis for TESLA is below:
The market is trading on 329.70 pivot level.
Bias - Bearish
Technical Indicators: Both Super Trend & Pivot HL indicate a highly probable Bearish continuation.
Target - 319.77
Recommended Stop Loss - 335.01
About Used Indicators:
A pivot point is a technical analysis indicator, or calculations, used to determine the overall trend of the market over different time frames.
Disclosure: I am part of Trade Nation's Influencer program and receive a monthly fee for using their TradingView charts in my analysis.
———————————
WISH YOU ALL LUCK

Tesla Roadmap: From $300 Zone to $575Hello traders, here’s my latest analysis on Tesla (TSLA) based on the weekly and daily timeframes. On the weekly chart, I have drawn a downtrend line starting from December 2024, and the recent price action shows a breakout above this line on a weekly close. This breakout is a promising sign that an uptrend may be developing in the medium term.
On the daily chart, we can see a cup & handle pattern forming, which is a bullish continuation structure. However, the daily downtrend drawn from the December 2024 highs remains unbroken, so I will need to see a weekly close above the $332 resistance level to confirm a swing long setup.
My preferred positioning zone for longs is between $300 and $350, using a multi-entry approach to average into the trade. My upside targets are $366, $445, $500, and finally $575. These levels align with inverse Fibonacci projections, with “safety 1” at $360 and “0” at $227, pointing toward the 161, 200, and 261 extensions as key objectives.
For stop-loss placement, patient traders who are willing to hold through volatility may consider a weekly close below $265 as their invalidation point. For faster or more short-term oriented traders, a weekly close below $300 could be used as a tighter stop level. Although I believe it is unlikely for price to drop this far, even if it does, I expect strong buying interest and a potential rebound from the $265 support zone.
Risk management remains crucial for this setup. I recommend not risking more than 10% of your capital, scaling in over multiple entries, and always confirming with your own strategy before committing to the trade. Position sizing and discipline will be key to managing volatility and protecting capital.
NASDAQ:TSLA
$TSLA 3rd Time's a CharmI bottom called NASDAQ:TSLA twice in a row. About to do it a third time today. 312.5C 8/8 @ 4.47 were just bought for $1.3 million.
Is the wait over?Time to rise and shine off the couch? Cup and handle will hopefully be complete soon.
Preferably want to see the price above 370 for it to be valid.
But already at 340 it’s a mini buy signal.
We’ll see what the future brings us.
☀️🫶
TESLA: Expecting Bearish Movement! Here is Why:
Balance of buyers and sellers on the TESLA pair, that is best felt when all the timeframes are analyzed properly is shifting in favor of the sellers, therefore is it only natural that we go short on the pair.
Disclosure: I am part of Trade Nation's Influencer program and receive a monthly fee for using their TradingView charts in my analysis.
❤️ Please, support our work with like & comment! ❤️
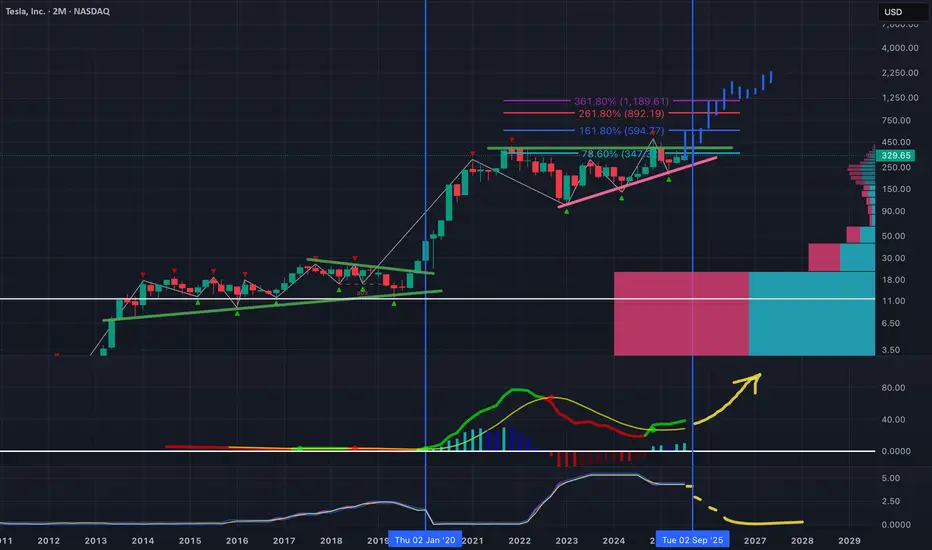
$TSLA - High CAGR Strikes againTesla’s long-term bullish structure remains intact on the 2-month logarithmic chart, with price breaking out of a two-year ascending triangle capped near $350. This move tests the 78.6% retracement level at $347, opening the door to Fibonacci extension targets at approximately $595, $892, and $1,189 if momentum follows through.
The volume profile highlights strong historical support in the $180–$250 range, a key zone to defend on any pullback. Notably, the macro backdrop adds a tailwind — the last significant Fed rate cut in early 2020 coincided with Tesla’s parabolic advance, and the next major cut is projected for late 2025.
Long-term momentum indicators are turning higher, suggesting the early phase of a new bullish cycle. A sustained hold above $300 on any retest would reinforce the breakout, while a drop back under $280 risks a move toward $200–$220.
I wouldn't want to be short long term.
TSLA is looking ready for breakout NASDAQ:TSLA is making higher lows, looks like getting ready to be a rocket. keep an eye on 340 break and retest.
TESLA ABC Trap ZoneTesla’s price action has been exhibiting a period of consolidation characterized by lateral movement, forming a pattern commonly identified as a triangular structure. Triangular formations, by their nature, have the potential to break out in either direction—upward or downward—depending on market dynamics. However, my focus is particularly on recognizing this pattern within the context of an Elliot Wave ABC corrective structure.
Specifically, the second wave in this sequence appears to manifest as a triangle, suggesting a phase of market indecision and consolidation. This phase is typically followed by a final impulsive move downward, which would serve to complete the overall corrective pattern. Understanding this sequence is critical, as it provides insight into the potential continuation or reversal of Tesla’s price trend after the correction concludes.

TESAL HEADING TO $500+ RANGE ANALYSIS HERE Afternoon Trading Fam
So here is our in-depth look at Tesla: Currently the monthly trend is bullish giving us levels of $500 and above.
Locally though we can break this $338 top expect to see $444 and $480 getting hit next
If we need to correct and we break the lows of $319 expect to see the levels of $307 then $301 being hit
Happy Trading
Trade Smarter Live Better
Kris

Trading TSLA1:39 am 8/8/25Bullish Entry: 324.00 / 328.00 Bullish Stop 330.00 Bullish Target 330.00
Bearish Entry: 318.00 / 316.00 Bearish Stop 321.50 Bearish Target 312.00.....................Note: Supply zone 335.50/338.00

TSLA nearing breakout TSLA’s been winding tighter for weeks, and we’re finally pressing right up against the top of this symmetrical triangle on the 4H chart. Sitting at $333 price level after breaking out of that $315 area with some momentum behind it. Volume’s picking up, RSI’s pushing north of midline, and the MACD just flipped bullish.
If we can get a clean break and hold above that $335–$340 range, there’s room to stretch toward $367–$370, basically a retest of those June highs. But if we get rejected here, we probably stay stuck in this coil a bit longer. This is one of those decision point moments for TSLA where the next few candles could tell the story.

TSLA LONGQuite a simple set up. Confirmation is still needed on 3d, and daily. Bullish candles and volume is desperately needed for validation of symmetrical setup.
Volatility incoming. Break of ATH with strength leads to price discovery into $500+.

Tesla - The all time high breakout!🚗Tesla ( NASDAQ:TSLA ) will break out soon:
🔎Analysis summary:
For the past five years Tesla has overall been consolidating between support and resistance. But following the recent bullish break and retest, bulls are slowly taking over control. It is actually quite likely that Tesla will soon break above the previous all time highs.
📝Levels to watch:
$400
🙏🏻#LONGTERMVISION
SwingTraderPhil

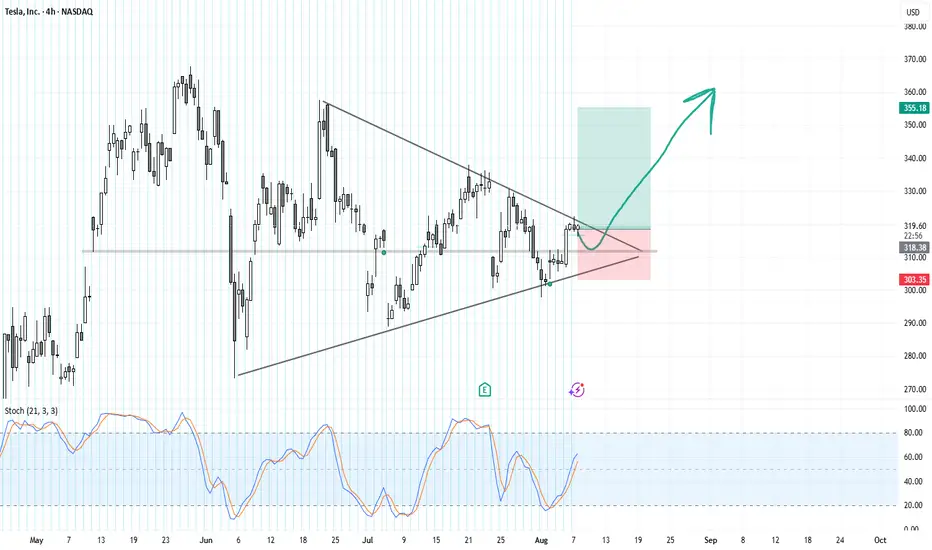
TSLABased on the provided 4-hour chart of TSLA, here is a brief summary and outlook.
Tesla's stock price has been consolidating within a symmetrical triangle pattern since late May. The price is currently trading near the upper boundary of this triangle, which is a critical resistance level. The stochastic indicator is showing a bullish crossover and is trending upwards, but it is not yet in the overbought territory.
The chart presents two potential scenarios for the immediate future. A bullish breakout (green arrow) would occur if the price successfully breaks above the upper trendline and the resistance around $320. This could lead to a significant move towards the next target, potentially around $355, as indicated by the length of the triangle's base. Conversely, a bearish scenario (red shaded area) would see the price fail to break out and instead fall back towards the lower support trendline, possibly testing the support level around $303.
The key to the next move is a decisive breakout from the current pattern. Traders should monitor for a clear break above or below the trendlines with increased volume to confirm the direction. A successful breakout to the upside would signal a continuation of the previous uptrend, while a breakdown to the downside would suggest a potential bearish reversal. The support and resistance levels marked on the chart are key reference points for managing risk and setting targets.
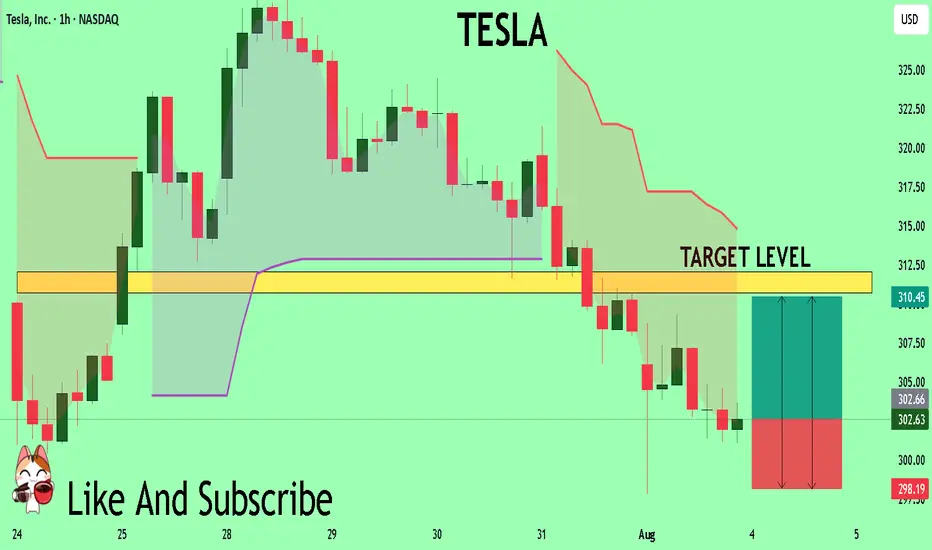
TESLA Sellers In Panic! BUY!
My dear friends,
TESLA looks like it will make a good move, and here are the details:
The market is trading on 302.63 pivot level.
Bias - Bullish
Technical Indicators: Supper Trend generates a clear long signal while Pivot Point HL is currently determining the overall Bullish trend of the market.
Goal - 310.73
Recommended Stop Loss - 298.19
About Used Indicators:
Pivot points are a great way to identify areas of support and resistance, but they work best when combined with other kinds of technical analysis
Disclosure: I am part of Trade Nation's Influencer program and receive a monthly fee for using their TradingView charts in my analysis.
———————————
WISH YOU ALL LUCK
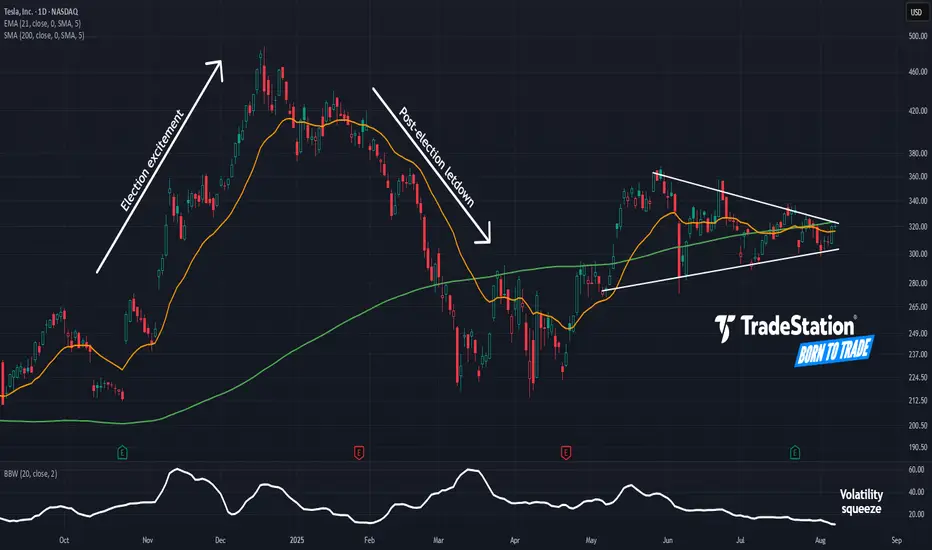
Tight Squeeze in TeslaTesla rallied sharply in late 2024, followed by a drop in the first quarter. Now, after a long period of consolidation, some traders may think the EV maker is getting ready to move again.
The first pattern on today’s chart is the series of higher lows and lower highs since May. That converging triangle may give TSLA breakout potential.
Second, Bollinger Bandwidth has squeezed to a 13-month low. Will that price compression give way to expansion?
Third, the rising 200-day simple moving average may suggest a longer-term uptrend remains in effect.
Next, prices are trying to push above the 21-day exponential moving average. That may be consistent with increasing bullishness in the short term.
Finally, TSLA is a highly active underlier in the options market. (Its average daily volume of 2.3 million contracts ranks behind only Nvidia in the S&P 500, according to TradeStation data.) That may help traders take positions with calls and puts.
TradeStation has, for decades, advanced the trading industry, providing access to stocks, options and futures. If you're born to trade, we could be for you. See our Overview for more.
Past performance, whether actual or indicated by historical tests of strategies, is no guarantee of future performance or success. There is a possibility that you may sustain a loss equal to or greater than your entire investment regardless of which asset class you trade (equities, options or futures); therefore, you should not invest or risk money that you cannot afford to lose. Online trading is not suitable for all investors. View the document titled Characteristics and Risks of Standardized Options at www.TradeStation.com . Before trading any asset class, customers must read the relevant risk disclosure statements on www.TradeStation.com . System access and trade placement and execution may be delayed or fail due to market volatility and volume, quote delays, system and software errors, Internet traffic, outages and other factors.
Securities and futures trading is offered to self-directed customers by TradeStation Securities, Inc., a broker-dealer registered with the Securities and Exchange Commission and a futures commission merchant licensed with the Commodity Futures Trading Commission). TradeStation Securities is a member of the Financial Industry Regulatory Authority, the National Futures Association, and a number of exchanges.
Options trading is not suitable for all investors. Your TradeStation Securities’ account application to trade options will be considered and approved or disapproved based on all relevant factors, including your trading experience. See www.TradeStation.com . Visit www.TradeStation.com for full details on the costs and fees associated with options.
Margin trading involves risks, and it is important that you fully understand those risks before trading on margin. The Margin Disclosure Statement outlines many of those risks, including that you can lose more funds than you deposit in your margin account; your brokerage firm can force the sale of securities in your account; your brokerage firm can sell your securities without contacting you; and you are not entitled to an extension of time on a margin call. Review the Margin Disclosure Statement at www.TradeStation.com .
TradeStation Securities, Inc. and TradeStation Technologies, Inc. are each wholly owned subsidiaries of TradeStation Group, Inc., both operating, and providing products and services, under the TradeStation brand and trademark. When applying for, or purchasing, accounts, subscriptions, products and services, it is important that you know which company you will be dealing with. Visit www.TradeStation.com for further important information explaining what this means.
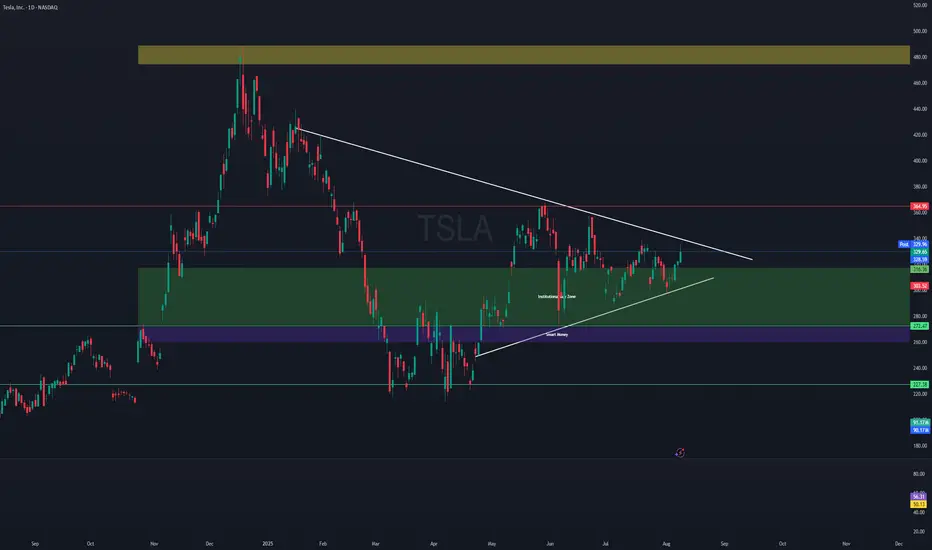
Tesla Breakout? For the majority of the calendar year TESLA has been in a range between $220 - $365 with a clear midpoint of $295.
From March to the beginning of May TESLA bounced between range low and the midpoint until finally breaking through into the upper half of the range where it has stayed ever since. However, there is a clear diagonal resistance level that is preventing higher highs.
So will TESLA breakout, or will it lose the midpoint? Structurally it is clear that the bulls have a set level they are happy to buy at (Midpoint) but the bears are getting more aggressive with their selling, hence the lower highs. This compression inevitably leads to an impulse move but the direction is not so clear.
Bullish scenario: A clean breakout with volume that makes a new higher high, signaling a shift in structure. A pullback and retest of the breakout would be an ideal opportunity to go long and aim for that range high before expecting resistance.
Bearish scenario: The lower highs keep printing until the midpoint is lost and price accepts below it, that would then signify to me the new trading range is between Range Low and Midpoint.
The fakeout scenario is a risk but with price so close to the midpoint already it follows the same invalidation criteria as the bullish scenario, the midpoint is vital to both sides.

Tesla Stock Gains After Musk Gets $30 Billion Award — What Now?Tesla board is hoping that the pile of shares would be enough to pin down the CEO and lock down his focus. But challenges are there. Here’s one — $30 billion might not be enough to keep Musk around.
💰 $30 Billion Retention Bonus
Tesla stock NASDAQ:TSLA is up about 4% since the start of the week after the board of directors handed Elon Musk a gift-wrapped, legally-contingent $30 billion stock package .
What’s inside? A cool 96 million shares — nearly enough to buy a small country or, at the very least, keep Musk’s wandering focus in the Tesla lane.
In a letter to shareholders, the board didn’t mince words: “We are confident that this award will incentivize Elon to remain at Tesla. Retaining Elon is more important than ever.” Translation: “Please don’t leave, here’s money.”
This isn’t just about stock awards or executive compensation. It’s about bringing back lost focus and whether the most famous CEO on the planet can be convinced to stop juggling a handful of companies and pay full attention (ok, more attention) to the one that’s public, highly volatile, and still kinda trying to figure out self-driving and robotaxis .
🎢 If the Stock Could Talk
The market’s response? Pretty bullish. Traders seem to like the idea of Musk staying inside the Tesla factory gates — or at least not moonlighting in so many side quests.
After all, Elon’s presence — erratic tweets, spontaneous product reveals, and all — is a core part of Tesla’s brand value. The stock has often behaved more like a crypto coin than a traditional automaker.
Musk already owns over 400 million shares, around 13% of Tesla, worth roughly $125 billion. But he’s gunning for more: his long-stated ambition is 25% voting control (equal to $250 billion in shares based on the current $1 trillion market valuation. This new package edges him closer to that goal. If he can’t own a country, a quarter of Tesla might do.
⚖️ A Legal Complication Worth $56 Billion
There’s one tiny footnote here: if Elon wins back his 2018 $56 billion pay package — the one struck down by a Delaware court — he might have to forfeit this new batch.
So yes, Tesla may have just given the richest man in the world a “Plan B” golden parachute. Or a “Plan A” depending on how Delaware judges are feeling when they decide on it.
🤖 AI, Robots, and Attention Deficits
Let’s not forget what lit the fire under this latest move. Back in January, Elon posted on X that he was “uncomfortable growing Tesla to be a leader in AI & robotics” without more control. It was a public shakedown — and apparently it worked.
Tesla’s ambitious AI goals — full self-driving software, Optimus the humanoid robot, and a suite of other sci-fi-sounding visions and promises — are largely tied to Musk’s personal involvement. Investors know that without him, these projects could end up shelved… or sold to xAI, his other pet project and owner of X (former Twitter).
🧮 The Math of Mega-Pay
Tesla says the accounting value of the package — after subtracting what Musk would have to pay to exercise the options and adjusting for restrictions — sits at about $23.7 billion. That's about the GDP of Malta and only slightly smaller than the SEC’s collective headache every time Musk tweets.
In return, Musk has to stick around for five years — or at least not officially leave. The board hopes that’s enough to keep him engaged. But the question is: How much is enough to counteract everything else going on?
The man’s worth $350 billion to $400 billion (depending on volatility) and if he wants to build Martian houses or dig tunnels under Paris, a few billion dollars aren’t going to make a difference.
🔀 A Shifting CEO, A Shaky Business?
It’s not just about Elon’s attention span. Tesla’s business hasn’t exactly been smooth sailing. The EV market is more crowded than ever. Sales are dropping in Europe. Tariff threats are buzzing in the background.
On top of that, it’s the earnings season and the Earnings calendar is hot to the touch. In recent quarters, Elon’s perceived absence from the factories have coincided with slumping revenue and nervous investors.
Add in the fact that Elon just exited the Trump administration after a brief stint and dramatic fallout — yes, that happened — and Tesla investors are understandably hoping for a little more focus in the months ahead. Not to mention his new Washington gig — his “America party” political party .
🚗 Is Tesla Still a Growth Story?
Tesla is still the largest EV maker in the US, but the shine has worn off a bit. The Cybertruck’s still not mainstream, Model 3s are getting old, and margins are being squeezed by global competition and pricing wars.
If Musk is serious about staying and building, this could be Tesla’s opportunity to pivot — from hype-driven volatility to sustained, AI-powered growth. But if not, well... there’s SpaceX. Or xAI. Or Neuralink. Or The Boring Company. Or the next startup he tweets into existence.
Off to you : Do you feel like Tesla is paying Elon to stay interested — or rewarding him for prior (and future?) performance. And is that the way to buy loyalty and dedication? Share your thoughts in the comments!

TSLA is READY to MOONNASDAQ:TSLA NASDAQ:QQQ AMEX:SPY
The bull flag is setting up beautifully.
The demand zones are holding up.
If it can break the supply, POC, and the trendline resistance above, it can easily reach the opening gap above at $400.
I'm buying the next leg up!

TSLA pivot points suggesting imminent breakoutTSLA is in a tightening pattern, which can of course break either bullish or bearish. given the overall trend and market conditions, I have a bullish lean on it. After doing some pivot point analysis this evening I have shifted the bull break odds even higher in my mind, and not only that, I believe the bull break may be imminent this week.
