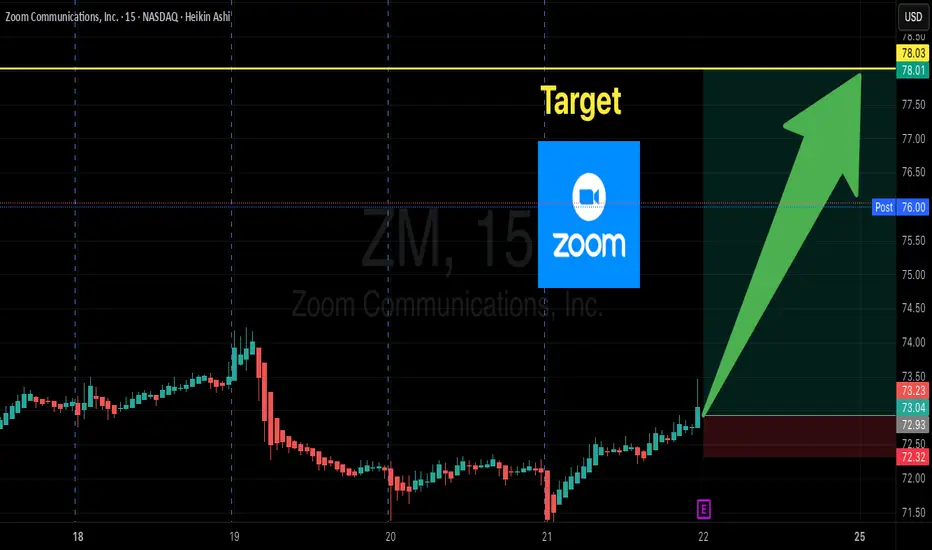
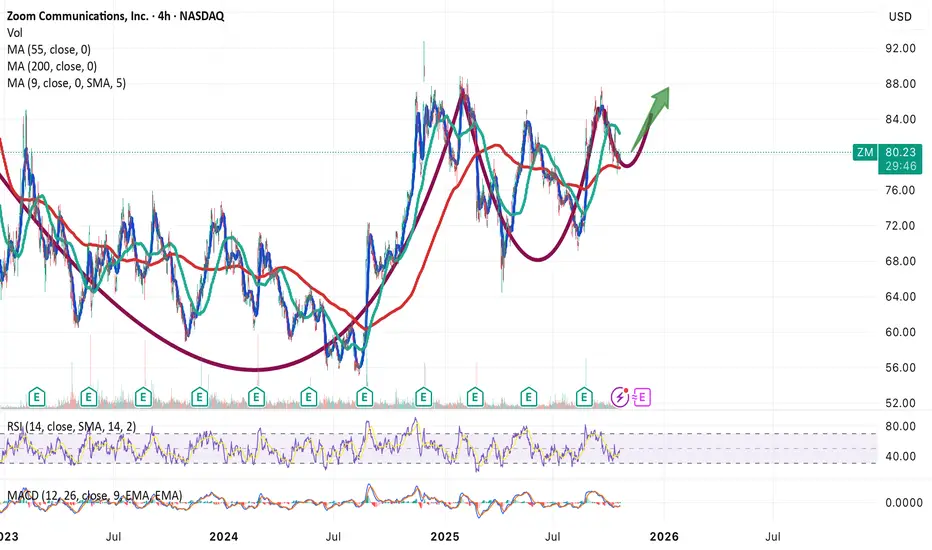
Zoom (ZM) - The comeback nobody asked for.. but might happenRemember Zoom?
The company everyone panic bought during the lockdown, then abandoned faster than a New Year’s gym membership. Well... it’s back. Sort of. Maybe. Because for the first time in years, the chart prints something that looks suspiciously like “Bullish structure”. Let’s put it under the microscope.
The technicals
Price action has spent the last three years in a de-sending resistance channel, bouncing down like a stressed out toddler in a soft play centre. But now? Breakout.. the toddler has escaped and Mum has not given a 2nd thought as to why it’s quiet all of a sudden. (No Chat GPT did not write that. Many readers have a Planck’s length attention span, and your interest needs to be stimulated now and again).
A breakout has printed, clear.. clean and confirmed.
Resistance has now become support (Finally)
Two key resistance levels, market structure resistance and the post COVID collapse supply wall, have confirmed support. The US department of defence may soon have an alternative to Signal groups.
Give your special attention to the 5 month chart below with a close above past resistance. Bitcoin maxis would love to see a chart like that, expect today’s candle has the wrong colour and points the wrong direction ;-) Incidentally the last time a candle like that printed on Bitcoin price action was a $9600.
5 month chart of Zoooooom
RSI breakout from 3 year downtrend
This is the big one. RSI has finally broken above the diagonal resistance that has suppressed momentum since its all time highs. Historically for Zoom, when RSI breaks out on and above 55, great things happen. A multi month momentum rally follows.
A simple target
The nearest significant resistance sits around $350-360, which also aligns with the midpoint of the massive November 2020 breakdown. From current price, that’s roughly a 320% upside. Okay, it's not dizzy heights, but for those of us that understand compound returns, you know this is a first step of many, not just one.
Conclusions
Zoom has finally escaped the three year gravity well that crushed it after the COVID mania. RSI breakout, structure flip, and a multi-year descending channel rejection together paint the most optimistic picture since 2020. Will it run +320% to retest old resistance?
it might. Will influencers arrive pretending they “always knew Zoom was undervalued”? Absolutely.
Will most people ignore the cleanest setup the stock has printed in half a decade? Also yes.
But chart don’t lie. And right now, Zoom is whispering: “I’m not dead yet.”
Ww
Disclaimer
===========================
This isn’t financial advice, obviously. Still carts to horses, a comment a year from now will read “but you advised us...”, If you buy zoom because a bloke on the internet drew a few blue rectangle and said “breakout”, without due diligence, that’s on you.
If it moon, you’ll claim you’re a genius.
If it dumps, you’ll write me angry messages.
Either way, I’ll sleep just fine. Nite!
Trade ideas

ZM | Price Will ZOOM Higher | LONGZoom Communications, Inc. engages in the provision of a communications and collaboration platform. It operates through the following geographical segments: Americas, Asia Pacific, and Europe, Middle East, and Africa. The company was founded by Eric S. Yuan in 2011 and is headquartered in San Jose, CA.

$ZM breaking out. Structure looks good for $100 NASDAQ:ZM breaking out. Structure looks good for $100 in the coming weeks/months.
Zoom Communications is a profitable, cash-rich platform that’s slowly re-accelerating through enterprise + AI, with buybacks cushioning dips.

Short ZMNASDAQ:ZM
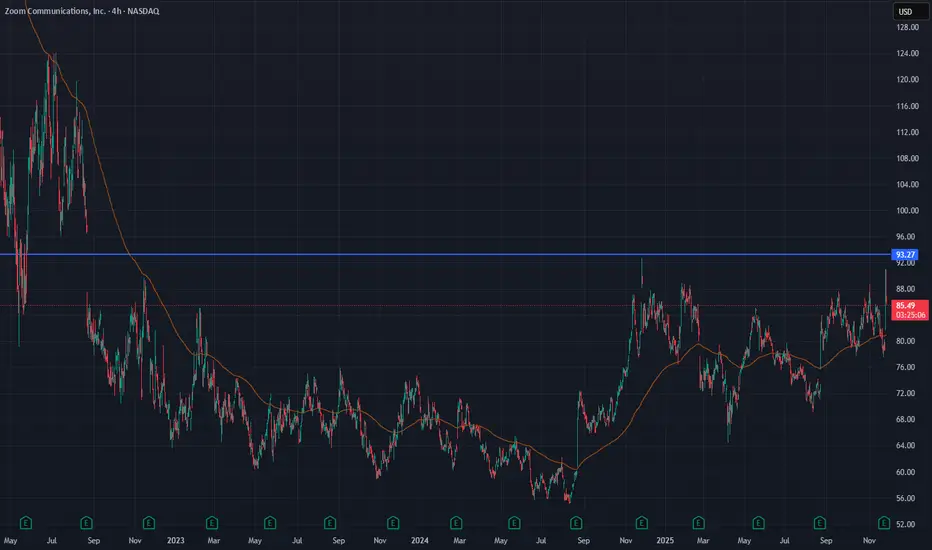
Zoom Video (ZM) was one of the major winners during the pandemic period. However, since August 2022 the stock has consistently failed to break above the $93 resistance, and it is increasingly unlikely to do so in a market where more alternatives now offer services similar to Zoom.
A solid Q3 earnings report pushed the price higher and brought it closer to that resistance zone, but the broader structure still suggests limited upside. In the coming weeks, the stock may retrace back toward the $73 area, or even revisit the $60 support zone, which has historically acted as a strong demand level.
This is not financial advice. Always conduct your own analysis and manage risk accordingly.
ZM Earnings Alert — QuantSignals V3 Call RecommendationZM Earnings (QuantSignals V3 | 2025-11-24)
Direction: BUY CALLS
Confidence: 58%
Expiry: 2025-11-28 (4 days)
Strike Focus: $80.00
Entry Range: $2.82 – $3.05 (mid: $2.93)
Target 1: $4.23 (50% gain)
Target 2: $5.49 (95% gain)
Stop Loss: $2.05 (30% loss)
Position Size: 2.5% of portfolio
Implied Move: $6.08 (~7.6%)
24h Price Move: –5.52%
Put/Call Ratio: 0.83 (Neutral)
Flow Intel: Neutral
Risk Level: 🔴 High Risk — small size recommended
Earnings Date: 2025-11-24 | Estimate: $1.48
📈 Technical Overview
Current Price: ~$79.87
Support: $77.42
Resistance: $84.46
RSI: Oversold / bounce potential
Volume: 1.6× average → elevated pre-earnings activity
Trend: Moderate bullish momentum after selloff
Chart Tips:
Draw support at $77.42 and resistance at $84.46
Highlight option entry band $2.82–$3.05
Mark targets $4.23 / $5.49 and stop $2.05
Monitor RSI and post-earnings volatility
📰 Fundamental / Sentiment Notes
Earnings released today
Revenue growth: +1250%
Fed dovish remarks support tech
Neutral news sentiment but oversold technicals provide bounce opportunity
⚠️ Risk Notes
High implied volatility (VIX 23.43)
Moderate conviction due to pre-earnings selloff
Break below support $77.42 invalidates bullish thesis
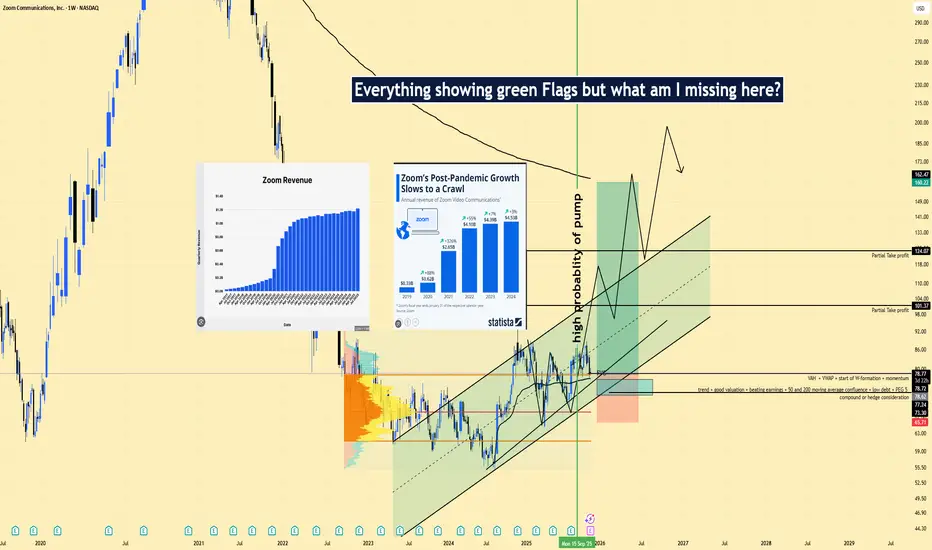
ZM | Long Setup | Re-Rate on AI UCaaS/CCaaS Pivot | Nov 24, 2025ZM | Long Setup | Range-to-Trend Re-Rate on AI UCaaS/CCaaS Pivot | Nov 24, 2025
🔹 Thesis Summary
Zoom is exiting a two-year base and riding a rising channel as the mix shifts from “meetings” to a broader AI-enabled UCaaS/CCaaS stack. If growth stabilizes and margins hold, a multiple re-rate from ~13x fwd EPS is plausible into 2026.
🔹 Trade Setup
Bias: Long
Entry Zone: $76–$81 (value area/POC ≈ $79)
Stop Loss: $68.5 (below channel base & prior swing lows)
Take-Profits:
TP1: $101.4
TP2: $118.5
TP3: $124.1
Max Target: $160–$165
🔹 Narrative & Context
Structure: Weekly rising channel since 2023 with a completed W-formation; price keeps reclaiming the VAH ~ $79 with positive reactions near value area lows.
Quality of sponsor base: ~77% institutional ownership with >1,000 holders; consistent EPS beats on the most recent quarters and revenue holding near $1.1–$1.2B/qtr.
Product mix shift: Zoom Phone + Contact Center (CCaaS) + AI Companion reduce dependence on commoditized meetings and increase seat/ARPU durability.
Seasonality/flow: 2025 YTD underperformed vs. 2023–2024; mean-reversion tailwind into Dec–Jan is typical for profitable software after weak YTD prints.
🔹 Valuation & Context (Pro Metrics, framed simply)
Forward P/E ≈ 13.3x vs. large-cap software ~24–28x → market prices Zoom like a no-growth asset → if CCaaS/Phone sustain mid-single-digit top-line and stable margins, the discount can narrow—this is the re-rate upside.
P/FCF ≈ 12.8x vs peers high-teens to 20s → cheaper cash generation → supports buybacks and tuck-ins during the pivot.
Quality: ROE ~13.6% / ROIC ~13.2%, Quick Ratio ~4.4 → solid balance sheet, self-funded transition.
Growth: EPS past 5Y +106%, Sales past 5Y +49.6% → post-pandemic decel but still compounding; stability matters more than acceleration for a re-rate.
Risk: Debt/Equity ~0.0x → low leverage limits downside in macro shocks.
🔹 Contrarian Angle (Your Edge)
Consensus still frames ZM as a stagnant “meetings” play. The tape shows accumulation within an ascending channel and improving mix economics. A shift from 13x → 18–20x fwd on steady EPS supports $120–$160 over the next 12–18 months—well above many cautious targets.
🔹 Risks (balanced)
Earnings gap risk & guide sensitivity (event tonight) could pierce the stop before trend resumes.
Competitive bundling from MSFT/GOOGL pressuring seat growth and pricing.
Execution risk scaling CCaaS/AI while protecting margins and security posture.
🔹 Macro Considerations
NDX / 10-Year yields: ZM correlates with duration-sensitive software—lower yields aid the re-rate; rising DXY/yields would cap multiples.
IT spending cadence: Enterprise budget resets (Q1CY) and procurement softness could stall seat adds.
Volatility/hedging: Elevated IV around earnings; consider staged entries or collars/call-spreads if taking exposure into the print.
🔹 Bottom Line
ZM screens inexpensive on forward and FCF multiples with a strong balance sheet and a credible path to mix-led stabilization. The weekly structure offers a defined-risk long from value, aiming for a re-rating toward $120–$160 as CCaaS/AI execution compounds.
🔹 Forward Path
If this post gains traction, I’ll follow up with: (1) weekly/quarterly re-maps of the channel and volume shelves, (2) updates on breakout/invalidations vs. $97/$101/$118/$124, (3) commentary on post-earnings guide and margin cadence.
Like & Follow for structured ideas, not signals. I post high-conviction setups here before broader narratives play out.
⚠️ Disclaimer: This is not financial advice. Always do your own research. Charts and visuals may include AI enhancements.
🔹 Footnote
Forward P/E: Price divided by expected earnings over the next 12 months. Lower = cheaper relative to profits.
P/FCF (Price-to-Free-Cash-Flow): Price vs. the cash left after investments. A measure of efficiency.
FCF Yield: Free cash flow per share ÷ price per share. Higher = more cash returned for each dollar invested.
ROE (Return on Equity): Net income ÷ shareholder equity. Shows management efficiency with investor capital.
ROIC (Return on Invested Capital): Net income ÷ all invested capital (equity + debt). A purer profitability gauge.
Debt/Equity: Debt divided by equity. <1 usually means balance sheet is conservative.
R:R (Risk-to-Reward): Ratio of expected upside vs. downside. 3:1 = you risk $1 to make $3.
Zoom Video oversold before earnings could fuel rebound this weekCurrent Price: $78.63
Direction: LONG
Confidence Level: 55% (Limited but notable oversold signal and potential earnings catalyst from professional trader sentiment)
Targets:
- T1 = $80.00
- T2 = $82.00
Stop Levels:
- S1 = $77.00
- S2 = $76.00
**Wisdom of Professional Traders:**
Several professional traders are flagging that Zoom Video’s current setup is in oversold territory just ahead of its earnings release. When traders collectively identify oversold conditions into a catalyst, they tend to anticipate a potential momentum shift. The consensus right now leans toward positioning for a short-term upside swing, taking advantage of compressed sentiment and the possibility of a relief rally if earnings come in as expected.
**Key Insights:**
The main thing catching my eye is that the pro-trader community sees technical exhaustion on the downside. With RSI readings pushing into oversold and price anchored near a prominent support from earlier in 2025, the setup hints at a dead-cat bounce or even a sharper squeeze if sellers get caught leaning too heavily into earnings. The lack of strong bearish conviction in these discussions adds weight to a contrarian long trade.
What’s interesting is that despite low tweet volumes on X, the chatter that does exist isn’t showing aggressive negativity. That absence of pronounced bearish pressure combined with oversold conditions makes the probability of a push into the low-$80s more realistic this week, provided earnings don’t deliver a severe disappointment.
**Recent Performance:**
You can see this in recent price action: ZM has drifted steadily lower over the past month, losing about 10%, with last week closing just under $79. That puts the stock at multi-week lows and right on top of an area where it previously attracted buying interest earlier in the year. Traders are eyeing this price memory as a spot where demand could reappear, especially if the news catalyst removes uncertainty.
**Expert Analysis:**
The professional traders I’m following talk about key technicals lining up — oversold RSI, compression against prior support, and light bearish sentiment. Historically, these conditions have yielded 2-4% upside rebounds in the days following similar setups for ZM. Tight stops make sense here given the binary risk around earnings, but the reward-to-risk still appears favorable on the long side for this week.
**News Impact:**
All eyes are on tomorrow’s Q3 2025 earnings after the bell. Analysts expect steady results without major upside surprises, but just avoiding bad news might be enough to spark relief buying. There’s no recent negative headline weighing on sentiment, so the market is essentially staring at an oversold chart with a clean news slate — a combination that often produces sharp, short-lived rallies.
**Trading Recommendation:**
Here’s my take: I’d go long around $78.63 with a focus on a short-term pop. T1 at $80 and T2 at $82 give a reasonable 1.8% to 4.3% upside in the next few sessions, while S1 at $77.00 and S2 at $76.00 keep downside risk defined. Given the 55% confidence, this is a tactical play with modest size — aim to capture the oversold bounce, then step aside before volatility from any post-earnings drift kicks in.

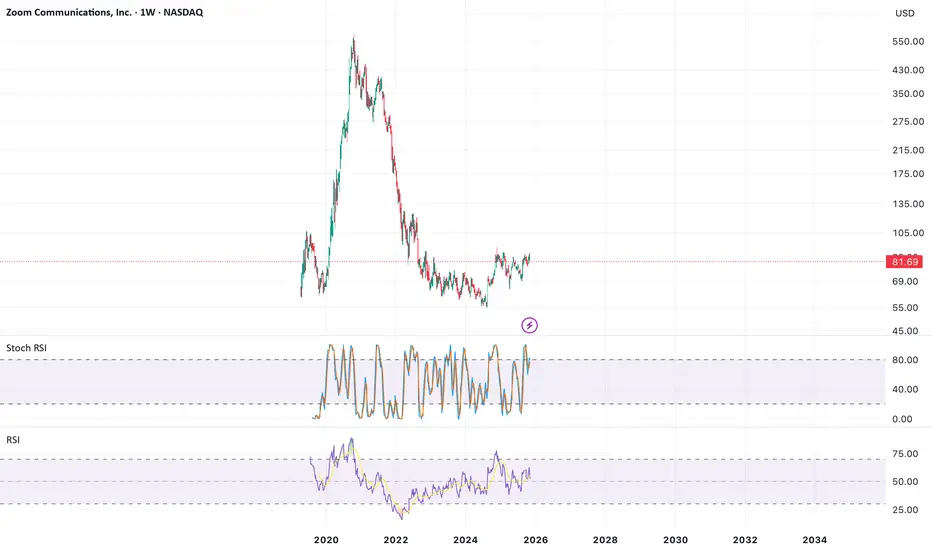
Zoom Is Down 85% Since 2020. Here's Its Chart Ahead of EarningsZoom Communications NASDAQ:ZM sort of saved our jobs during COVID-19 (and saw its share price rise some 660% in the process), but the stock has fallen some 85% from its 2020 peak and is down year to date. Let's see what Zoom's chart and fundamental analysis say as the video-conferencing firm heads into earnings next week.
Zoom Communications' Fundamental Analysis
Zoom became a godsend for office workers during the pandemic, allowing them to meet via video while working from home.
The app's popularity drove Zoom's stock up nearly 660% from its February 2020 low just before COVID began in earnest to a $588.84 high by October 2020.
But shares have come back to Earth since then, closing Wednesday at $80.71 -- down 86.3% from their 2020 top and off 1.1% year to date.
Now, Zoom is set to release fiscal Q3 results on Monday after the bell, with Wall Street looking for $1.44 in adjusted earnings per share on $1.21 billion of revenue.
That would represent a 4.3% gain from ZM's $1.38 in adjusted EPS for the same quarter a year ago, with sales up roughly 3% from the $1.18 billion the company saw in the same period a year earlier.
Interestingly, 24 of the 27 sell-side analysts that cover Zoom have revised their earnings estimates higher since the quarter began, while zero have cut their numbers. (Three analysts left estimates unrevised.)
Even more interestingly, Goldman Sachs strategist David Kostin included Zoom in a basket of 48 stocks he created in September that he saw as 2026 M&A candidates. Kostin put the odds of Zoom being involved in a deal at 15% to 30%.
Zoom Communications' Technical Analysis
Now let's take a look at ZM's chart going back some four months and running through Tuesday afternoon:
Readers will see that Zoom has developed a double-top pattern of bearish reversal stretching back to August, as marked with red boxes above.
This pattern's downside pivot stands just below $78, while the stock's 200-day Simple Moving Average (or "SMA," denoted by a red line in the chart above) currently runs about a dollar higher at $78.70.
Hence, this is the level where either strong support for the shares will likely show up or the stock will break lower. (As noted above, Zoom closed Wednesday at $80.71.)
Additionally, Zoom has developed a triangle pattern, shaded in pink at the chart's right. But in this case, the triangle is really just a broad pennant pattern that's marked with diagonal black lines at the chart's right.
The pennant appears to have come close to closing ahead of earnings -- a pattern that can signal an imminent volatility increase, but doesn't tell you which direction (up or down).
So, Zoom has two patterns here: one signaling lower stock prices and the other pointing to increased volatility.
Meanwhile, Zoom has already surrendered its 21-day Exponential Moving Average (or "EMA," marked with a green line) and its 50-day SMA (the blue line).
This has probably cost the support of some swing traders and portfolio managers. However, losing the 200-day SMA -- $78.70 in the chart above, a level that ZM has yet to break -- would be the most significant technical loss of the three.
Looking at Zoom's other key technical indicators, the stock's Relative Strength Index (the gray line at the chart's top) is running just shy of neutral.
That said, the daily Moving Average Convergence Divergence indicator (or "MACD," marked with black and gold lines and blue bars at the chart's bottom) isn't looking all that bullish.
The histogram of the 9-day EMA has moved into negative territory, which is a short-term bearish signal.
Additionally, the 12-day EMA (the black line) has crossed below the 26-day EMA (the gold line). While both lines remain in positive territory, the black line appears to be headed for the zero-bound. All of that is more or less bearish.
An Options Option
Many options traders who are bearish on Zoom heading into earnings but looking to manage risk might employ a bear-put spread in this scenario rather than shorting the stock.
This strategy is composed of a long put along with a short put at a lower strike price, but with the same expiration date. Here's an example:
-- Buying one ZM $79 put with a Nov. 28 expiration (i.e. after the earnings date). This cost about $2.50 at recent prices.
-- Selling one Nov. 28 ZM $74 put for roughly $1.
Net Debit: $1.50.
This options trader would be laying out a net $1.50 to try to earn $5, for a $3.50 maximum gain should the trade work as expected.
If it didn't, the trader's theoretical maximum loss would be the $1.50 net debit.
(Moomoo Technologies Inc. Markets Commentator Stephen "Sarge" Guilfoyle had no position in ZM at the time of writing this column.)
This article discusses technical analysis, other approaches, including fundamental analysis, may offer very different views. The examples provided are for illustrative purposes only and are not intended to be reflective of the results you can expect to achieve. Specific security charts used are for illustrative purposes only and are not a recommendation, offer to sell, or a solicitation of an offer to buy any security. Past investment performance does not indicate or guarantee future success. Returns will vary, and all investments carry risks, including loss of principal. This content is also not a research report and is not intended to serve as the basis for any investment decision. The information contained in this article does not purport to be a complete description of the securities, markets, or developments referred to in this material. Moomoo and its affiliates make no representation or warranty as to the article's adequacy, completeness, accuracy or timeliness for any particular purpose of the above content. Furthermore, there is no guarantee that any statements, estimates, price targets, opinions or forecasts provided herein will prove to be correct.
Options trading is risky and not appropriate for everyone. Read the Options Disclosure Document ( j.moomoo.com ) before trading. Options are complex and you may quickly lose the entire investment. Supporting docs for any claims will be furnished upon request.
Options trading subject to eligibility requirements. Strategies available will depend on options level approved.
Maximum potential loss and profit for options are calculated based on the single leg or an entire multi-leg trade remaining intact until expiration with no option contracts being exercised or assigned. These figures do not account for a portion of a multi-leg strategy being changed or removed or the trader assuming a short or long position in the underlying stock at or before expiration. Therefore, it is possible to lose more than the theoretical max loss of a strategy.
Moomoo is a financial information and trading app offered by Moomoo Technologies Inc. In the U.S., investment products and services on Moomoo are offered by Moomoo Financial Inc., Member FINRA/SIPC.
TradingView is an independent third party not affiliated with Moomoo Financial Inc., Moomoo Technologies Inc., or its affiliates. Moomoo Financial Inc. and its affiliates do not endorse, represent or warrant the completeness and accuracy of the data and information available on the TradingView platform and are not responsible for any services provided by the third-party platform.

ZM Long📈 ZM Stock Update (Zoom Video)
ZM is forming a classic Cup and Handle pattern — a bullish continuation setup that often signals a potential breakout ahead.
✅ The cup reflects a strong recovery and accumulation phase.
✅ The handle is forming with light consolidation, indicating reduced selling pressure.
🚀 A breakout above the handle’s resistance could confirm the move, with a measured target around $87.50$
Keep an eye on volume during the breakout — increasing volume adds strong confirmation.
Buy Opportunity Look at these lows! You might be a bag holder for a little while, but this is a definite 50% in the next 18-24 months.
ZOOM : go LONG
1. Technical Analysis (Based on the Heikin Ashi Chart)
The Heikin Ashi chart is used to smooth out price fluctuations, making it easier to identify market trends.
* Strong Bullish Reversal Signal:
* Following a period of consolidation or slight correction (late September to mid-October), the chart shows a series of consecutive green Heikin Ashi candles, signaling a shift from a sideways/downward trend to an uptrend.
* The appearance of long-bodied green candles with little or no lower wick, particularly in late October and early November, is a powerful indicator that buying pressure is dominating.
* Breakout Above Resistance/Accumulation Zone:
* The stock price has broken out above the horizontal support/resistance line marked at approximately $82.66. This area was likely a zone of accumulation or prior resistance. Breaking this level with strong green candles suggests investor consensus and the potential for continued upward momentum.
* Potential Price Target:
* Based on the trade setup shown on the chart, the potential target price is set at $122.38. This represents a significant potential return relative to the current price ($87.23), indicating an attractive risk/reward ratio if the stop-loss is placed logically below the broken support level.
* Current Entry Point:
* The current price of $87.23 is right after the confirmation of the bullish signal (post-breakout of $82.66), which could represent an optimal entry point to ride this new uptrend.
2. Fundamental Analysis
While Zoom faces intense post-pandemic competition, the following fundamental factors still support a buy thesis:
* Revenue and Earnings Beat Expectations:
* Zoom has raised its revenue outlook for the full fiscal year 2025 (projecting $4.61 billion - $4.62 billion) and reported adjusted Earnings Per Share (EPS) higher than previous forecasts, indicating the company's ability to grow and manage costs effectively.
* Consistently beating analysts' estimates in recent earnings reports (e.g., Q4 revenue of $1.15 billion) builds positive confidence in the business's capabilities.
* Sustainable "Hybrid Work" Trend:
* Although the pandemic is over, the hybrid work model (combining remote and in-office work) has become a long-term trend. Demand for professional, user-friendly video conferencing solutions like Zoom Phone, Zoom Rooms, and Zoom Video Webinar remains strong and steady.
* Product Diversification and Acquisition Strategy:
* Zoom is actively expanding into other enterprise services like Zoom Phone and Zoom Rooms to reduce reliance on the core video meeting application and seek more sustainable revenue streams from larger customers (Enterprises).
* The integration of Artificial Intelligence (AI) into its services is also a key focus, promising to enhance user experience and create new competitive advantages.
* The company has engaged in a Share Buyback plan, which is generally viewed positively, as it reduces the number of outstanding shares and can support the stock price.
* Strong Financial Position:
* The company maintains a large Free Cash Flow and holds a significant amount of cash on its balance sheet, providing flexibility to invest in growth, pursue acquisitions, or navigate economic uncertainties.

Accumulation complete; breakout is just days away !Over the past 10 months Zoom has formed an inverse head and shoulders bottoming pattern. These are clear signs of accumulation before the start of a markup phase.

Zoom Update. Near ObjectiveLike previous analysis ZM is near to reach the objective.
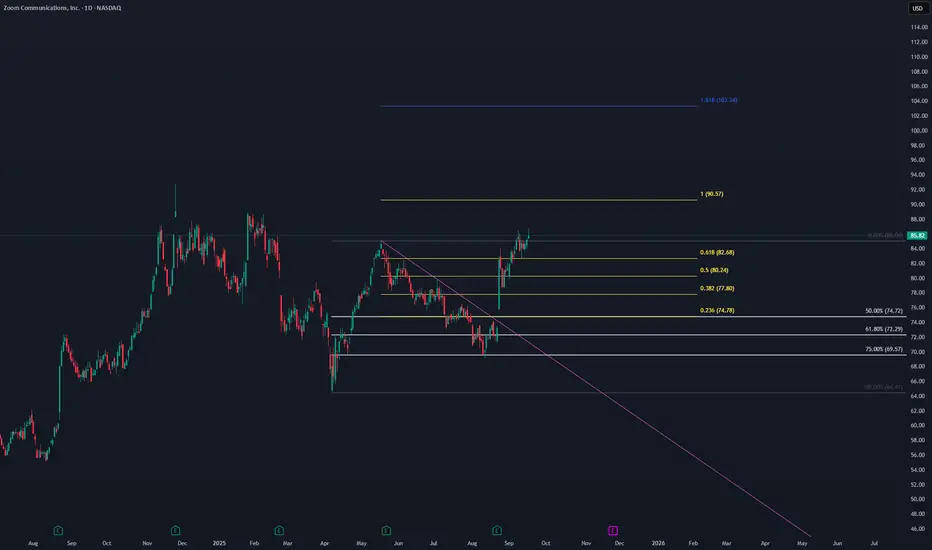
FIB RETRACEMENT⮕PRICE RETRACEMENT⮕TRENDLINE CROSSING⮕FIB EXTENSION⮕TARGET THE OBJECTIVE
$ZM: Structure Surgery 🏛️ Research Notes
Original (radical angles)
Redefined Interconnection
Sample for further research
Also testing exponential scaling of phi:
ZMTechnical Analysis (Daily Chart – ZM, NASDAQ):
The stock is currently trading around $83.98, slightly below the local resistance at $85.12.
A symmetrical triangle pattern has formed (A–B–C–D), and the recent breakout to the upside suggests potential bullish continuation.
The buy zone is marked near $80, with a protective stop-loss at $69. This provides a favorable risk–reward setup.
The first major resistance and profit-taking zone is highlighted at $110.35 – $110.83, which is the initial target for this bullish move.
Multiple moving averages (short- and mid-term) are turning upward and crossing above the long-term black moving average, confirming a shift toward bullish momentum.
As long as the price holds above $77–80 support, the bullish scenario remains valid. A breakdown below $69 would invalidate this setup and signal renewed downside risk.
Outlook:
Short-term: Potential retest of the breakout area (~$80) before resuming the upward move.
Medium-term: Bullish bias toward the $110 zone.
Risk management is crucial—tighten stops if the stock struggles around $85–90.
📌 Summary:
Current trend shows a bullish breakout from consolidation. Entry is favorable around $80, stop-loss at $69, with the first target zone between $110.35 and $110.83.

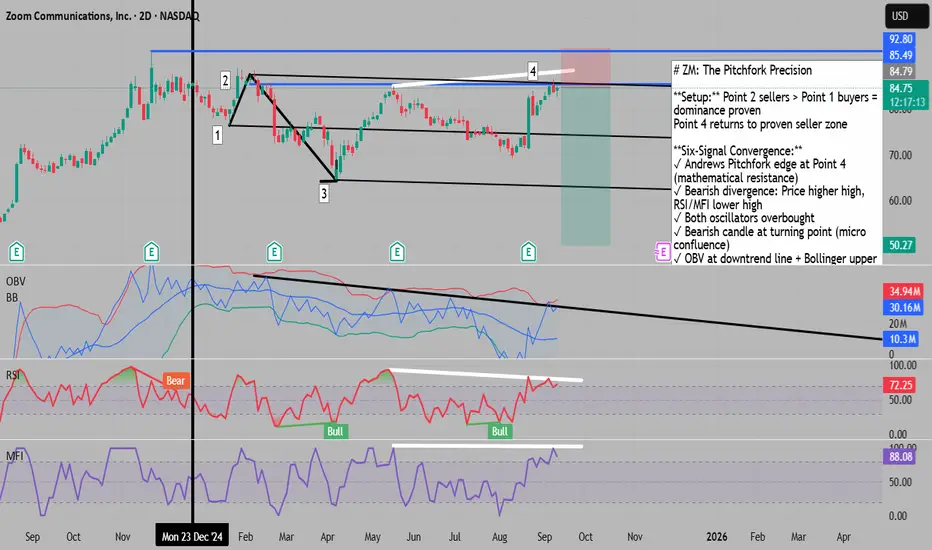
The Pitchfork Precision: ZM's Multi-Tool Reversal Signal
The Pitchfork Precision: ZM’s Multi-Tool Reversal Signal
## The Seller's Validation (Points 1→3)
The power dynamic shifted decisively when Point 2 sellers crushed through Point 1 buyers , driving price to a new low at Point 3. This wasn’t a minor victory – it was proof of seller supremacy in the local structure. Now at Point 4, price has returned to these proven sellers’ domain, setting the stage for potential rejection.
## Andrews Pitchfork: The Mathematical Edge
Applying Andrews Pitchfork to Points 1, 2, and 3 reveals something remarkable: Point 4 sits precisely at the upper median line (edge) . This isn’t coincidence – it’s mathematical precision. According to pitchfork theory, price at the edge faces two probable paths:
- Return to the median line (bearish)
- Push to the opposing outer median line (extremely bearish)
Both scenarios favor the downside, making this a high-probability short setup.
## The Six-Signal Convergence
1. Momentum Divergence
- Price: Higher high at Point 4
- RSI/MFI: Lower highs = Classic bearish divergence
This disconnect between price and momentum reveals waning buyer strength.
2. Oscillator Extremes
- RSI: Overbought territory
- MFI: Overbought territory
Both momentum indicators scream overextension.
3. Micro Confluence
The bearish candle at Point 4 provides immediate confirmation – a micro-level signal validating the macro setup.
4. OBV Double Resistance
- OBV Downtrend Line: Acting as dynamic resistance
- OBV Bollinger Band Upper: Additional resistance layer
When volume indicators align with price resistance, the signal strengthens exponentially.
5. VWAP 2nd Deviation Touch
Point 4 precisely tags the 2nd standard deviation of VWAP (anchored from Point 1). This represents a 95% statistical extreme – price rarely sustains above this level.
6. Structural Resistance
Return to proven seller territory established at Point 2.
## The Probability Stack
What makes this setup exceptional isn’t any single indicator – it’s the convergence of six independent signals :
- Structure says sellers dominate
- Pitchfork says we're at mathematical resistance
- Momentum says buyers are exhausted
- Volume says selling pressure building
- Statistics say we’re at an extreme
- Price action confirms with bearish candle
When this many unrelated indicators align, probability shifts dramatically in favor of the trade.
## The OBV Tell
The OBV downtrend line deserves special attention. While price has been attempting recovery, volume has been declining – a classic bear market signature. The fact that OBV also sits at its Bollinger Band upper resistance creates a volume ceiling that price will struggle to overcome.
## Execution Framework
Entry: Bearish confirmation at Point 4
Stop: Above Point 2 (seller validation level)
Target 1: Pitchfork median line
Target 2: Pitchfork lower median line
Target 3: Point 3 support / opposing outer median
Risk Management: The confluence of signals allows for tight stops while targeting multiple profit zones based on pitchfork projections.
## Market Context
ZM’s post-pandemic normalization continues to play out technically. The repeated failures at resistance levels, combined with declining volume patterns, suggest institutional distribution rather than accumulation. This technical setup aligns with the fundamental narrative of reduced video conferencing dependency.
---
Key Insight: When Andrews Pitchfork, VWAP deviation, momentum divergence, volume analysis, and price structure all point the same direction, you’re not gambling - you’re executing a high-probability, mathematically-backed trade setup.
Zoom's Next Move: Breakout or Fakeout? Watching $83.95 With MACDZoom Communications (ZM) — Technical Setup
Price recently broke above key resistance at $83.95 and is now retesting that level, which could act as new support. If this level holds, I'm anticipating a bullish continuation toward the next resistance at $92.72 — representing a potential 10.4% upside.
📈 Golden Cross: The 50 EMA has just crossed above the 200 EMA, signaling a longer-term trend reversal to the upside.
🔍 Indicators:
MACD: Bullish crossover above the signal line and rising above the 0 line with green histogram bars — showing early momentum.
RSI: Hovering around 63 — approaching overbought but still in a healthy uptrend zone.
Stochastic: In overbought territory, but no bearish cross yet. Watching closely.
📉 Volume: Breakout occurred on moderate volume. A pickup in volume would help confirm a continuation.
🔻 If $83.95 fails to hold as support, I’m watching the next key level down at $78.23 (~6.8% downside) as a possible retracement zone.
🎯 Plan: Watching for price action and volume around $83.95. A strong bounce here could trigger a long entry targeting the $92 zone, with a stop below the support.
Let me know your thoughts in the comments — do you think support will hold, or is this a false breakout?

$ZM (Zoom Video Communications) - Long SetupTrading Idea: NASDAQ:ZM (Zoom Video Communications) - Long Setup
🎯 Idea: LONG
⏰ Timeframe: Daily
📊 Pattern: Bullish Breakout + Momentum Continuation
Fundamental Context:
Fundamental Score: 5/9 (Neutral).
Growth: Strong Net Income Growth YoY.
Balance Sheet: Excellent (Debt Score: 10/10). Zero debt.
Valuation: Fairly Valued on P/E and P/B; Overvalued on P/S.
Technical Setup:
Trend (D1): Bullish ✅
Entry: $85.90 (Break above consolidation & Bollinger Band squeeze).
Stop Loss (SL): $77.50 (Below key support and the 20-period SMA).
Take Profit (TP): $102.65 (Previous high target + Measured Move).
Momentum: Strong RSI (67) and positive MACD support the move.
Risk Management:
Risk/Reward (R:R): 1:2.0
Position size based on the risk between entry and stop.
Summary: A technical breakout play on a company with a clean balance sheet (no debt) and strong earnings growth, targeting a move to new highs.
⚠️ Disclaimer: Not Financial Advice
This analysis is for educational and informational purposes only. It is NOT a recommendation to buy or sell any security.
Conduct your own research (DYOR) before making any investment decisions.
You are solely responsible for your own trades and investments.
Past performance is never indicative of future results.
Trading involves significant risk of loss and is not suitable for all investors.
#TradingView #ZM #Long #Breakout #TechnicalAnalysis #GrowthStocks #VideoCommunication #TradingSetup
Zoom moving higher
Zoom as been performing bad as of the last few years. As you can see from the second image, ZM double bottom at all time lows, found support, moved higher and formed a small bull flag and has broken above the Bull flag and is now moving higher. ZM is still in the early stages of what could be a large move up, this is a great time to get in early.
$ZM | Zoom Communications – Flagging Between Earnings📊 NASDAQ:ZM | Zoom Communications – Flagging Between Earnings
Co-incidence or pattern? NASDAQ:ZM has been flagging from the previous earnings report all the way into this upcoming ER.
🔎 Chart Notes
Price has been respecting a descending channel with multiple CHoCH (Change of Character) signals.
Current level sits near $72.19, testing equilibrium.
Upside target: $82.38 if momentum shifts bullish and breaks premium supply zones.
Downside risk: $64.43 strong low if the channel continues to hold and ER disappoints.
💡 Volume profile suggests accumulation phases inside the channel, but the breakout direction will likely align with ER catalyst.
⚖️ Trading Plan
Watch for confirmation outside the flag.
Bullish break → eyes on $78–$82 supply.
Bearish rejection → potential sweep toward $64.
ER could be the catalyst that resolves months of coiling price action.

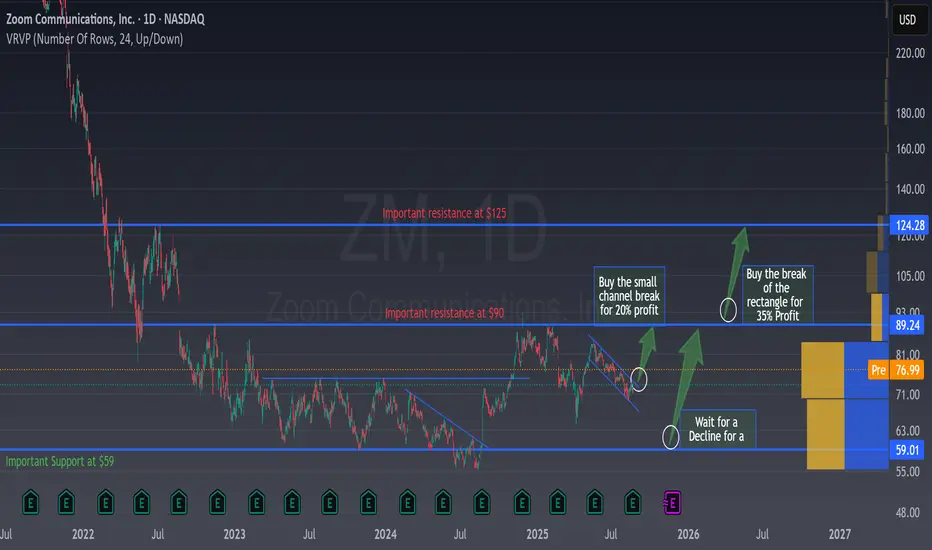
3 Ways to Trade Zoom for a Fast 20% Gain3 Ways to Trade Zoom for a Fast 20% Gain
First Impressions 🤔
Zoom’s daily chart paints a story of prolonged consolidation. After its post-pandemic plunge, the stock has been grinding sideways between roughly $60 and $90 for years.
As an investor, you might feel a bit of relief, no more wild swings, but also some itchiness: “Is this the calm before the storm?” 🌪️
At first glance, the sideways drift signals indecision, but the tightening range since May hints that something’s about to give.
Pattern Recognition
Short-Term Falling Channel Break
Since May 2025, price carved a small downward sloping channel, from about $82 down to $71.
This mini-channel is textbook: two parallel trendlines touching a series of lower highs and lower lows.
A channel like this often resolves with a quick breakout, and indeed, we see price poking up through the upper trendline. Breaks upward suggest buyers are stepping in , momentum often carries price at least the channel’s height (~$11) above the breakout which is the resistance zone!! This is what I love of Chart Patterns.
Key Support & Resistance
Support at $59–$60, Major floor since mid-2021, a solid zone where institutions historically piled in.
Resistance at $89–$90: The ceiling of the wide trading rectangle, broken this would open a clear path to $124.
Rectangle (Accumulation)
Zoom has been trading inside a large rectangle ($59–$90) for more than two years. This is an accumulation pattern: sellers above $90 have repeatedly stopped rallies, but buyers at $60 stand firm. A break above $90 could trigger a 30–40% rally , while a drop below $60 would signal fresh bearish momentum (not our base case, given fundamentals).
Analyst & Fundamental Context
Most analysts sit around a $95–$105 consensus target, slightly above the current price but also the resistance level. Their medium-term thesis rests on steady subscription growth , upsells of Zoom Phone and Zoom Events , and margin improvement as travel rebounds strengthen corporate spending.
On one hand, the chart’s sideways chop aligns with analysts’ view: slow but steady progress. On the other, the short-term channel break suggests a tactical bump toward $89 may come quicker than fundamentals alone justify.
Investment Ideas, with clear entry and exit levels
Here are three ways to play the setup, tailored to your style and patience:
1. Channel Break Entry (Tactical, FOMO-Friendly)
Entry : On a clean breakout above $72–$73 (the small channel’s upper line)
Target : $89 (20% upside)
Stop Loss: $71 (mid-channel) → Risk ~4%
Rationale : Quick move, tight risk; $74–$75 is now a micro-support where institutions could jump in. 📈
2. Patient Pullback (Medium-Term, Low Stress)
Entry : Near $60 support if the stock dips back
Target : $85–$90 (40% upside)
Stop Loss : $55–$57 → Risk 5–8%
Rationale : Buying at a rock-bottom area maximizes reward/risk; ideal if you need some time to have cash available.
3. Confirmation Above Rectangle (Momentum Play)
Entry : On a sustainable close above $90–$91
Target : $120+ (30%+ upside)
Stop Loss : $84–$86 (inside box) → Risk 5–8%
Rationale : Classic breakout with guaranteed momentum, the next logical zone is the top of the preceding local downtrend or analyst targets which is much tighter. Anyway, a break would happen if there si something that shows that ZM has transformed and that would be the reason to see analyst moving the price to $120 instead of the current $95 to $100.
🚫 Bearish scenarios don’t align with Zoom’s growing enterprise revenue and profitability. This accumulation pattern screams “base for the next leg up,” not a continuation lower.
________________________________________
Key Takeaway:
Zoom is coiled in a multi-year base and just broke a short-term falling channel. Whether you’re chasing a quick run to $89, patiently waiting at $60, or needing full confirmation above $90, the reward/risk looks skewed in your favor.
Happy trading! 😊
💬 Does this setup align with your view on NASDAQ:ZM ?
🚀 Hit the rocket if this helped you spot the opportunity and follow for more easy, educational trade ideas!
ZM: Congrats! ZM Jumped as per our AI models forecast. We might use it again to see the next er and see how accurate is it. Right now just giving a quick update.

Zoom $78 Calls: Huge Earnings Upside Potential!
## 🚀 Zoom Earnings Play: Cheap Calls Before the Bell (Aug 21, 2025) 🚀
### 🏦 Earnings Outlook
* 📊 **Revenue Growth:** +2.9% TTM – stagnant post-COVID growth
* ⚖️ **Margins:** Gross 75.9%, Profit 22.3% → Strong efficiency
* 📈 **Historical Beat Rate:** 100% over last 8 quarters
* 🖥️ **Sector:** Tech / SaaS – AI and cloud trends impact growth sentiment
* 🧭 **Analyst Consensus:** Buy, with upside potential
---
### 🔎 Options Flow Insight
* 📉 **Put Activity:** OTM puts (\$66-\$67) highlight cautious institutional sentiment
* ⚖️ **Put/Call Skew:** Slightly bearish, hedging activity present
* 💡 **Opportunity:** Take advantage of earnings momentum with \$78 calls
---
### 📉 Technical Setup
* 📊 **Current Price:** \$72.16 → below 50D (\$75.09) & 200D (\$78.61) MA
* 🔑 **Support:** \$71.00
* 🔑 **Resistance:** \$75–\$78
* 💥 Volume: Slightly below average, indicates muted momentum
---
### 🎯 Trade Setup (Earnings Play)
* 🟢 **Direction:** CALL (Bullish Bias)
* 🎯 **Strike:** \$78.00
* 💵 **Entry Price:** \$0.98
* 📅 **Expiry:** Aug 22, 2025
* 📊 **Size:** 1 contract
* 🕒 **Entry Timing:** Pre-earnings close
📌 **Profit Target:** \$2.94 (200% 🚀)
📌 **Stop Loss:** \$0.49 (50% of premium)
📌 **Exit Rule:** Within 2 hours post-earnings to avoid theta decay
---
🔥 Hashtags for Reach 🔥
\#ZoomEarnings #ZMOptions #EarningsPlay #TechStocks #OptionsTrading #TradingSetup #DayTrading #SwingTrading #WallStreet