Trade ideas

US30 about to make a new all time highWith FED officially ending the QT, US30 about to make a new all time high
DowJones resisrtance retest at 47648Key Support and Resistance Levels
Resistance Level 1: 47648
Resistance Level 2: 47830
Resistance Level 3: 48000
Support Level 1: 47130
Support Level 2: 47000
Support Level 3: 46867
This communication is for informational purposes only and should not be viewed as any form of recommendation as to a particular course of action or as investment advice. It is not intended as an offer or solicitation for the purchase or sale of any financial instrument or as an official confirmation of any transaction. Opinions, estimates and assumptions expressed herein are made as of the date of this communication and are subject to change without notice. This communication has been prepared based upon information, including market prices, data and other information, believed to be reliable; however, Trade Nation does not warrant its completeness or accuracy. All market prices and market data contained in or attached to this communication are indicative and subject to change without notice.

US30 Technical Breakdown – 12/02/2025📍 US30 Technical Breakdown – 12/02/2025
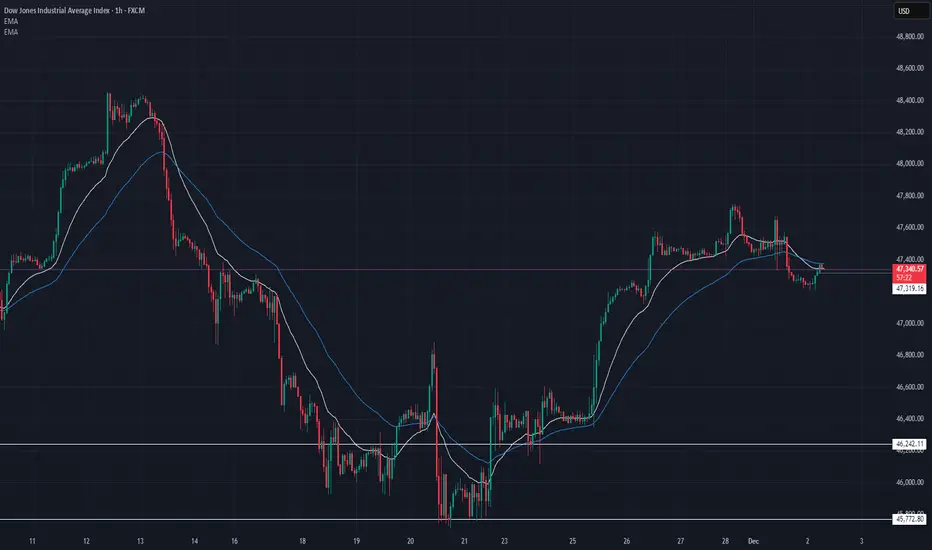
US30 pulled back from the 47,700–47,800 resistance zone after a strong rally, with price now hovering just above the 47,300 structure level. Bulls are still holding the broader trend, but short-term momentum has clearly cooled as EMAs flatten and price retests key intraday support 🔍📉.
📊 Market Behavior:
🔹 Strong rejection from 47,780 – sellers defending this level hard
🔹 EMAs tightening → momentum slowing after the pump
🔹 Bulls holding 47,300 for now, but losing it opens deeper downside
📌 Key Levels:
🔹 Resistance:
47,560 → intraday reaction zone
47,780 → major supply / rejection point
48,000 → psychological level + next liquidity pocket
🔹 Support:
47,300 → immediate support (currently being tested)
46,960 → next demand zone
46,242 → major structural support from last week
🧠 Bias:
Neutral-to-bullish while above 47,300 📈
📈 Break back above 47,560 → continuation toward 47,800–48,000
📉 Break below 47,300 → opens path to 47,000 → 46,960 → 46,240
DOW JONES (US30): Pullback From Trend Line
US30 is testing a recently broken solid rising trend line
on a daily time frame.
I believe that odds are high that the market will retrace from that.
We can expect a pullback to 47300
❤️Please, support my work with like, thank you!❤️
I am part of Trade Nation's Influencer program and receive a monthly fee for using their TradingView charts in my analysis.

Us30📊 Key Information and Analysis
Based on the image, here is a breakdown of the information and the potential trade setup:
Instrument: US Wall St 30 (represented as US30USD). This typically tracks the performance of the Dow Jones Industrial Average (DJIA) index.
Timeframe: 1h (1-hour), meaning each candlestick represents one hour of trading.
Current Price: Approximately 47,538.2.
Price Change: The index is up $227.6 or +0.48% for the period shown.
Pending Trade Setup: There appears to be a Buy Limit or Market Execution Buy setup indicated by the blue and red zones.

US30 Trade Secured 1500 PipsSet up played out perfectly, sweeping SSL/Asia Lows, engulfed on the 5m-15m to push higher to -4.25/-4.5 fib

US30 Trade Set Up Nov 27 2025Price remains overall bullish but we did break structure to the downside on the 1h in London session so i will be looking for BSL sweep of London or Asia highs followed but internal 1m-5m IFVG/CISD to target 50% of 4h FVG and PDL

Dow Jones Near resistance Dow Jones near resistance at $47,850, if fail to breakout then another round of sell off possible.

Dow Jones (US30) grinds higher within the choppy 5th wave
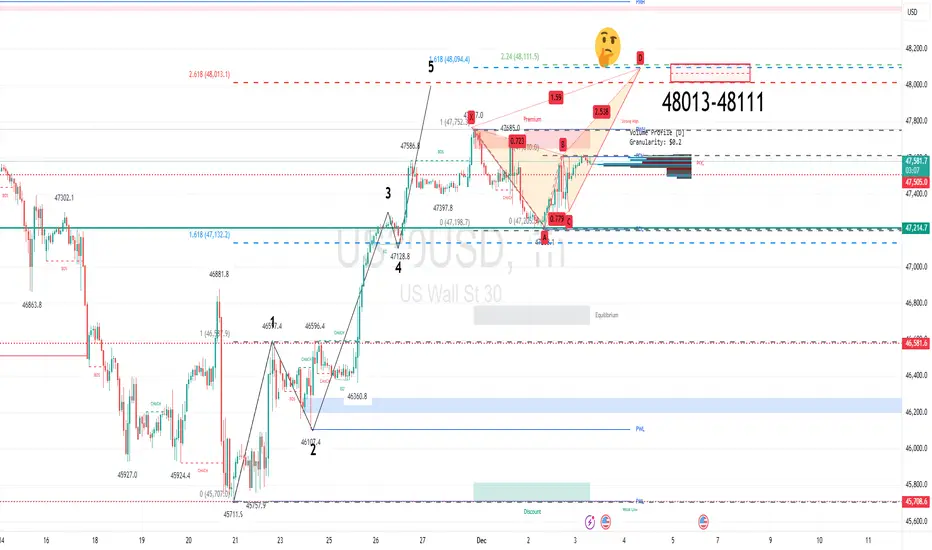
We have seen mixed price action for the last four days, with rallies finding sellers and dips finding buyers
The intraday chart highlights a 261.8% extension level at 48,013. A move to this zone would be analysed as the completion of a bullish 5 Wave count (Elliott Wave).
The current mixed daily results look to be forming a Crab pattern. That will be completed on a move to 48,111.
Conclusion: the medium-term bias is bearish. The preferred stance would be to sell into rallies within the 48,013-48,111 zone.
US30 H1 | Bullish Bounce Off Pullback SupportMomentum: Bullish
Price is currently above the ichimoku cloud.
Buy entry: 47,553.30
- Pullback support
- 50% Fib retracement
Stop Loss: 47,362.17
- Swing low support
Take Profit: 47,750.49
- Swing high resistance
High Risk Investment Warning
Stratos Markets Limited (tradu.com/uk ), Stratos Europe Ltd (tradu.com/eu ):
CFDs are complex instruments and come with a high risk of losing money rapidly due to leverage. 70% of retail investor accounts lose money when trading CFDs with this provider. You should consider whether you understand how CFDs work and whether you can afford to take the high risk of losing your money.
Stratos Global LLC (tradu.com/en ): Losses can exceed deposits.
Please be advised that the information presented on TradingView is provided to Tradu (‘Company’, ‘we’) by a third-party provider (‘TFA Global Pte Ltd’). Please be reminded that you are solely responsible for the trading decisions on your account. Any information and/or content is intended entirely for research, educational and informational purposes only and does not constitute investment or consultation advice or investment strategy. The information is not tailored to the investment needs of any specific person and therefore does not involve a consideration of any of the investment objectives, financial situation or needs of any viewer that may receive it. Past performance is not a reliable indicator of future results. Actual results may differ materially from those anticipated in forward-looking or past performance statements. We assume no liability as to the accuracy or completeness of any of the information and/or content provided herein and the Company cannot be held responsible for any omission, mistake nor for any loss or damage including without limitation to any loss of profit which may arise from reliance on any information supplied by TFA Global Pte Ltd.

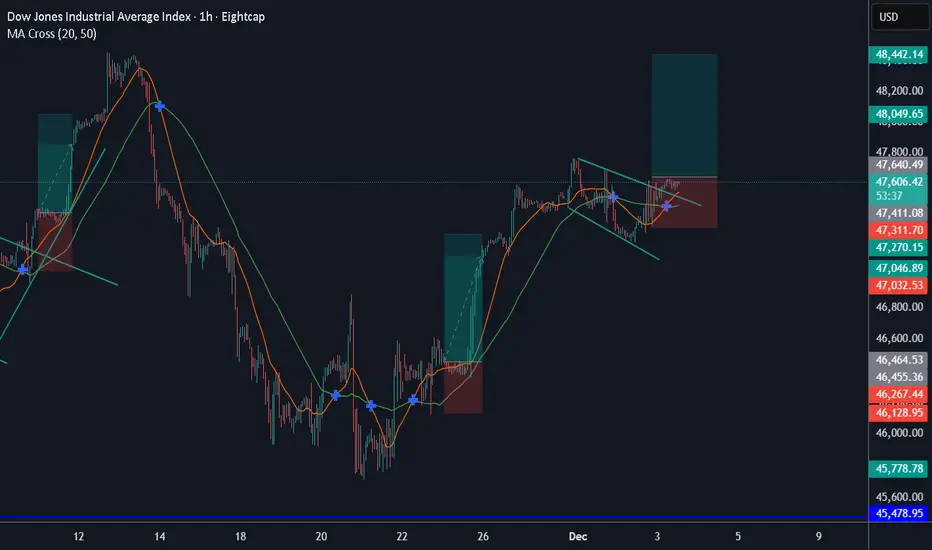
DOW JONES INDEX GOES 'CUP AND HANDLE' PATTERN. HERE'S WHYA cup and handle is a bullish technical analysis pattern that signals a continuation of an uptrend and a potential buying opportunity. It appears as a U-shape (cup), followed by a slight decline or consolidation (handle), after which further price gains are expected. The pattern was popularized by William O'Neil in 1988.
Cup and Handle
Cup: A U-shaped movement that forms when an asset's price, after a rally, initially pulls back and then recovers to its previous highs.
Handle: After completing the cup, a slight correction or consolidation occurs, appearing as a downward-sloping line, sometimes shaped like a small cup. The handle typically forms on lower trading volume.
How it works
Buy: Traders look for a breakout from the handle amid rising trading volume, which is considered a buy signal. Trend Continuation: The pattern indicates that after a short pause, the asset is likely to continue its upward movement.
Target Calculation: The target price is often calculated by measuring the cup height and adding it to the breakout price to forecast the potential price movement.
What to Consider
The pattern can form on various timeframes, from intraday to monthly charts.
It is important to pay attention to the depth of the cup and handle, as well as the trading volume that confirms the signal.
Due to nearly 50% retrace we consider to take it up rn.
--
Best wishes,
@PandorraResearch Team

Falling wedgeThe price has made a falling wedge pattern followed by a breakout and retest, now the price looks to make a higher high and continue long
WE ONLY TRADE PULLBACKS
Comment your thoughts
DowJones resistance retest at 47548Key Support and Resistance Levels
Resistance Level 1: 47648
Resistance Level 2: 47830
Resistance Level 3: 48000
Support Level 1: 47130
Support Level 2: 47000
Support Level 3: 46867
This communication is for informational purposes only and should not be viewed as any form of recommendation as to a particular course of action or as investment advice. It is not intended as an offer or solicitation for the purchase or sale of any financial instrument or as an official confirmation of any transaction. Opinions, estimates and assumptions expressed herein are made as of the date of this communication and are subject to change without notice. This communication has been prepared based upon information, including market prices, data and other information, believed to be reliable; however, Trade Nation does not warrant its completeness or accuracy. All market prices and market data contained in or attached to this communication are indicative and subject to change without notice.


Long on Dow, expecting new highs-Dow formed bellow an inverse head and shoulders pattern, after a deep correction waiting for new highs on It

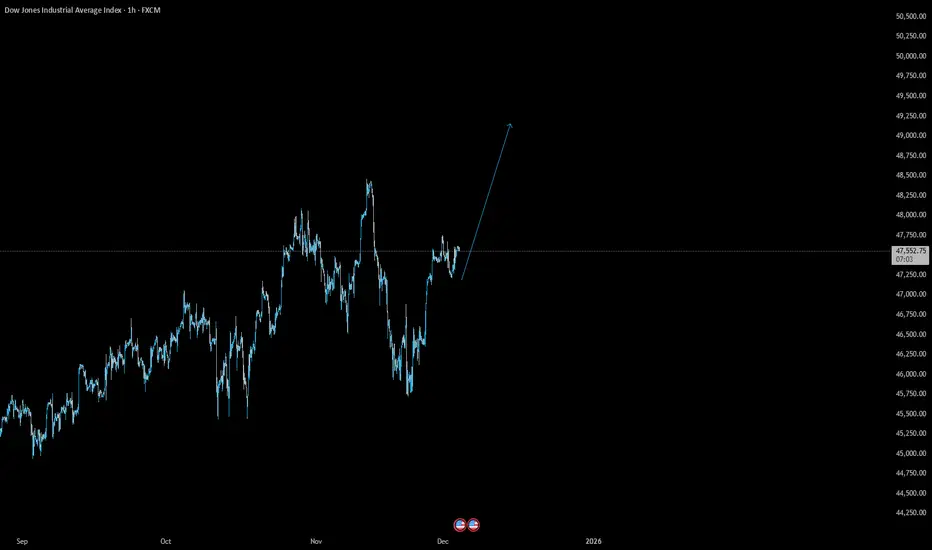
Dow Jones Geometry Signals an Explosive Move to ATHAfter the recent corrective move on the Dow Jones, the market structure remains firmly bullish.
From here, I expect momentum to resume and push toward a new **All-Time High**.
The geometry of the chart is perfectly aligned with this scenario.
Stay tuned for the next setup.

Dow jones Swing long goning to ath after one weekLast week’s setup reached full TP exactly as anticipated.
Patience, structure, and market geometry did the work once again.
For this new idea, I waited like a deer hunter — silent, focused, and disciplined — letting the market come into my kill zone, instead of chasing it.
When price finally stepped into my predefined geometry zone, the trigger was clear.
And now comes the part most traders don’t dare to say aloud:
The market will break the previous high — with certainty.
Everyone is afraid to speak with confidence in this business…
But when you understand market geometry, precision timing, and the logic behind institutional flow, you can speak with certainty.
I do.
Stay tuned — this hunt isn’t over yet.

dow jonesMy recent market prediction turned out to be extremely profitable, delivering a massive **1:82 risk-to-reward ratio**.
Unfortunately, TradingView removed the original post — but the results speak for themselves.
Stay tuned… the next analysis will be even sharper.

US30 Bullish AnalysisI'm biased for Buy in US30. In daily time frame it's showing buy for me though to be safe I have my TP 1 in the previous structure cause for sure there's going to be a lot of traders who will go short since the weekly is showing that it is going short.
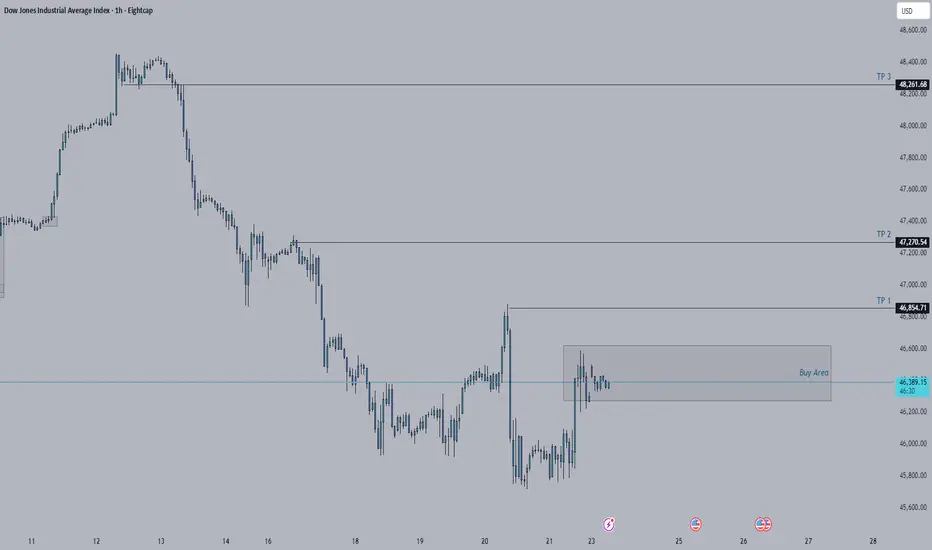
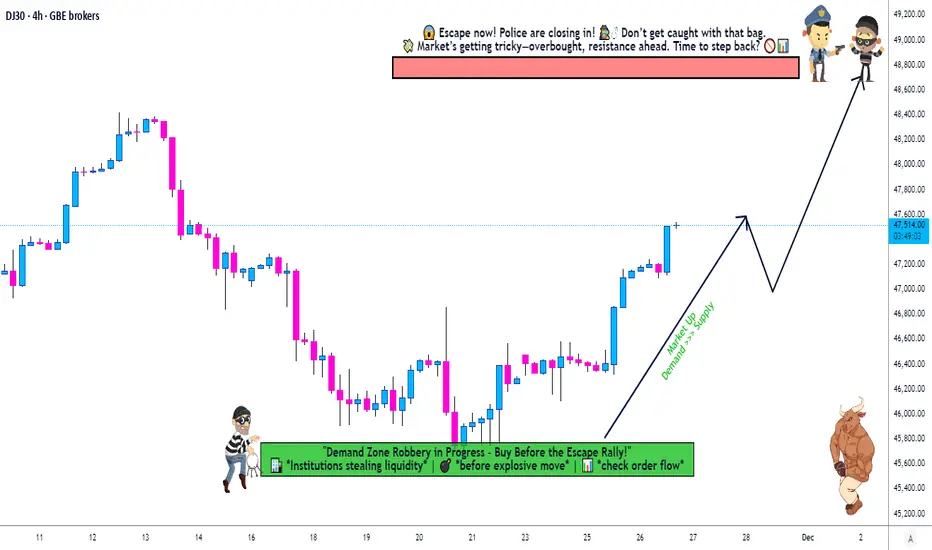
Is US30 Setting Up a Major Bullish Reversal? Layer Plan Inside🚀 US30 BULLISH SWING LAYER STRATEGY | "The Thief" Entries 🚀
BROTHERS & SISTERS OF THE MARKET! 👋 Welcome back, Thief OG's! 🦸♂️🦸♀️ A powerful Bullish setup is forming on the US30 (DOW JONES), and I'm sharing my layered entry plan to strategically position for the next leg up.
📈 Asset: US30 (Dow Jones Industrial Average)
⚡ Bias: Bullish | Style: Swing Trade
🎯 The Strategic Plan (The "Thief" Method)
This isn't a gamble; it's a calculated siege. We use a "Thief" Layering Strategy to scale into the position, reducing average entry cost and managing risk. We don't chase price; we let price come to us!
⚔️ Trade Execution Details
✅ ENTRIES (Buy Limit Layers):
We are setting multiple buy orders at key support levels. This is the core of the "Thief" method:
▶️ Layer 1: 46,400
▶️ Layer 2: 46,600
▶️ Layer 3: 46,800
▶️ Layer 4: 47,000
💡 Pro Tip: You can INCREASE or ADJUST these layers based on your capital and risk appetite.
❌ STOP LOSS (RISK MANAGEMENT):
A consolidated stop loss is placed below a major support zone to protect our capital.
➡️ SL: 46,200 (or lower based on your personal risk tolerance)
⚠️ Disclaimer (PLEASE READ): I am NOT a financial advisor. This SL is a suggestion. You MUST adjust your Stop Loss based on your own risk management strategy. Protect your capital at all costs!
🎯 PROFIT TARGET:
We are targeting a significant resistance zone where the market might see a pullback.
🎯 TP: 48,800
Rationale: This area aligns with a confluence of factors including Moving Average resistance and a potential overbought trap. The goal is to "escape with profits" before a potential reversal.
🤑 Take Note: You are free to take profits earlier! If you're in profit, you can never be wrong for taking money off the table.
🔍 Market Analysis & Key Drivers
Bullish Structure: The overall trend structure on higher timeframes remains intact.
Layered Advantage: This strategy smooths out the entry, preventing a single, potentially poor, entry point.
Risk Defined: Our maximum risk is clearly defined from the start.
🌐 Related Pairs & Correlations to Watch
Diversify your view! The US30 doesn't move in a vacuum. Keep these key assets on your watchlist:
SP:SPX (S&P 500): 🟢 High Positive Correlation. The SPX is the broader market leader. A strong SPX often pulls the DOW higher. This is your #1 confirmation.
NASDAQ:NDX (Nasdaq 100): 🟢 Positive Correlation. Tech strength can fuel overall market sentiment, but watch for divergence.
TVC:DXY (US Dollar Index): 🔴 Generally Inverse Correlation. A strengthening dollar can be a headwind for US equities. If DXY rallies sharply, be cautious.
/ES (S&P 500 Futures): 🟢 High Positive Correlation. Tracks the SPX almost tick-for-tick. Great for real-time sentiment.
✅ Conclusion
This "Thief" layered strategy provides a disciplined, low-stress approach to catching a potential US30 upswing. Remember, the market is about probabilities, not certainties.
👑 Your Capital, Your Rules. Trade Safe!
📌 Hashtags for Maximum Visibility:
#TradingView #US30 #DOW #TradingStrategy #SwingTrading #Stocks #Investing #Finance #Bullish #LayerStrategy #RiskManagement #ThiefStrategy #MarketAnalysis #SPX #DXY
👉 LIKE & FOLLOW if you found this idea helpful! Your support keeps the research coming! 💪
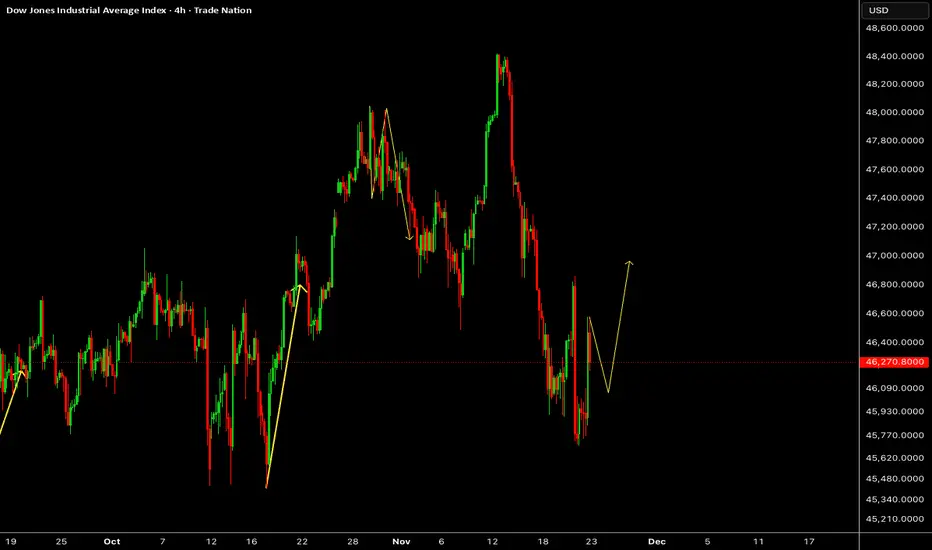
US30 – Sharp Drop Stabilising with a Potential Recovery PathAfter a pronounced downside move, price has begun to stabilise with a volatile rebound pattern forming. If this developing structure continues to hold, a gradual upward continuation scenario may unfold as sentiment attempts to shift in the coming sessions.
Disclosure: We are part of Trade Nation's Influencer program and receive a monthly fee for using their TradingView charts in our analysis.
US30 – Fake Breakout Reversal Toward 48,500 $From my market view the US30 made a fake breakout above my resistance zone
This liquidity grab trapped sellers before price quickly bounced back upward showing that buyers still control the trend
At this point I expect the market to continue pushing higher toward the 48500 $ which represents
As long as price remains above the fake-breakout zone, the bullish scenario remains valid
