US30Sales option and also purchases, it is not investment advice but it looks interesting. wait for confirmation patterns in 30 minutes
Trade ideas

US30 FREE SIGNAL|LONG|
✅US30 taps a key demand zone after a clean liquidity sweep, signaling potential displacement higher. If bullish orderflow sustains, a premium retracement toward the target zone is likely.
—————————
Entry: 46,590
Stop Loss: 46,408
Take Profit: 46,808
Time Frame: 4H
—————————
LONG🚀
✅Like and subscribe to never miss a new idea!✅

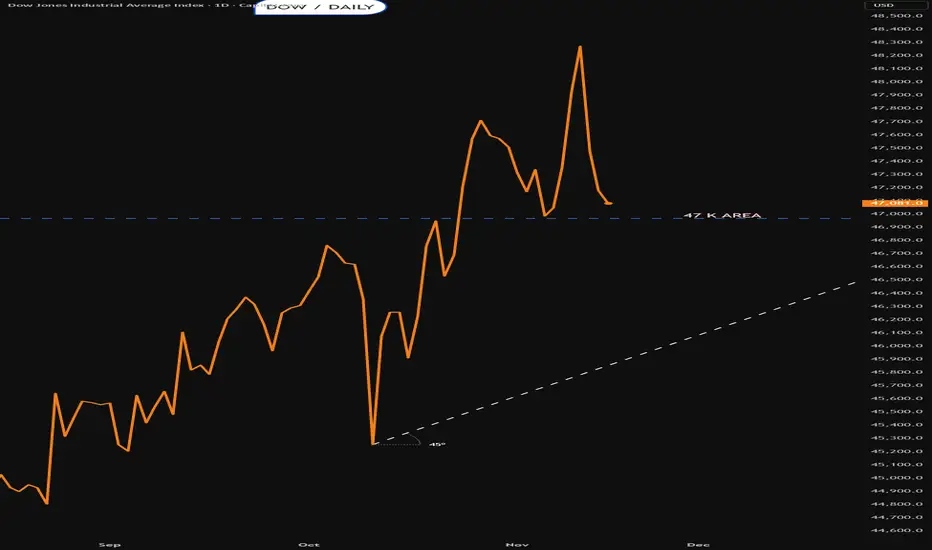
Seems like dow is continue to fall. NYSE:DOW dow is weak now. broke the previous swing and seems like it is going to continue its trajectory and keep falling.

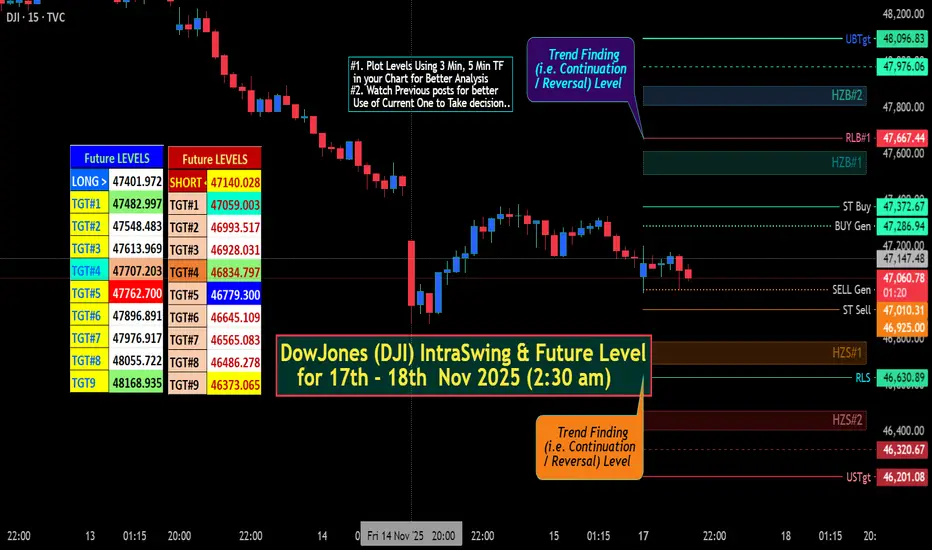
DowJones (DJI) IntraSwing & Future Level for 17th - 18th Nov 25✍🏼️ "Future IntraSwing Levels" mentioned in BOX format.
Useful to Tally / Recognize for Next day Trade Plan.
[ Level Interpretation / description:
L#1: If the candle crossed & stays above the “Buy Gen”, it is treated / considered as Bullish bias.
L#2: Possibility / Probability of REVERSAL near RLB#1 & UBTgt
L#3: If the candle stays above “Sell Gen” but below “Buy Gen”, it is treated / considered as Sidewise. Aggressive Traders can take Long position near “Sell Gen” either retesting or crossed from Below & vice-versa i.e. can take Short position near “Buy Gen” either retesting or crossed downward from Above.
L#4: If the candle crossed & stays below the “Sell Gen”, it is treated / considered a Bearish bias.
L#5: Possibility / Probability of REVERSAL near RLS#1 & USTgt
HZB (Buy side) & HZS (Sell side) => Hurdle Zone,
*** Specialty of “HZB#1, HZB#2 HZS#1 & HZS#2” is Sidewise (behaviour in Nature)
Rest Plotted and Mentioned on Chart
Color code Used:
Green =. Positive bias.
Red =. Negative bias.
RED in Between Green means Trend Finder / Momentum Change
/ CYCLE Change and Vice Versa.
Notice One thing: HOW LEVELS are Working.
Use any Momentum Indicator / Oscillator or as you "USED to" to Take entry.
⚠️ DISCLAIMER:
The information, views, and ideas shared here are purely for educational and informational purposes only. They are not intended as investment advice or a recommendation to buy, sell, or hold any financial instruments. I am not a SEBI-registered financial adviser.
Trading and investing in the stock market involves risk, and you should do your own research and analysis. You are solely responsible for any decisions made based on this research.
"As HARD EARNED MONEY IS YOUR's, So DECISION SHOULD HAVE TO BE YOUR's".
Do comment if Helpful .
In depth Analysis will be added later (If time Permits)
US30 Price ActionReasons for Long
1. Trend Bullish
2. Pattern - Inverted H&S
3. Structure - HH & HL
4. RR: 8R+
Alternative probabilities
1. Price can hunt stop loss from recent swings & give traget after stop loss hunt


Dow into the open Monday 17th NovemeberLets see if it can hold that pivot area
Poss bear traps below
Lets see
US30 Trade Set Up Nov 17 2025Price has left a daily FVG that will need to be filled this week but first i want to see a sweep of SSL or PDL followed by internal 1m-5m IFVG/CISD to target BSL

US30 Technical Breakdown – 11/17/2025📍 US30 Technical Breakdown – 11/17/2025
US30 rejected the 47,400–47,450 resistance zone, forming a clean lower high as bearish momentum starts to build. After failing to reclaim the EMA cluster, price is now heading back toward the 47,100–47,000 structure zone — a key level that determines whether downside continues or buyers step in again 👀📉.
📊 Market Behavior:
🔹 Clear rejection from the 47,450 supply zone
🔹 EMAs crossing bearish → momentum shifting downward
🔹 Lower-high structure forming → sellers gaining control
📌 Key Levels:
🔹 Resistance:
47,450 → major intraday supply / rejection point
47,300 → EMA cluster + bearish retest zone
🔹 Support:
47,111 → first bounce zone
47,000 → structural support / psychological level
46,519 → deeper demand zone
🧠 Bias:
Bearish pressure building 📉
⬇️ Break below 47,111 → opens the move toward 47,000–46,850
⬆️ Reclaim of 47,300+ → shifts momentum back to neutral

Bull US30We have the HL arround price level 46,952 created from last week correction. So price maintains its bull structure.
But we still have a resistance level around 47,298 . If price breaks through our bullish trade will be activated.
Let's keep an eye on any high impact news.

US30 LongsBias: Bullish continuation, but with caution given proximity to resistance.
Setup: If price breaks cleanly above the resistance zone with momentum (i.e., a strong bullish candle, minimal wick, decent follow-through) then a long entry is justified. Entry could be placed just above the breakout candle high.
Alternative: If price rejects the resistance zone (e.g., bearish pin bar, engulfing candle, then broken trendline) then a short counter-trend trade might be viable — but only for experienced traders with tight risk control, because the broader trend is still up.
Stop-loss: For the long trade, consider placing a stop just below the breakout candle low or below the trendline pivot, whichever is tighter. For the short trade, a stop above the recent swing high/resistance zone.
Target: For the long trade, the next logical target is the next major supply area (perhaps historical highs or measured move from the consolidation). For the short trade, target near the trendline support or prior swing lows.
The chart shows a clear uptrend over the intermediate term, with a series of higher highs and higher lows.
Price has respected key structure zones (off the weekly and daily frames) and is now approaching a significant resistance region.
Volume data is not shown, but the price action suggests momentum has been backing this move (i.e., relatively strong candles, visible follow-through after retests).

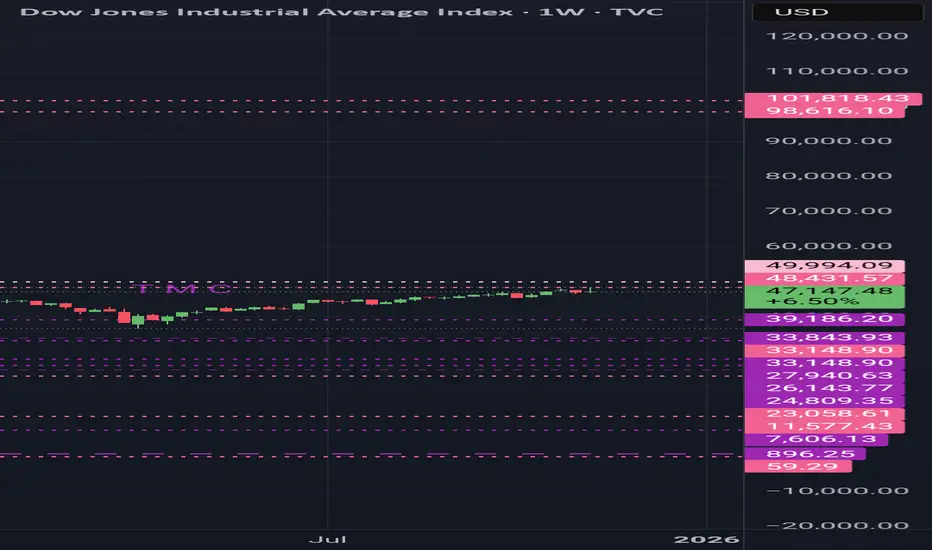
DECODED Technical Analysis DJI (DOW JONES)DECODED Technical Analysis DJI (DOW JONES)
What a remarkable historical chart
DJI, in its yearly first complete grand pattern, faces strong resistance at $48,431, the previous high, and $49,994, signaling a potential reversal. If not, corrections are at $33,843, $33,148, $27,940, $26,143, and $24,144
If the pattern restores, it could continue to test resistance at $98,616 and $101,818, completing its cycle in 2030/2031.
Lowest skip supports are at $23,000, $11,570, $1,210, and $59. These act like missing pillars; if price moves above them without testing, the structure becomes unstable, and sooner or later, the market will return to test them.
This message is for educational purposes only.
Always DYOR.
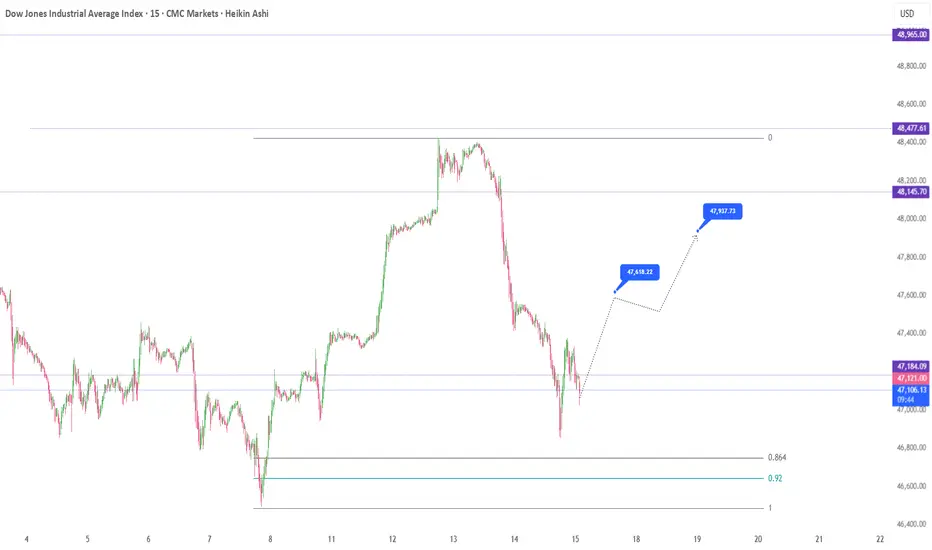
US30 - Corrective Drop Completed? Next Push Up AheadUS30 has pulled back sharply and is now forming a corrective structure near the lows.
If the current sub-waves continue to align, the next leg could be an impulsive push upward to complete the broader wave pattern. Short-term fluctuations are expected, but the wave structure as a whole still favours an upward continuation once the correction is fully completed.
Disclosure: We are part of Trade Nation's Influencer program and receive a monthly fee for using their TradingView charts in our analysis.

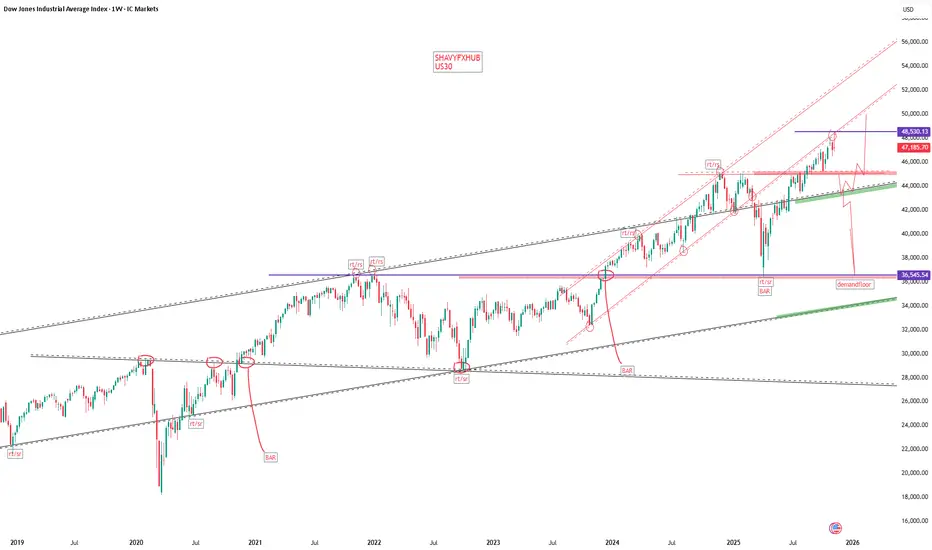
US30 WEEKLY PERSPECTIVE AND SUMMARY OF PRICEACTION FOR THE YEARUS30 rejected 48,530-4800 zone on weekly time frame ,by strategy the next demand floor will be 44,899-43,618.
the us30 rally could be calling for more correction into our psychological demand floor in the zone of 36,545.54.
the ascending trendline remain valid for sell arrangement on daily time frame .
US30 FUNDAMENTAL OUTLOOK.
The US30 is commonly referred to as the Dow Jones Industrial Average (DJIA),US30 is a stock market index that measures the performance of 30 large, publicly-owned blue-chip companies listed on stock exchanges in the United States. It is one of the most widely followed equity indices and serves as a barometer of the U.S. stock market and overall economic health.
The US30, or the Dow Jones Industrial Average (DJIA), is composed of 30 major U.S. blue-chip companies across diverse industries (excluding transportation and utilities). As of 2025, the companies making up the US30 are:
Company Names Ticker Symbol
3M Company MMM
American Express Company AXP
Amgen Inc. AMGN
Apple Inc. AAPL
Caterpillar Inc. CAT
Chevron Corporation CVX
Cisco Systems, Inc. CSCO
Dow Inc. DOW
Honeywell International Inc. HON
Intel Corporation INTC
International Business Machines (IBM) IBM
Johnson & Johnson JNJ
JPMorgan Chase & Co. JPM
McDonald's Corporation MCD
Merck & Co., Inc. MRK
Microsoft Corporation MSFT
Nike, Inc. NKE
salesforce.com, inc. CRM
The Boeing Company BA
The Coca-Cola Company KO
The Goldman Sachs Group, Inc. GS
The Home Depot, Inc. HD
The Procter & Gamble Company PG
The Travelers Companies, Inc. TRV
The Walt Disney Company DIS
UnitedHealth Group Inc. UNH
Verizon Communications Inc. VZ
Visa Inc. V
Walgreens Boots Alliance, Inc. WBA
Walmart Inc. WMT
These companies represent a cross-section of the U.S. economy, covering technology, finance, consumer goods, healthcare, industrials, and more.
How the US30 Works:
Comprises major U.S. companies across various industries (excluding transportation and utilities).
Price-weighted index, meaning companies with higher stock prices have more influence on the index’s movement.
Influences investor sentiment and is used as a benchmark for portfolio performance.
Impact of the Dollar Index (DXY) on US30:
The DXY measures the strength of the U.S. dollar against a basket of major currencies.
A stronger dollar (higher DXY) can pressure the US30 because multinational companies in the index earn revenue in foreign currencies; a strong dollar reduces those earnings when converted back to USD.
Conversely, a weaker dollar (lower DXY) tends to support the US30 by boosting the competitiveness and profitability of U.S. exporters in the index.
Impact of the US 10-Year Treasury Yield (US10Y) on US30:
The US10Y yield influences borrowing costs and investor risk appetite.
Rising yields often pressure equities like the US30 since higher bond yields increase discount rates for future corporate earnings, making stocks less attractive.
Higher yields can also signal inflation concerns or expectations of Fed tightening, which may cause market volatility.
Conversely, falling yields usually support equity markets by lowering financing costs and enhancing relative attractiveness of stocks.
Investor sentiment on the US30 often hinges on currency strength and bond market movements, reflecting economic growth and monetary policy expectations.
#us30 GOODLUCK
US30: Growth & Bullish Continuation
The price of US30 will most likely increase soon enough, due to the demand beginning to exceed supply which we can see by looking at the chart of the pair.
Disclosure: I am part of Trade Nation's Influencer program and receive a monthly fee for using their TradingView charts in my analysis.
❤️ Please, support our work with like & comment! ❤️

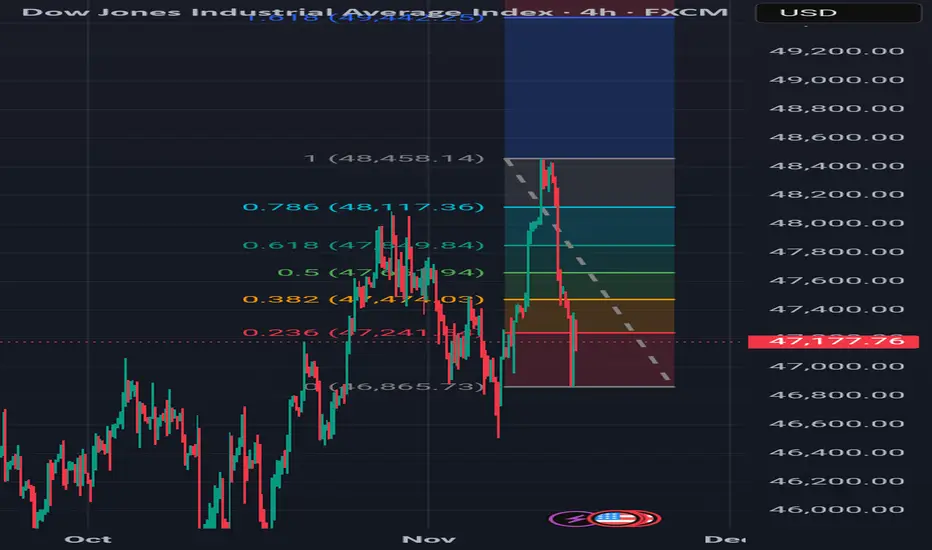
US30 4H CHART IN MOTION US30 4H | Smart Money Setup in Motion
Price retraced sharply from recent high into 0.236 Fib zone (47,324).
Expecting inducement sweep into 0.5/0.618 zone (47,899–48,134) before reversal or deeper liquidity grab.
If price sweeps 0.618 and leaves bullish PA (engulfing, FVG, BOS), that’s my POI for tactical long.
Break below 46,924 invalidates setup.
Bias: Bullish if sweep + confirmation. Bearish if rejection holds at 0.236.
Trade what you see, not what you feel.
Follow for daily setups → @mishlova
Would you take this long? Let’s talk setups
NeoSetups #SmartMoney #US30 #LiquiditySweep #Fibonacci #TradingViewIdeas
US30 overall bullishOn the 4HR, US30 was in an uptrend, made a high, higher low, higher high, HL, HH, then equal lows, then we broke a high, made a new high, pulled back and tapped into demand. We got bearish wick rejection candle to start going up but before that we also have 2 confluences for a sweep of liquidity at demand with a trendline and equal lows and we're getting bearish candles on the 2HR and every time frame to the 15 min to get that sweep before rising. I'm bearish first for the sweep and then bullish for overall uptrend move.

us30 4h🔹 Overall Outlook and Potential Price Movements
In the charts above, we have outlined the overall outlook and possible price movement paths.
As shown, each analysis highlights a key support or resistance zone near the current market price. The market’s reaction to these zones — whether a breakout or rejection — will likely determine the next direction of the price toward the specified levels.
⚠️ Important Note:
The purpose of these trading perspectives is to identify key upcoming price levels and assess potential market reactions. The provided analyses are not trading signals in any way.
✅ Recommendation for Use:
To make effective use of these analyses, it is advised to manually draw the marked zones on your chart. Then, on the 15-minute time frame, monitor the candlestick behavior and look for valid entry triggers before making any trading decisions.


US30 Set To Grow! BUY!
My dear subscribers,
My technical analysis for US30 is below:
The price is coiling around a solid key level - 47178
Bias - Bullish
Technical Indicators: Pivot Points High anticipates a potential price reversal.
Super trend shows a clear buy, giving a perfect indicators' convergence.
Goal - 47528
About Used Indicators:
By the very nature of the supertrend indicator, it offers firm support and resistance levels for traders to enter and exit trades. Additionally, it also provides signals for setting stop losses
Disclosure: I am part of Trade Nation's Influencer program and receive a monthly fee for using their TradingView charts in my analysis.
———————————
WISH YOU ALL LUCK

DowJones The Week Ahead Key Trading LevelsKey Support and Resistance Levels
Resistance Level 1: 47447
Resistance Level 2: 47570
Resistance Level 3: 47673
Support Level 1: 46985
Support Level 2: 46820
Support Level 3: 46708
This communication is for informational purposes only and should not be viewed as any form of recommendation as to a particular course of action or as investment advice. It is not intended as an offer or solicitation for the purchase or sale of any financial instrument or as an official confirmation of any transaction. Opinions, estimates and assumptions expressed herein are made as of the date of this communication and are subject to change without notice. This communication has been prepared based upon information, including market prices, data and other information, believed to be reliable; however, Trade Nation does not warrant its completeness or accuracy. All market prices and market data contained in or attached to this communication are indicative and subject to change without notice.

