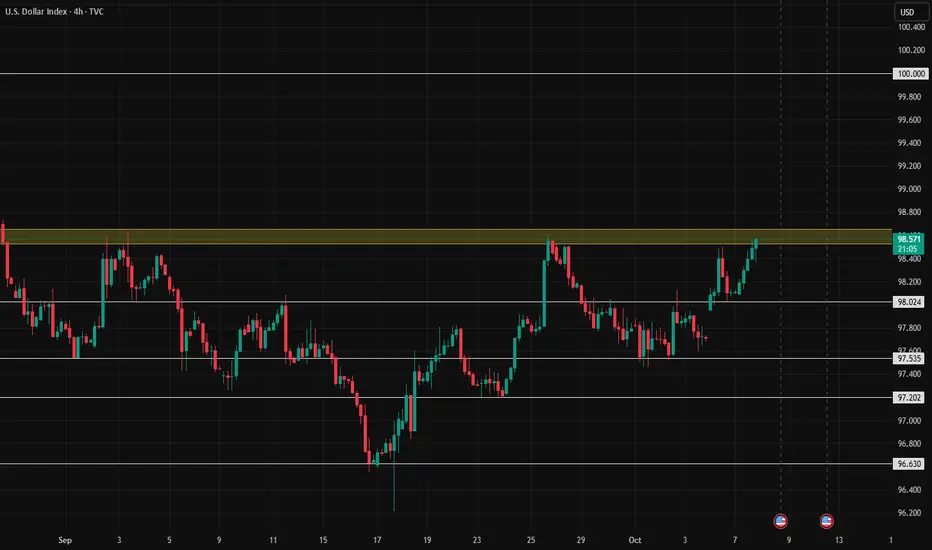
DXY BULLSDXY is currently sitting on a third touch of the trendline and we have a possible Fibonacci, consolidation,200 sma indicating bullish a breakout would take us to 104
Trade ideas

Dxy | Dollar indexSpecified lower low is a signal for bearish market but price needs a fake out before that.

U.S. Dollar Index: Wave C Downtrend Targeting New LowsTVC:DXY CAPITALCOM:DXY
📉 U.S. Dollar Index (DXY) – Wave C in Progress
The DXY remains in a corrective phase after completing Wave B₂.
A clear A–B–C structure is unfolding, with the current move forming the final Wave C.
The recent flag pattern (A–B–C–D–E) suggests a potential continuation to the downside.
A break below 98.86 would confirm the start of Wave 5 of C, targeting the 95.4 → 94.3 support zone.
Elliott Wave Overview:
Wave A: completed
Wave B₂: expanded flat
Wave C: unfolding with 1–4 structure complete
Key Levels:
🔹 Resistance: 99.75
🔹 Confirmation Sell: 98.86
🔹 Targets: 96-95-94-93
Bias remains bearish while price trades below 99.75.

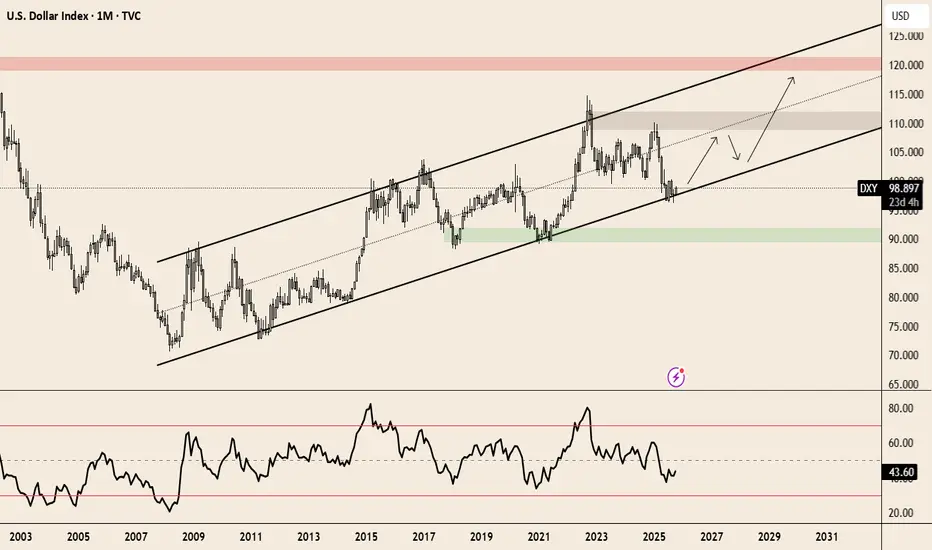
$DXY at a key level: the dollar could reclaim its role as a safeTVC:DXY is currently at a key level.
Historically, when markets enter a phase of euphoria and everything rises simultaneously — TVC:SPX equities, TVC:GOLD gold, CRYPTO:BTCUSD crypto — the dollar tends to reassert itself as a safe-haven asset.
With major indices and technical indicators showing overbought conditions, and employment data beginning to weaken, a flight to safety into TVC:DXY over the coming months wouldn’t be surprising.
Moreover, the rate spread between the U.S. and Europe remains wide: the TVC:US10Y 10-year Treasury hovers around 4.3%, while the TVC:DE10Y German Bund stays near 2.3%.
This gap continues to attract capital flows toward dollar-denominated assets, reinforcing the greenback’s appeal even amid expectations of moderate rate cuts in 2025.
In our view, it’s worth holding liquidity and/or equivalents over the next few years to seize potential opportunities from a market crash or sell-off should the FED be forced to cut rates in the current environment of economic slowdown.
Move toward 100The Dollar Index has finally signaled a move toward the 100 zone, and we expect it to reach this important level in the next few days.

This is a quick follow up from early this morningI was freaking out over the pattern and the dxy and then it occurred to me that every time I do a trade and I want to get out of it... I basically get back into the dollar by default.... And that may be the reason the dollar is doing so badly is that there are a group of sharp traders exiting the gold and silver because they may understand that there is a reversal pattern and that they should liquidate their position in the gold and silver contracts...... This is clearly hypothetical in any case... I think there is value to the video that I did this morning and I hope that you take a look at it.

DXY: Will Go Down! Short!
My dear friends,
Today we will analyse DXY together☺️
The recent price action suggests a shift in mid-term momentum. A break below the current local range around 98.437 will confirm the new direction downwards with the target being the next key level of 98.260 and a reconvened placement of a stop-loss beyond the range.
❤️Sending you lots of Love and Hugs❤️

DXY ready to continue lower, buy EURUSD and coDxy has taken liquidity Buyside liquidity and it is now ready to continue lower. I was bullish till this point, I've now turned bearish.
There are many reason for this analysis, 3 drive pattern, buyside liquidity purge, 4hrs BOS with displacement
TP 1 @ 98.1
TP 2 @ 97.45
TP 3 @ 96.2
Trade accordingly
Dxy will still turn bullish, I will update you then... Enjoy

US Dollar: Wait For The +BOS, Then Buy It!Welcome back to the Weekly Forex Forecast for the week of Oct 6 - 10th.
In this video, we will analyze the following FX market: USD Dollar
The USD is technically still bearish, trying to find support for higher prices. A US government shutdown is not helping that case! However, personally, I am still looking toward the upside.
Price is still holding at a bullish discount array, an +OB. As long as the +OB is respected, I am looking for higher prices.
A bearish BOS will make looking for higher prices invalid.
So, let the market show its bias before entering a trade. Look for the confirmations to its direction.
Don't take trades inside the middle of consolidations!
Wait and react. Do not predict.
Enjoy!
May profits be upon you.
Leave any questions or comments in the comment section.
I appreciate any feedback from my viewers!
Disclaimer:
I do not provide personal investment advice and I am not a qualified licensed investment advisor.
All information found here, including any ideas, opinions, views, predictions, forecasts, commentaries, suggestions, expressed or implied herein, are for informational, entertainment or educational purposes only and should not be construed as personal investment advice. While the information provided is believed to be accurate, it may include errors or inaccuracies.
I will not and cannot be held liable for any actions you take as a result of anything you read here.
Conduct your own due diligence, or consult a licensed financial advisor or broker before making any and all investment decisions. Any investments, trades, speculations, or decisions made on the basis of any information found on this channel, expressed or implied herein, are committed at your own risk, financial or otherwise.

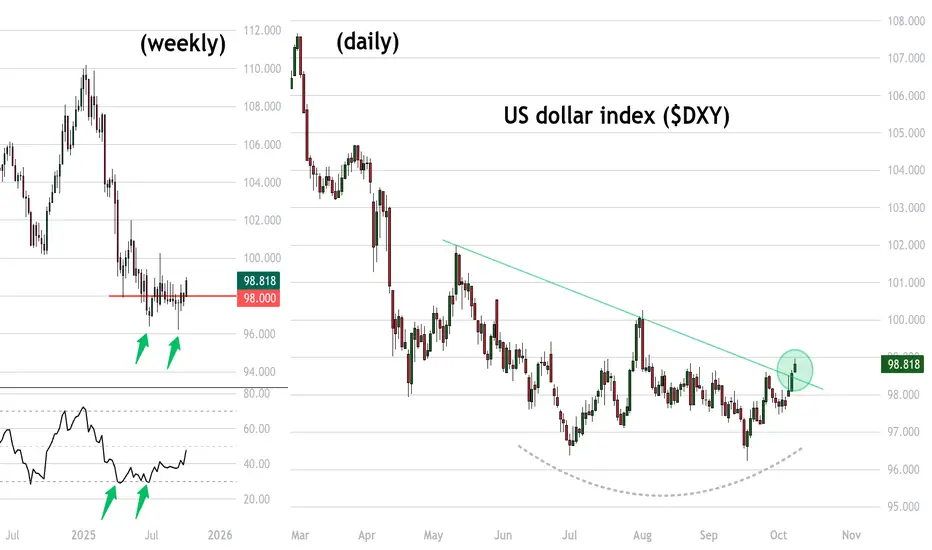
DXY – The Road to 100 Looks ClearIn my previous analysis on DXY, I mentioned that as long as the 97.60 zone holds, there are strong chances for an upside move and a possible test of the 100 level.
Indeed, the index reversed perfectly from that support area and has now broken above the interim resistance around 98.60, trading close to 99 at the time of writing.
Over the last three sessions, DXY has also completed an inverted Head & Shoulders pattern, with the neckline breakout confirming the bullish structure.
From here, the path toward the 100 zone appears clear and technically justified.
I maintain a bullish bias for the U.S. Dollar Index, which naturally implies a bearish outlook for EURUSD and GBPUSD in the short term.

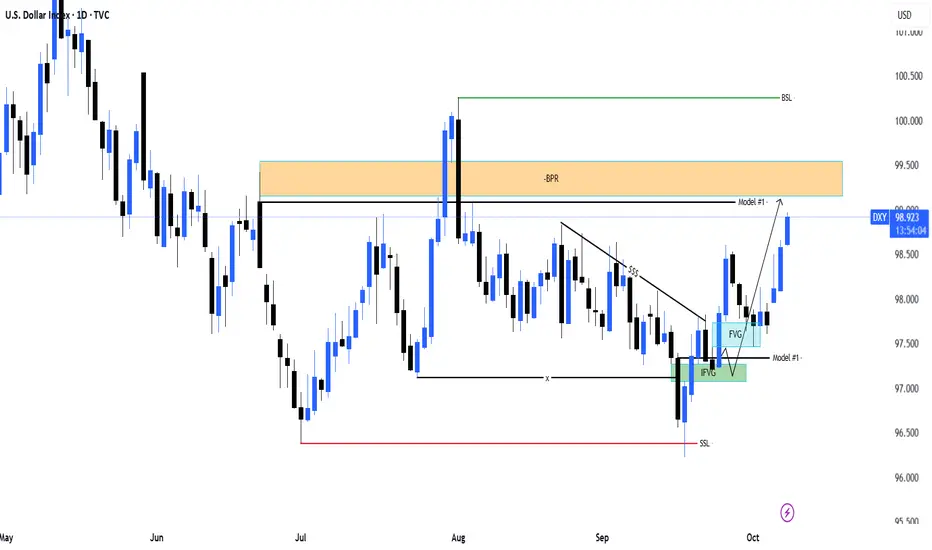
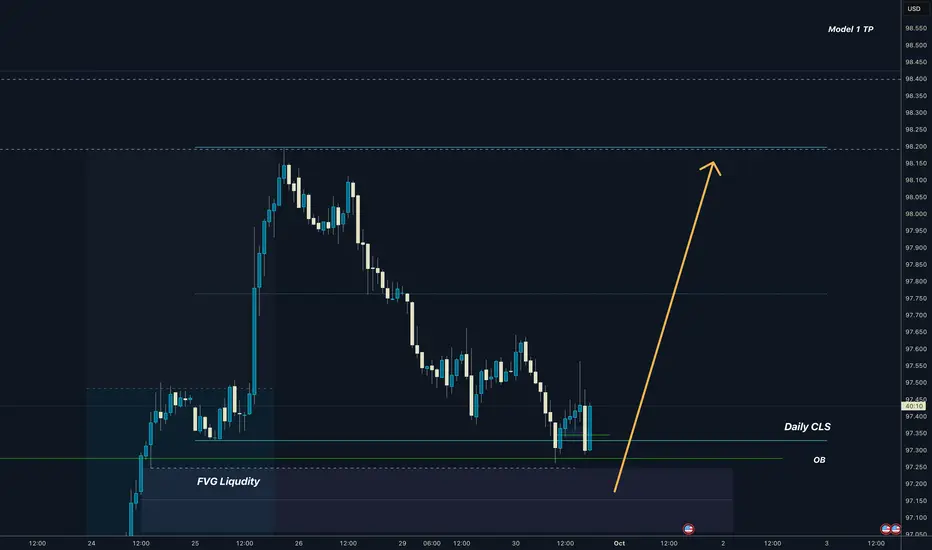
DXY Target Achieved | Smart Money Model #1 Playing Out PerfectlyHello Billionaires!!
In DXY D1 Projection we know the bullish projection on DXY played out exactly as expected.
Price swept the short-term sell-side liquidity (SSL), filled the IFVG, and then launched upward through the FVG, completing the Model #1 structure.
Currently, price is trading inside the BPR (Balanced Price Range), showing that the target zone has been successfully reached.
🧠 Smart Money Logic:
SSL sweep → Market Structure Shift
IFVG + FVG = Strong Reaccumulation
Price delivered to BPR (Premium Zone)
Model #1 completion confirms bullish delivery
Now I’ll be watching for potential reaction or retracement from this premium zone before the next move develops.
#DXY #SmartMoneyConcepts #PriceAction #ICT #Forex #Liquidity #BPR #FVG #IFVG

Yes Gold just broke $4K.. but check out the USD (bottom?)Gold is naturally getting all the attention after breaking over $4000 fir the first time
But meanwhile the US dollar looks like its bottoming out.
DXY - the dollar index - not had much interest in breaking below 98
Bullish DXYPotential Inverted Head and Shoulders display.
Am very Bullish on USD Index right now and Bearish on most xxx/USD pairs.

DXY H4 CHARTWe are looking price making a rally targeting the marked supply area of the LTF price structure. It is important to note the many retail traders are coming into the market at this current price area which is late according our strategy.
this rally in price will have a huge impact to the drop of the GOLD which is long over due. We will monitor the price action for better entry given price drops targeting our LTF DEMNAD AREAS.
08.10.25 Morning ForecastPairs on Watch -
FX:GBPUSD
FX:EURUSD
A short overview of the instruments I am looking at for today, multi-timeframe analysis down to what I will be looking at for an entry. Enjoy!

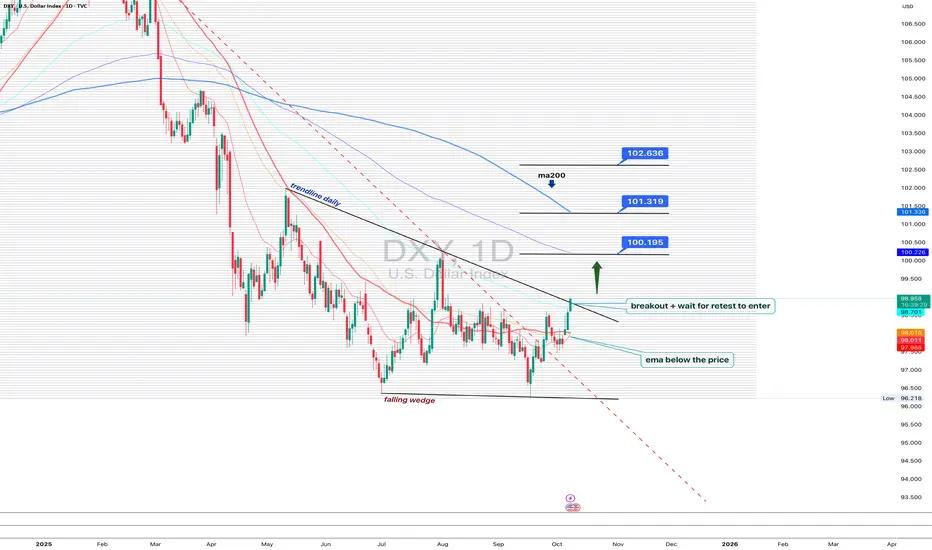
DXY 1D - dollar waking up, but patience is keyOn the daily chart, the US Dollar Index is showing the first signs of recovery: a falling wedge breakout and trendline breach hint that bulls are slowly reclaiming control. Price has moved above the EMA, a short-term bullish signal.
Still, MA200 remains above, reminding us that the broader trend is not yet flipped. The ideal play here - wait for a retest of the breakout trendline to confirm buyers’ strength before jumping in.
If price holds above 99.70, the next upside targets sit around 100.19, 101.31, and 102.63.
But keep in mind - DXY loves to test patience. False breakouts are its favorite sport.
Right now, the dollar looks ready to wake up, but maybe hit the snooze button one last time before the real move begins.
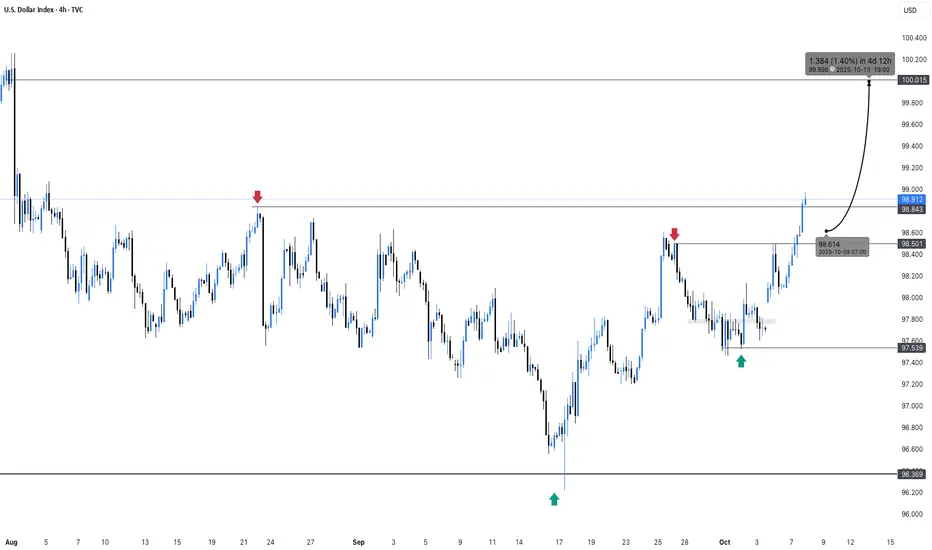
US DOLLAR TARGETS HITThe U.S. government is still shut down, so no fresh economic data is coming out. That means everyone’s trading half-blind right now—no jobs numbers, no inflation updates, just noise. But the chart still tells the truth. All the bullish dollar targets were hit exactly as planned, and now price is sitting right under that 99.8 key high. That’s the line that decides everything. If market makers push price higher than 99.8, the bullish phase stays alive a bit longer. If it fails there, we drop back into bearish discount territory, where value sits lower and sellers regain control.
Over the past four months, liquidity’s been building above those highs. Now we’re watching a classic stop run—price pushing up to take out weak hands before the real move begins. That’s why cross markets like stocks, gold, and crypto are slipping. The dollar’s acting as a safe spot while everything else bleeds. But the volume looks thin, which usually means manipulation, not genuine demand.
Without the usual USD data, it’s all a guessing game until the Fed minutes drop later today. For now, it’s simple: the 99.8 zone is the make-or-break level. Stay patient, read the structure, and let the chart talk. Price always moves to where orders are missing, and stops where they’re full. Follow that rule, and you’ll never feel lost in the noise.

DOLLARThe dxy rally into 99,187 will be watched for rejection, this price action could give USDJPY ,EURUSD ,GBPUSD,AUDUSD AND NZDUSD a good trade opportunity.

DXY 30 SEPTEMBER 2025 BEFOREAnticipating the potential for Bullish DXY :
1. Looking for support to form around the key levels within a key trading session , should support fail to form at the key levels price could drop below 91.199
2. Should we get rapid and aggressive movement away from the key level i will target the recent Swing high at 98.605 for profit taking

Dollar I Daily CLS I Manipulation I Bullish HTFDollar just manipulated Daily CLS range while HTF bias is nicely bullish
Im still open to the dip to FVG before it goes higher
Big picture view
Adapt useful , Reject useless add what is specifically your own.
Trade safely
Dave
Dollar Index analysisThe Dollar Index has quite an interesting chart — on the higher cycle, it’s clearly bearish, while on the lower cycles, it’s showing bullish movement. This situation can significantly increase trading risk, making stop-outs more likely, especially on the Dollar Index itself and even more so on EUR/USD.
Right now, we need to see whether it can finally break through the resistance it’s been struggling with for several months and reach 100, or not. ✅