DXY | Boxed In Between 96.60 & 97.20 – Powell Holds the KeyThe dollar softened in line with expectations, shrugging off hawkish Fed remarks. With DXY caught between 96.60 support and 97.20 resistance, Powell’s speech tonight could set the tone—further downside if dovish, or consolidation if steady.
Trade ideas

H4 DXY Market UpdateRight now, DXY is showing signs of indecision. No clear direction has been established yet.
I’m currently waiting for price to move towards one of the Turning Points (TNP) — either TNP A (resistance) or TNP B (support) — before making any trading decisions.
For now, I’ve set alerts at both zones and will keep monitoring closely.

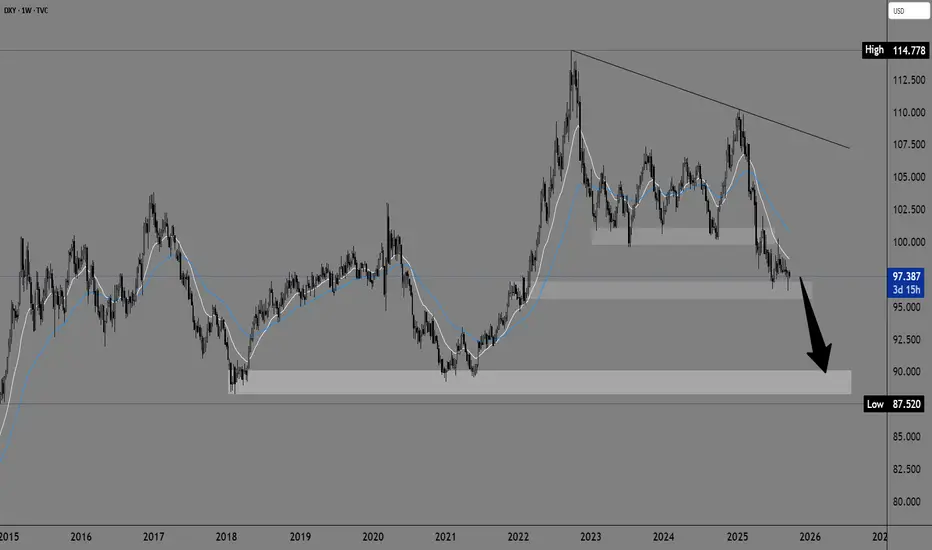
Dollar index on the bearish sideCould the dollar index slip below 95.00? The chances of such a thing are increasing. The pressure is slowly moving into that zone, we just need a stronger bearish impulse to start the process. A large support zone at the 90.00 level.
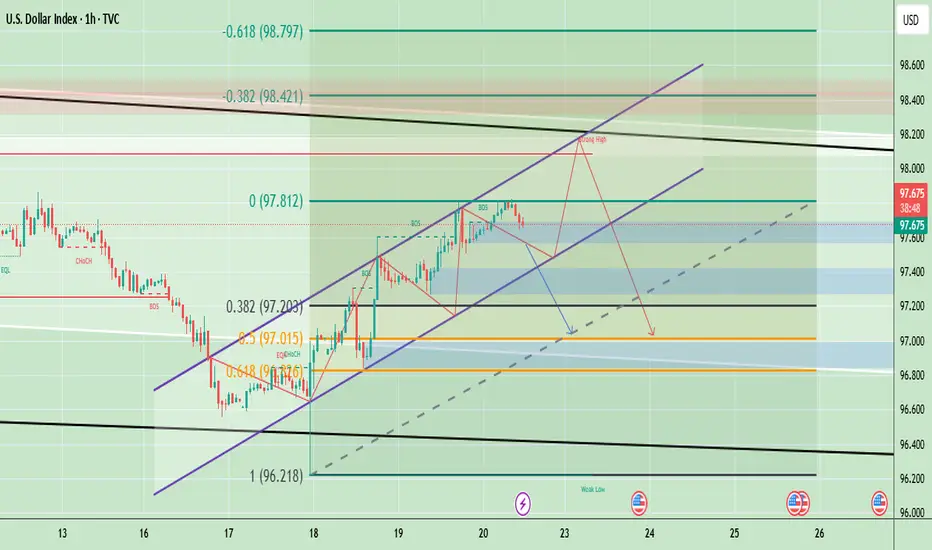
Dollar Index Resistance & Support AnalysisDXY (U.S. Dollar Index) is trading around 97.71, holding within an upward channel after bouncing from the 97.00–97.10 support zone. The structure shows a series of higher highs and higher lows, indicating short-term bullish momentum. However, the chart also highlights a potential “strong high” area near 98.20–98.40, where resistance from both Fibonacci retracement levels and channel tops converge. If DXY fails to break above this resistance, a retracement toward 97.20–97.00 is likely, with further downside risk toward 96.80 if that support breaks.
Based on the current setup, short-term upside toward 98.20–98.40 is possible, but overall bias suggests a likely pullback (downside) after testing resistance, especially if momentum weakens near the channel top.
🔴 Sell Zone (Short Setup)
- Sell Zone (Resistance area): 98.20 – 98.40
- Sell Trigger: If price tests and rejects this zone with bearish candles (reversal signals).
🟢 Buy Zone (Long Setup)
- Buy Zone (Support area): 97.20 – 97.30
- Buy Trigger: If price holds above this zone and shows bullish reversal candles (hammer, engulfing, etc.).
Note
Please risk management in trading is a Key so use your money accordingly. If you like the idea then please like and boost. Thank you and Good Luck!
dxy sep 23
if bos and other key statistic of mine failed to hold and probably price will hammered down. During Ny session expeccting consolidation espacially in xausd.

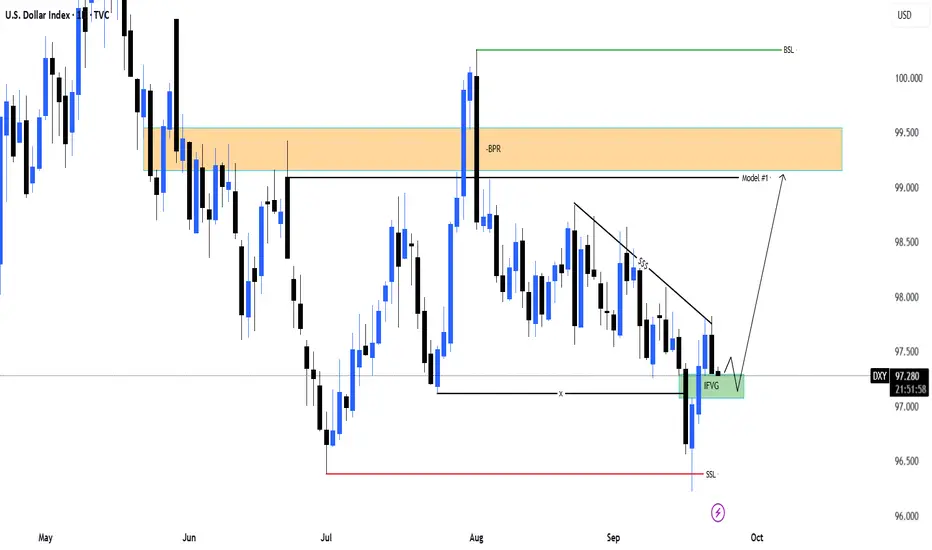
DXY | Bullish Reversal from IFVG – Targeting 99.50 Supply ZoneHello Billionaires!!
In DXY D1 Projection we know The US Dollar Index has tapped into the Imbalance/Fair Value Gap (IFVG) and shown signs of bullish reaction after sweeping Sell-Side Liquidity (SSL). This aligns with a potential reversal model aiming towards higher liquidity levels.
🔹 Key Points:
SSL swept, confirming liquidity grab.
Price reacting from IFVG as demand zone.
Short-term retracement expected, followed by continuation.
Targeting the BPR supply zone around 99.50 and eventually Buy-Side Liquidity (BSL) above 100.00.
As long as DXY holds above the IFVG zone, bullish continuation remains the primary outlook.
Bearish drop off?The US Dollar Index (DXY) has rejected off the pivot and could drop to the 1st support.
Pivot: 97.85
1st Support: 96.61
1st Resistance: 98.70
Disclaimer:
The above opinions given constitute general market commentary, and do not constitute the opinion or advice of IC Markets or any form of personal or investment advice.
Any opinions, news, research, analyses, prices, other information, or links to third-party sites contained on this website are provided on an "as-is" basis, are intended only to be informative, is not an advice nor a recommendation, nor research, or a record of our trading prices, or an offer of, or solicitation for a transaction in any financial instrument and thus should not be treated as such. The information provided does not involve any specific investment objectives, financial situation and needs of any specific person who may receive it. Please be aware, that past performance is not a reliable indicator of future performance and/or results. Past Performance or Forward-looking scenarios based upon the reasonable beliefs of the third-party provider are not a guarantee of future performance. Actual results may differ materially from those anticipated in forward-looking or past performance statements. IC Markets makes no representation or warranty and assumes no liability as to the accuracy or completeness of the information provided, nor any loss arising from any investment based on a recommendation, forecast or any information supplied by any third-party.

Dollar Index drop at the start of the weekAfter last week’s high volatility due to major news — which gave the dollar a slight upward move — today, at the start of the week, it turned bearish. The channel it had managed to break after a long time now seems to be retesting, and so far it looks like it may fall back inside.
Overall, the dollar’s trend remains bearish, and taking long positions isn’t logical until we clearly see strong bullish signals. ✅

DOLLAR INDEX DXY WEEKLY ANALYSISDXY is trading near 97.70, attempting a rebound from the 96.90–97.00 support zone (since last week), aligned with the 0.382 Fibonacci retracement.
Prices are facing a confluence of resistance including fib level 0.786 & middle Bollinger band near 97.70 towards approaching the falling trendline resistance around 98.00–98.10, which will be a key inflection level for direction.
RSI has bounced from near-oversold (45 zone) and is pointing higher, suggesting mild bullish momentum in the short term.
On the downside, a failure to hold 97.40 (fib level 0.618) could extend weakness toward 96.90, towards the falling trendline support.
This week’s heavy US data calendar (Powell’s speech, PMIs, GDP, PCE) could provide catalysts for a breakout move.
Overall, bias is neutral-to-bullish in the short term unless 97.40 - 97.00 zone is breached decisively.

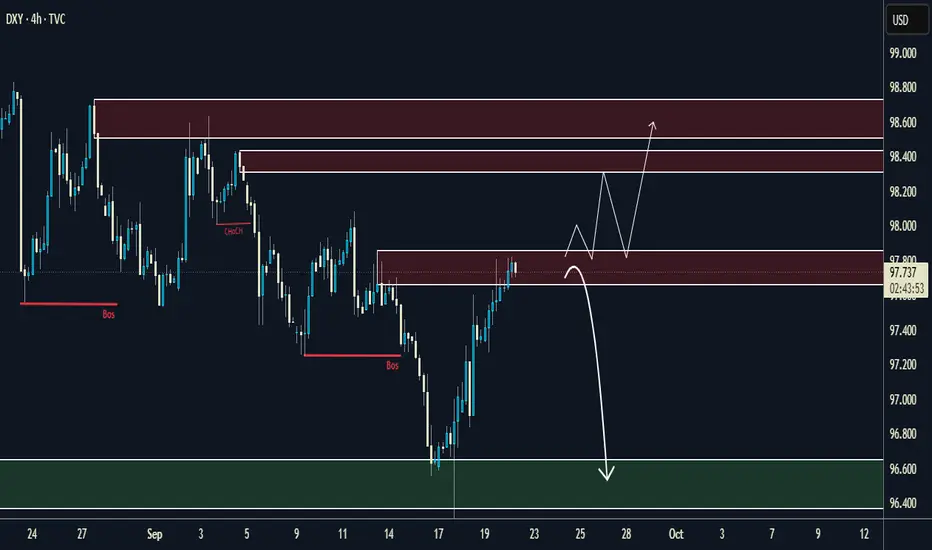
DXY 4H Outlook – Key Levels & Potential Scenarios💡 DXY 4H Outlook – Key Levels & Potential Scenarios
Price is currently testing an important supply zone (97.7 – 98.0) after showing a strong recovery. From here, I’m watching two possible outcomes:
🔼 Bullish Scenario
If buyers manage to hold above the 97.7 – 98.0 supply zone, we could see continuation toward the next major resistance between 98.2 – 98.6.
Break & retest of 98.0 would be a strong confirmation for buyers.
🔽 Bearish Scenario
If the 97.7 – 98.0 area rejects strongly, price could reverse back down toward the demand zone (96.4 – 96.6) for liquidity grab.
This zone has previously acted as a strong reaction point.
⚔️ Key Levels to Watch
Resistance: 98.0 | 98.2 | 98.6
Support: 97.4 | 96.6
📊 This setup gives both bulls and bears opportunities depending on how price reacts at these zones.
✅ If you enjoy this type of analysis, make sure to follow me so you don’t miss the next updates.
💼 For those who want account management services (personal or funded accounts), feel free to reach out – I can help you grow consistently with risk management and proven strategies.
DXYU.S Dollar Index
- Falling Wedge as an corrective pattern in Short Time Frame
- RSI - Divergence
- Completed " 1234 " Impulsive Waves
- Fibonacci Level - 38.20% - 50.00%
- S / R Level

DXY(Dollar Index Currency)We looking for a bullish momentum to the upside as the market has created a continuation to the upside resulting buying opportunities| 4H Timeframe

possibility of uptrend The corrective pattern is expected to end and we will see the start of an uptrend. A break of the resistance trend line will be a confirmation of the uptrend.
If the index breaks through the support area, a downtrend scenario will be likely.

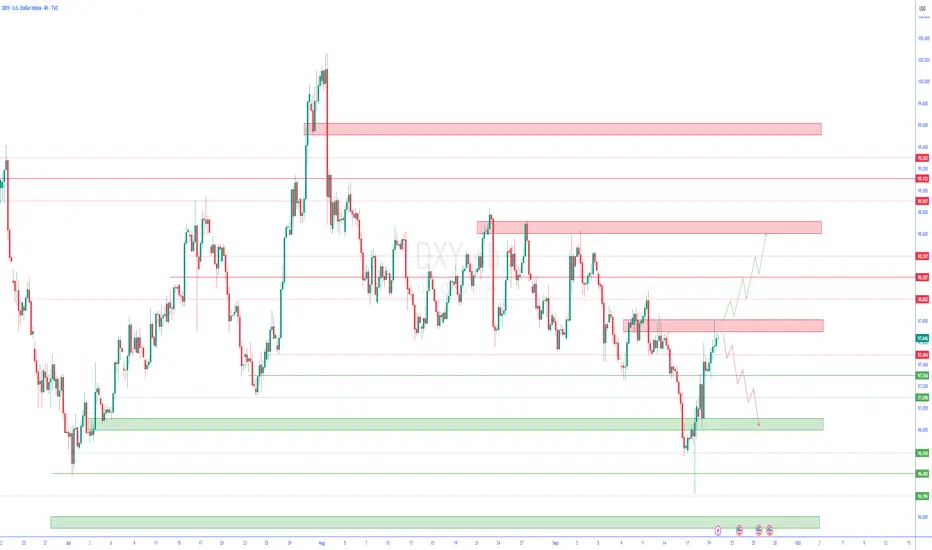
US DOLLAR War Map stays simple right nowThe dollar’s been sliding for months, but we finally saw the range lows taken out after the FOMC spike, and that sets up the next move.
Here’s how I’m reading it:
Rotation lower is still the logical path unless politics or surprise news change the game.
On the DXY chart, I’m watching for a heavy-volume node to act as a target for a short-term pullback higher.
For cross-pairs, that means I’ll look for short setups while using the recent bullish dollar lows as day-to-day reference points.
Key level to watch: around 98.7, where heavy bearish order-flow has been building.
If the market keeps moving, it’s a straightforward trade plan: stay positive, take intraday signals, and let the bigger down-cycle play out.
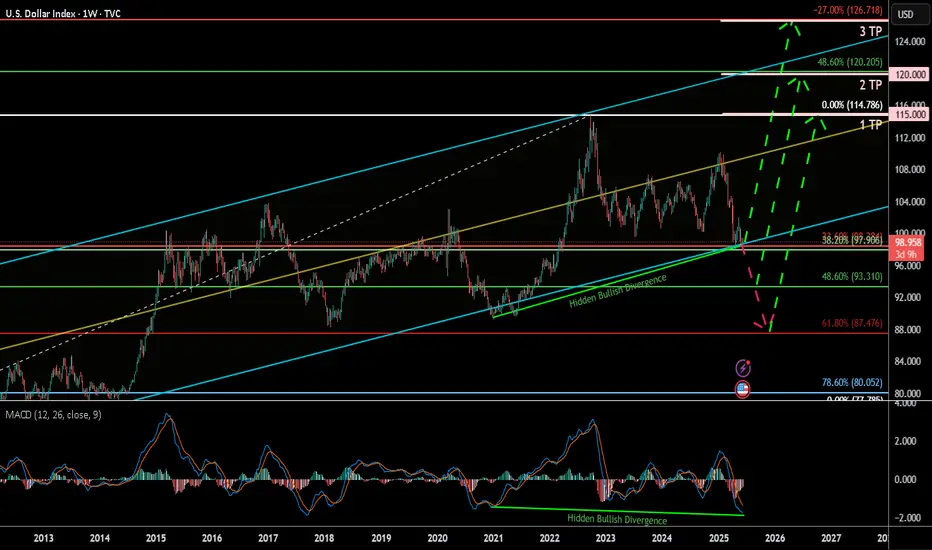
U.S. Dollar Index (DXY) Weekly 2025Summary:
The U.S. Dollar Index (DXY) has corrected down to the key 38.60% Fibonacci retracement zone and is currently showing signs of a potential bullish reversal, bolstered by a clear hidden bullish divergence on the MACD. This may signal a renewed rally toward key upside targets, especially if the 93.3–99.9 support Zone holds.
Chart Context:
Current Price: 98.864
Key Fib Support: 38.60% @ 99.906, 48.60% @ 93.310, 61.80% @ 87.476
Support Zone: 93.3–99.9 USD
Hidden Bullish Divergence: Observed both in 2021 and now again in 2025 on the MACD
Trendline Support: Long-term ascending trendline holding since 2011
Fib Extension Targets (Trend-Based):
TP1: 115.000
TP2: 120.000
TP3: 126.666
Key Technical Observations:
Fibonacci Confluence: DXY is bouncing from a strong Fib cluster between 93.310 and 99.906, historically acting as a reversal zone.
Hidden Bullish Divergence: Suggests potential upside despite price weakness.
Downtrend Retest: Price may revisit 93.3–87.4 before confirming full reversal.
Breakout Pathway: Green dashed arrows outline the likely recovery trajectory toward 114–126 range.
Indicators:
MACD: Showing hidden bullish divergence and potential signal crossover.
Trendline Support: Holding intact from 2021 low.
Fib Levels: Used for retracement and trend-based extension.
Fundamental Context:
Interest Rate Outlook: If U.S. inflation remains controlled and Fed signals future hikes or sustained high rates, DXY strength may persist.
Global Liquidity & Recession Risk: If risk aversion returns, the dollar may rise as a safe haven.
Geopolitical Risks: Conflicts, trade tensions, or BRICS dedollarization efforts may create volatility.
Our Recent research suggests the Fed may maintain higher-for-longer rates due to resilient labor markets and sticky core inflation. This supports bullish USD bias unless macro shifts rapidly.
Why DXY Could Continue Strengthening:
Robust U.S. economic performance & monetary policy divergence
U.S. GDP growth (~2.7% in 2024) outpaces developed peers (~1.7%), supporting stronger USD
The Fed maintains restrictive rates (4.25–4.50%), while the ECB pivots to easing, widening the policy and yield gap .
Inflation resilience and Fed hawkishness
Labor markets remain tight, keeping inflation “sticky” and delaying expected rate cuts; market-implied cuts for 2025 have been pushed into 2026
Fed officials (e.g. Kugler) emphasize ongoing tariff-driven inflation, suggesting rates will stay elevated.
Safe-haven and yield-seeking capital flows
With global risks, capital favors USD-denominated assets for yield and stability
Why the Dollar Might Face Headwinds
Fiscal expansion & trade uncertainty
Ballooning U.S. deficits (~$3.3 trn new debt) and erratic tariff policy undermine confidence in USD
Wall Street’s consensus bearish position.
Major banks largely expect a weaker dollar through 2025–26. However, this crowded bearish sentiment poses a risk of a sharp rebound if data surprises occur
barons
Tariff policy risks
Trump's new tariffs could dampen dollar demand—yet if perceived as fiscal stimulus, they could unexpectedly buoy the USD .
Synthesis for Our Biases
A bullish DXY thesis is well-supported by:
Economic and policy divergence (U.S. growth + Fed vs. peers).
Hawkish Fed commentary and sticky inflation.
Safe-haven capital inflows.
Conversely, risks include:
Deteriorating fiscal/trade dynamics.
Potential Fed pivot once inflation shows clear decline.
A consensus that could trigger a short squeeze or reversal if overstretched.
Philosophical / Narrative View:
The dollar remains the world’s dominant reserve currency. Periodic dips often act as strategic re-accumulation phases for institutional capital—especially during global macro uncertainty. A return toward 120+ reflects this persistent demand for USD liquidity and safety.
Bias & Strategy Implication:
1. Primary Bias: Bullish, contingent on support at 93.3–99.9 holding.
2. Risk Scenario: Breakdown below 93.3 invalidates bullish thesis and targets 87.4–80 zones.
Impact on Crypto & Gold and its Correlation and Scenarios:
Historically, DXY has had an inverse correlation to both gold and crypto markets. When DXY strengthens, liquidity tends to rotate into dollar-denominated assets and away from risk-on trades like crypto and gold. When DXY weakens, it typically acts as a tailwind for both Bitcoin and gold.
Correlation Coefficients:
DXY vs. Gold: ≈ -0.85 (strong inverse correlation)
DXY vs. TOTAL (crypto market cap): ≈ -0.72 (moderate to strong inverse correlation)
Scenario 1: DXY Rallies toward 115–126 then, Expect gold to correct or stagnate, especially if yields rise. Crypto likely to pull back or remain suppressed unless specific bullish catalysts emerge (e.g., ETF flows or tech adoption).
Scenario 2: DXY ranges between 93–105 then Gold may consolidate or form bullish continuation patterns. Then Crypto may see selective strength, particularly altcoins, if BTC.D declines.
Scenario 3: DXY falls below 93 and toward 87 Then Gold likely to rally, possibly challenging all-time highs. Crypto could enter a major bull run, led by Bitcoin and followed by altcoins, fueled by increased liquidity and lower opportunity cost of holding non-USD assets.
Understanding DXY’s direction provides valuable insight for portfolio positioning in macro-sensitive assets.
Notes & Disclaimers:
This analysis reflects a technical interpretation of the DXY index and is not financial advice. Market conditions may change based on unexpected macroeconomic events, Fed policy, or geopolitical developments.
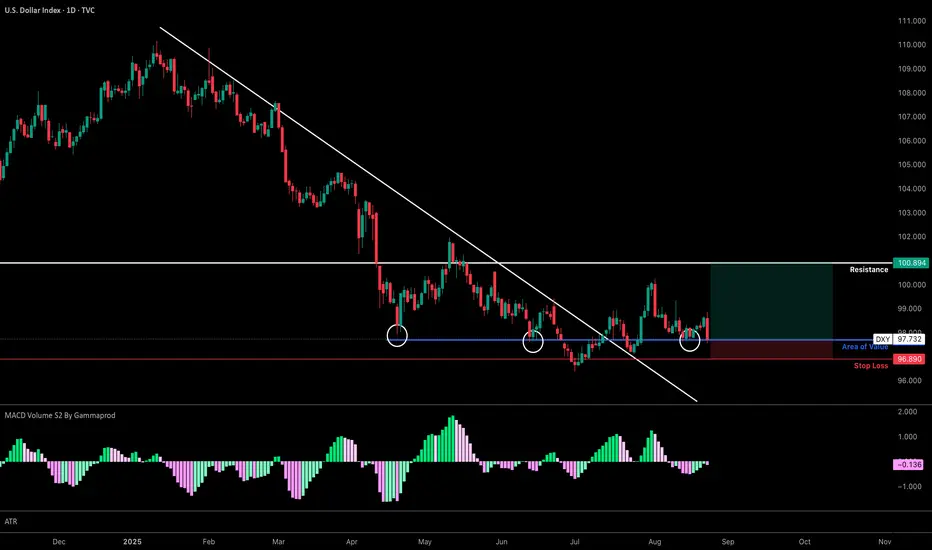
DXY: Key Levels + Change of CharacterBias: Long
Type: Reversal Trade
Trend: Range
Area of Value : Key Levels from downtrend before change of character.
Momentum : 1D MACD Histogram about to cross the High Tide.
Entry: 97.691
Exit: Stop Loss @ 96.890; Take Profit @ 100.894.
Analysis
Fact 1: DXY since 2022 has stayed above the 100.890 support level trending as a range.
Fact 2: DXY has now crossed the key support level @ 100.890 which now acts as a resistance
Fact 3: DXY crossed the trend line signaling a change of character + DXY MACD Histogram is about to cross to High Tide also signaling a change of character.
Conclusion:
Since the key support level @ 100.890 has now been broken, and there is a change of character about to happen. I believe that DXY will at the very least reach the resistance level @ 100.890 before bouncing off to continue the down trend or break to re-enter the range.
Recommendation:
Long Entry on the Area of Value (97.691), for stop loss add 1D ATR for distance (96.890), for take profit let it be the key resistance level (100.894). R:R of 4
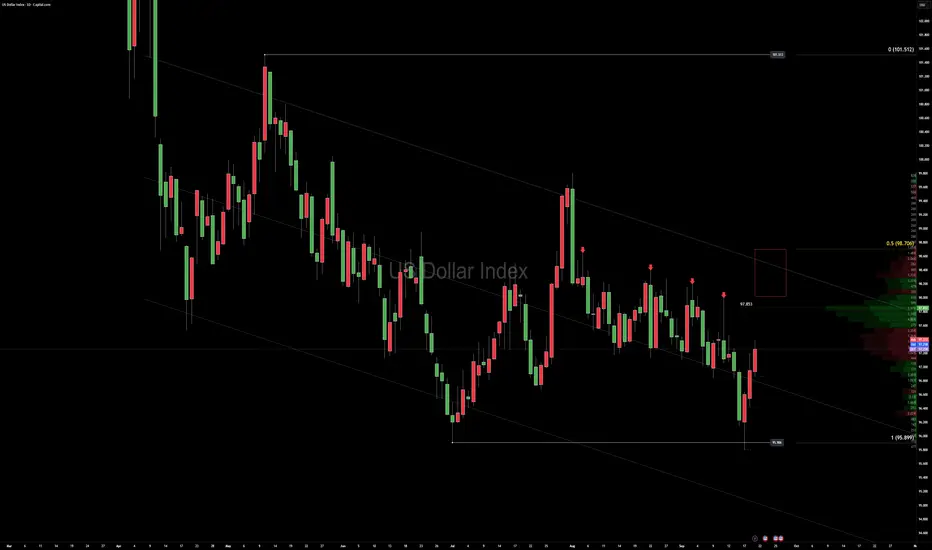
DXY 8HPrice just hit the top of the channel, so a pullback looks likely. We’re currently in wave C, and I’m looking for a correction down into the Fibonacci zone. After confirmations, I’ll be watching for entries on USD pairs.

DXYDXY seems like a correction will be coming before any push up.
Disclosure: We are part of Trade Nation's Influencer program and receive a monthly fee for using their TradingView charts in our analysis.

DXY SELL PROJECTIONDXY (Daily Outlook) – Sell Projection
The U.S. Dollar Index (DXY) has been showing signs of exhaustion after its recent upward move, and price action suggests that a potential correction could be on the horizon. I am closely watching the 98.000 supply zone, which stands out as a critical resistance level on the daily timeframe.
Should price retrace into this zone and show signs of rejection — such as bearish candlestick patterns or a shift in market structure — it would present a strong case for sellers to regain control. A sell from this region could set the stage for renewed downside momentum in the coming sessions.
For traders, this projection carries important cross-market implications: if the dollar weakens from the 98.000 level, we can expect XXX/USD pairs to gain more buying power, particularly around the midweek trading period. This would likely support bullish opportunities in major USD counterparts such as EURUSD, GBPUSD, and potentially gold (XAUUSD).
In short, patience and confirmation are key — waiting for DXY to tap into the supply zone and react will provide higher probability setups across USD-related pairs.

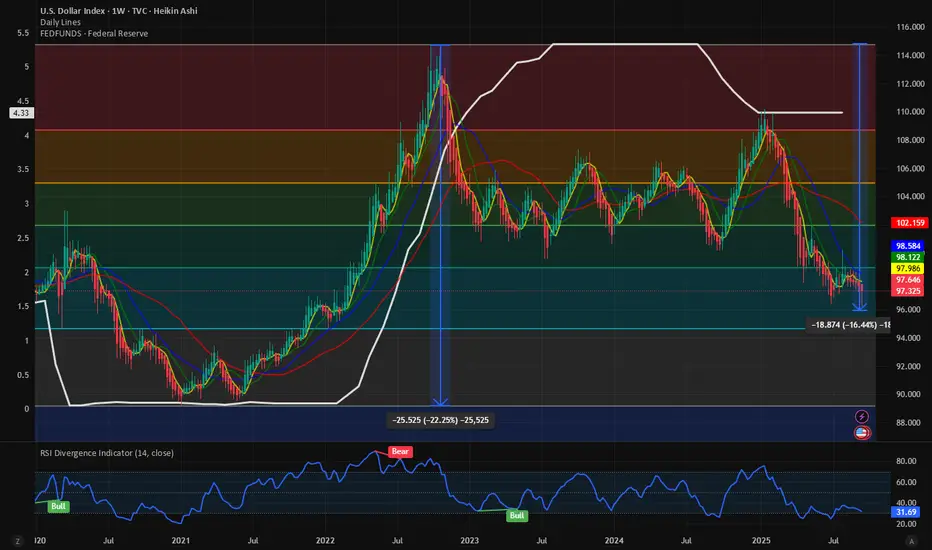
$DXY breaking down. Next level to watch 95. Year-end lows @ 90.Even if the Fed cutting cycle has just started, we are seeing major weakness in the TVC:DXY index prior to the easing cycle. It is quiet peculiar the bottom to top of the Fed hiking cycle matches exactly to the DXY index Cycle bottom in 2021 to cycle top to September 2022. With a drop in the Fed fund rate from 5.34% to 4.34%, which is close to 18%, and the DXY has also lost almost 17%. If the expectation is that there will be another 0.25% rate cut over the next few months which will takt the Fed fund rates to 4.09%, which is 23% from the recent highs of 5.34%. And surprisingly if we plot 23% lower from the ATH on the TVC:DXY Index then the index should reach 90 by the end of the year.
Verdict: With Fed rate lowering cycle ongoing the TVC:DXY index will lose more strength. 95 remains our short-term target and TVC:DXY to reach 90 by year end.
DXYDXY Bullish Bias
Buyers have stepped in, absorbing all selling pressure, pushing price higher. Watch for continuation as momentum favors bulls.
Key Notes:
Price cleared previous resistance levels.
Bullish momentum confirmed by strong candle closes.
Look for pullbacks to support for potential entries.

MY VIEW ON THE DXY - 22 / 26 SEPTEMBER 2025Last week we saw the Index testing a new low, continuing its downward trend, cause by the Feds cutting interest rates.
On the major frames the Index is in fact bearish unless we have a clear move above 101.400.
This week I expect a pullback to the 98.300 - 98.750 critical area of resistance by Tuesday, Powell speech could push the index up to 101.050 - 101.350 or down to new lows in the 96.000 - 95.220 area of support.

dxy 4hTrading Perspectives for the Upcoming Week
In this series of analyses, we have reviewed short-term trading perspectives and outlooks.
As can be seen, in each analysis there is a significant support/resistance zone near the current asset price. The market’s reaction to or break of this level will determine the future price trend up to the next specified levels.
Important Note: The purpose of these trading perspectives is to examine key price levels and the market’s potential reactions to them. The analyses provided are by no means trading signals!