DXY: 3mo timeline channel, BULLISH
Interest rates (relative to global peers) in the US remain relatively high. Global peers dropping rates at a much quicker pace when compared to the FED.
US GDP growth continues at a fast pace thanks to expanding margins through efficiency thanks to AI. I believe we'll also begin to see small to mid caps perform as well as large caps currently are in the next year or so.
Continued drop in commodity prices like oil
From a technical perspective, on the 3mo timeline, the 50 sma is about to cross above the 200 sma. Current price is also bouncing off bothe the 50 and 200 sma. I believe the DXY is clearly bottoming in a multi decade long channel.
As much tension as there is in the world today, we are still grinding forward. Nothing is perfect, but the sentiment shows clear promise in future growth which would help accelerate DXY value relative to the rest of the worlds currency.
This doesn't mean stocks must come down. We can have both.
...But I'm an optimist.
All the best.
Trade ideas

DXY long-term ideaThe U.S. Dollar Index (DXY) is declining as investors anticipate a softer U.S. monetary policy and shifting global capital flows. Recent economic data—such as slower job growth, moderating inflation, and weaker consumer spending—has increased expectations that the Federal Reserve may cut interest rates or at least pause further hikes. Lower rates reduce the dollar’s yield advantage, making it less attractive to global investors.
At the same time, improving economic conditions abroad, particularly in Europe and emerging markets, are boosting demand for other currencies, putting additional downward pressure on the DXY. Furthermore, rising risk appetite in global markets often leads investors to move away from the dollar’s safe-haven status toward higher-yielding or riskier assets.
In short, the DXY is falling because markets are pricing in a weaker Fed stance, softer U.S. data, and stronger foreign currencies.

DXY Rejection from Premium Zone | USD Weakness AheadHello Billionaires!!
The US Dollar Index (DXY) is showing signs of exhaustion after tapping into the FVG + Order Block within the premium zone.
We’ve also confirmed a Market Structure Shift (MSS) to the downside — signaling a potential short-term reversal.
📊 Analysis Breakdown:
FVG & OB confluence near 98.90 🧠
MSS indicates bearish intent ⚡
Targeting buying zone around 98.30 area 🩸
This scenario supports USD weakness, aligning with potential bullish moves in EURUSD, GBPUSD, and AUDUSD.
💡 Trade Plan:
DXY → Short bias below OB
USDJPY → Short setup favored
EURUSD, GBPUSD, AUDUSD → Look for long setups
Smart Money likely engineered liquidity above before pushing price lower to rebalance inefficiency.

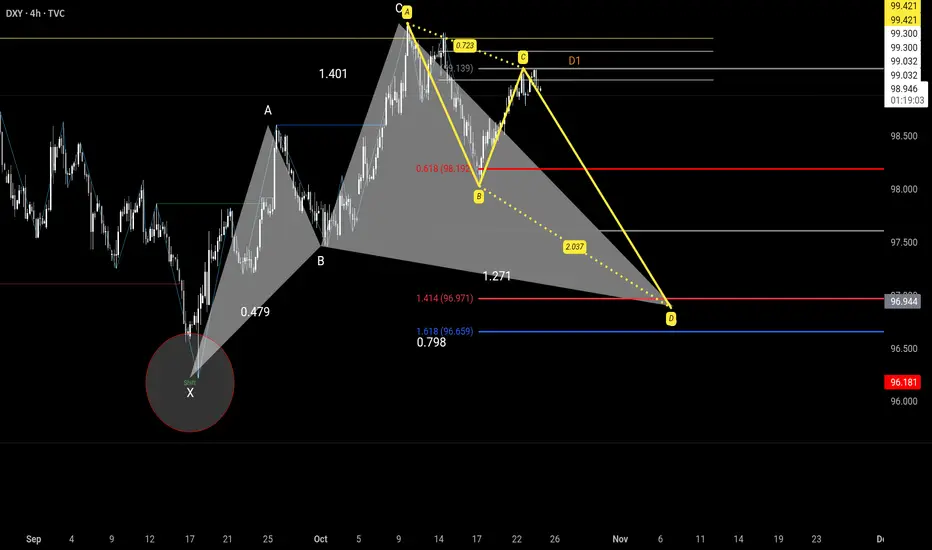
Dxy follow upABCD extension with target PRZ. Pattern is projection alongside previous idea which will be linked below.
DXY Trade Plan 22/10/2025Dear Traders,
The 99–99.200 zone is a very important area for the Dollar Index. Based on this, if the price breaks above this zone, we will enter sell positions on USD pairs. However, if a bearish candle appears, we will enter buy positions for a 80–100 pip move.
Regards,
Alireza!

GC1 & DXY Daily Trade SetupsIn this update we review the recent price action in Gold & Dollar Index futures contracts and identify the next high-probability trading opportunities and price objectives to target. To review today's video analysis, click here!

DXY Bullish move 99.00 (Readmore)...💹 #DXY Analysis (1H Timeframe) 💹
🟢 Bullish Momentum Building Up!
Price showing strong buying pressure from the key support zone at 99.00 📈
🎯 Technical Targets:
1️⃣ 99.300 – First target
2️⃣ 99.500 – Second target
📊 As long as price holds above 99.00, bullish bias remains intact.
#DXY #USDIndex #Forex #TechnicalAnalysis #PriceAction #TradingSetup 🚀

The next few months run Looking at the point of interest 🙄 price need to come and balance this move let's see maybe by end of this year or by January
dxy possible bullish idea expecting dxy to coninue bullish
tapped in monthly ob + liq sweep
so targetting monthly irl which is monthly fvg
i am sharing daily chart view

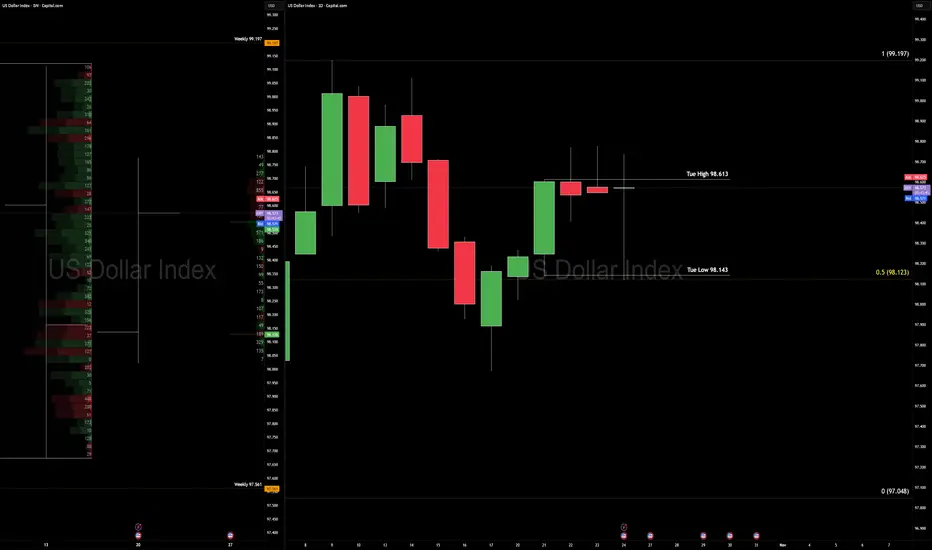
DXY — Triple Compression: CPI Meets a 3rd Weekly & 4th Daily Ins
The U.S. Dollar Index is locking in tight — 3rd consecutive weekly inside bar, and a 4th possible daily inside bar — as U.S. inflation holds firm and Japan’s core inflation uptick adds fuel.
Context
We’re locked in structural compression: three weeks of internal price action, and today presents a 4th daily inside bar formation.
Weekly key range: low 97.561 and high 99.197. Price is stuck in the mid-zone, patiently waiting.
For bias confirmation: Break of Tuesday’s 21 Oct daily candle low at 98.143 or high at 98.613 will signal directional bias.
Macro queue: Big data hits next week (inflation prints, central-bank focus). Volatility is coiled.
Technical
Weekly frame: Still inside the bearish range (97.561 – 99.197).
Daily frame: Bias leans bullish until the range breaks — think “bullish inside bar pending expansion”.
In symmetrical measures: Risk of overbought cognition; if today’s low holds and Monday fails to trade through it, we may see a higher low setup. Execution: Wait for clean breakout of the inside bar structure; use volume confirmation; avoid getting sucked into a false squeeze.
Fundamentals
U.S. inflation: The Consumer Price Index for September is published today (24 Oct) after delay due to shutdown.
Bureau of Labor Statistics +2
The Financial Express +2
Japan inflation: September core inflation rose to 2.9% YoY, moving above the Bank of Japan target and adding pressure to the JPY‐rate story.
Trading Economics
+2
Bloomberg
+2
Impact mechanism: Sticky inflation → reduces odds of immediate rate cuts → supports USD strength; yet structural squeeze in DXY means the market is holding its breath for breakout.
Plan & Mindset
Plan: Hold off trading until Monday’s price action gives clarity through breakout of the inside-bar structure. Then map cross-assets (EURUSD, GBPUSD) accordingly.
Mindset
Structure rules story. Don’t fight a tight coil. Today you “wait with purpose.” If price breaks, act decisively; if it breaks wrong, adapt quickly.
- Like waiting for the popcorn — you don’t eat the kernels while still heating.
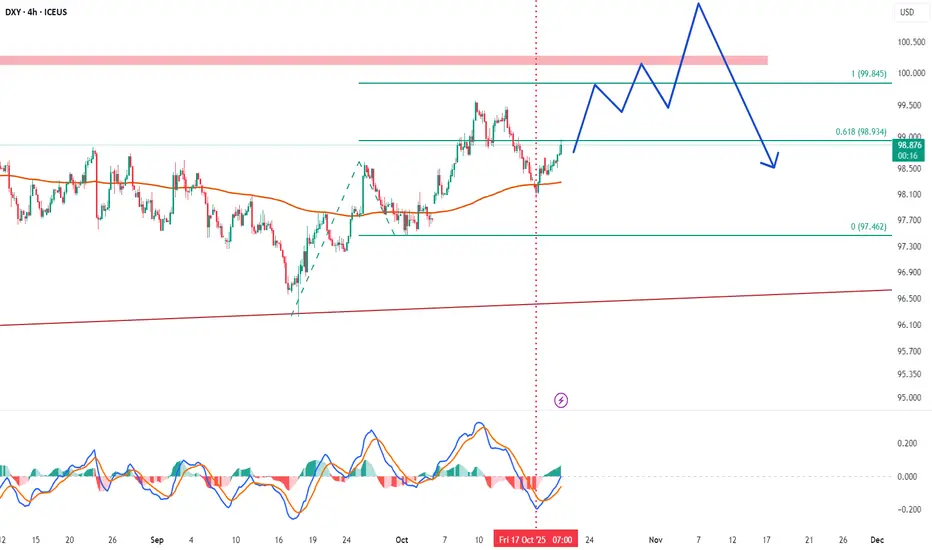
DXY Forming a Strong Base – Reversal Ahead?U.S. Dollar Index TVC:DXY – Daily Analysis
After a long downtrend, the Dollar Index seems to be forming a strong base at the bottom, as highlighted by multiple bounces from the same support zone. This area has been acting as a reliable floor, preventing further downside.
Currently, the price has also broken above the descending trendline, showing early signs of strength. If the price holds above this breakout, we could see a move toward the 100–101 zone, which is the next key resistance area.
However, if the price dips back below the trendline, a retest of the base zone near 97.00 could take place before any potential continuation higher.
Summary: DXY is showing a potential reversal structure. A sustained move above the trendline could confirm the start of a stronger bullish phase.
DYOR, NFA
Thanks for reading! Appreciate your support and engagement 🙏

DXY Institutional Pullback Setup – Smart Money Buying the Dip!💰 DXY: The Dollar Flexing Hard - Institutional Swing Play! 🎯
📊 Market Overview
The U.S. Dollar Index (DXY) is showing serious institutional strength! After a clean pullback to the 786 Triangular Moving Average, we're locked and loaded for a bullish continuation play. This setup screams "smart money accumulation" and we're positioning for the ride up! 💪
🎯 The Setup: Bullish Confirmation ✅
Asset: DXY (U.S. Dollar Index CFD)
Bias: 🟢 BULLISH - Confirmed on institutional timeframes
Strategy Type: Swing/Day Trade Hybrid
📈 Technical Confluence:
✅ 786 TMA Pullback - Textbook institutional support zone
✅ Price action holding above key structure
✅ Volume profile showing accumulation
✅ Smart money footprint evident
🎲 The "Layered Entry" Gameplan (Thief Style 😎)
Instead of going all-in at one price, we're using multiple limit orders (layering strategy) to build our position like the institutions do:
💵 Entry Zones (Layer Your Orders):
Layer 1: 98.400
Layer 2: 98.600
Layer 3: 98.800
Note: You can add more layers based on your risk appetite and account size! The beauty of layering? You average into the move without FOMO-ing at the worst price. 🧠
Current Price Entry: Yes, you can enter at market if you're confident in the setup, but layering gives you better risk management.
🛡️ Risk Management (Thief OG Edition)
🚨 Stop Loss: 98.100
This is MY stop loss based on my risk tolerance. IMPORTANT: I'm NOT telling you to blindly copy this. Set your SL based on YOUR account size, risk percentage, and comfort level. Trade your plan, not mine! 🎰
🎯 Profit Target: 100.000 (The Big Round Number!)
🧲 Why 100.000?
Simple Moving Average acting as strong resistance
Psychological round number = liquidity magnet 🧲
Overbought conditions likely near this zone
Trap potential for late longs - we want to exit before the crowd panics!
Exit Strategy: Take profits in stages! Don't be greedy. 💰 Consider taking 50% off at 99.500 and letting the rest ride to 100.000 with a trailing stop.
DISCLAIMER: This target is MY analysis. You decide when to take profits based on your strategy. If you see your account glowing green, TAKE THE MONEY! 💸
🔗 Related Pairs to Watch (Correlation Game 🕹️)
The DXY doesn't move in isolation! Here are the correlated plays:
📉 Inverse Correlations (These typically move OPPOSITE to DXY):
FX:EURUSD - Strong negative correlation (~-95%). DXY up = EUR/USD down
FX:GBPUSD - Cable follows Euro's lead, watch for breakdown
OANDA:AUDUSD & OANDA:NZDUSD - Commodity currencies get crushed when DXY rips
Gold ( OANDA:XAUUSD ) - Dollar strength = gold weakness (classic inverse)
📈 Positive Correlations (These move WITH DXY):
FX:USDJPY - Yen pairs amplify dollar moves
OANDA:USDCHF - Swissy follows dollar strength
OANDA:USDCAD - Loonie weakens on DXY strength (unless oil goes parabolic)
Pro Tip: If DXY is pumping but EUR/USD isn't dumping proportionally, something's off - be careful! 🚩
🧠 Key Points & Edge:
Institutional Level Confirmed - The 786 TMA is a proven reversal/continuation zone used by big money
Swing Trading Sweet Spot - This isn't a scalp; give it room to breathe
Layer Like a Pro - Don't blow your load on one entry; scale in strategically
Risk First, Profits Second - Protect your capital like it's your only child 👶
Watch Correlations - DXY strength impacts EVERYTHING in Forex
⚠️ Risk Disclosure & "Thief Style" Disclaimer
THIS IS THE "THIEF STYLE" TRADING STRATEGY - JUST FOR FUN AND EDUCATIONAL PURPOSES! 🎲
This analysis represents MY personal trading plan and bias. I am NOT a financial advisor, and this is NOT financial advice. Trading involves substantial risk of loss, and you could lose more than your initial investment.
✅ Do your own research (DYOR)
✅ Never risk more than you can afford to lose
✅ Past performance ≠ future results
✅ Markets can remain irrational longer than you can remain solvent
Trade at your own risk! I'm sharing my playbook, but YOU are responsible for your account. If you make money, congrats! 🎉 If you lose money, that's on you, not me. Manage your risk like a pro! 💪
🚀 Let's Catch This Move Together!
The setup is ripe, the levels are clear, and the plan is locked in. Now we wait for the market to come to us - patience pays in this game! ⏰
✨ If you find value in my analysis, a 👍 and 🚀 boost is much appreciated — it helps me share more setups with the community!
#DXY #USDollarIndex #ForexTrading #SwingTrading #InstitutionalTrading #TechnicalAnalysis #TradingStrategy #ForexSignals #PriceAction #SupportAndResistance #RiskManagement #EURUSD #ForexCorrelation #SmartMoney #TradingView #MarketAnalysis #DayTrading #ForexLife #ThiefStyle #LayeredEntry #DollarBull
Happy Trading, Thief OGs! 💎🙌

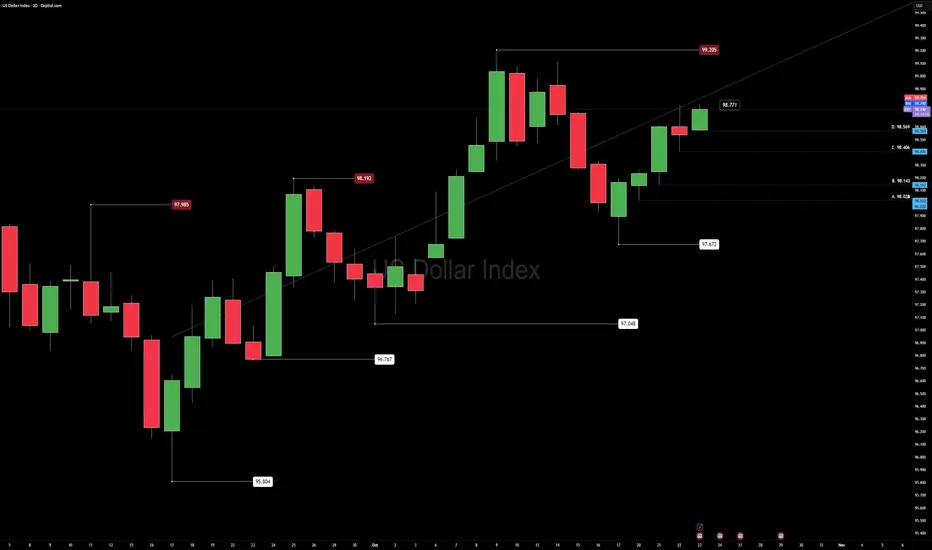
US DOLLAR AnalysisRespect the Higher Low: The Quiet Power of an Uptrend
U.S. Dollar Index (DXY) | 23 Oct 2025 | Pre–New York Session Outlook
By Daniel Fadeley
The U.S. Dollar continues to show a bullish bias, with higher lows forming consistently across both the weekly and daily structure. This ongoing strength keeps the broader tone positive for USD, while EURUSD and GBPUSD remain under cross-asset pressure.
We’re currently operating inside a bullish range with 97.672 as the range low and 99.205 as the range high.
Context
Momentum favors the dollar as buyers continue defending each pullback. If this month’s bullish structure holds, the market could confirm a longer-term upward phase.
However, conditions are slightly extended on Fibonacci sequence levels, suggesting reduced reward-to-risk for new swing positions until a clean retest offers better value.
Technical Map
Price took out yesterday’s high (98.771) and approaches the range ceiling at 99.205.
Volatility remains elevated through the week, and intraday momentum supports buy-the-dip behavior while daily lows continue to hold.
For cross-assets, this structure implies ongoing pressure on major USD pairs while the dollar holds above recent higher lows.
Fundamental Outlook
The week ahead features several key macro events:
U.S. GDP advance data
Core PCE inflation release
Multiple Federal Reserve speakers
Ongoing U.S. government funding discussions
Impact lens:
Yields rising → typically strengthens USD and tightens global liquidity.
Yields easing → can relieve pressure on risk assets such as equities and crypto.
Liquidity trends show ETF inflows slowing and capital rotating defensively, consistent with cautious macro positioning.
Plan
Current outlook remains bullish within range, focusing on position trades from defended lows and short-term rotational setups during volatility spikes.
Patience near 99.205 is key — a clean breakout with retest would confirm continuation; failure there could mean another controlled rotation inside the range.
Mindset
“Structure builds confidence. Clarity builds control.”
In fast markets, the goal is not prediction but preparation — follow structure, protect capital, and let confirmation lead conviction.
Educational use only — not financial advice.
Follow @CORE5DAN for calm, data-driven analysis and weekly structure lessons.
— CORE5DAN
Institutional Logic. Modern Technology. Real Freedom.
dollar moonthe dollar is going to moon so xau should come down
as follows wait for fvg break then long max leverage or buy calls

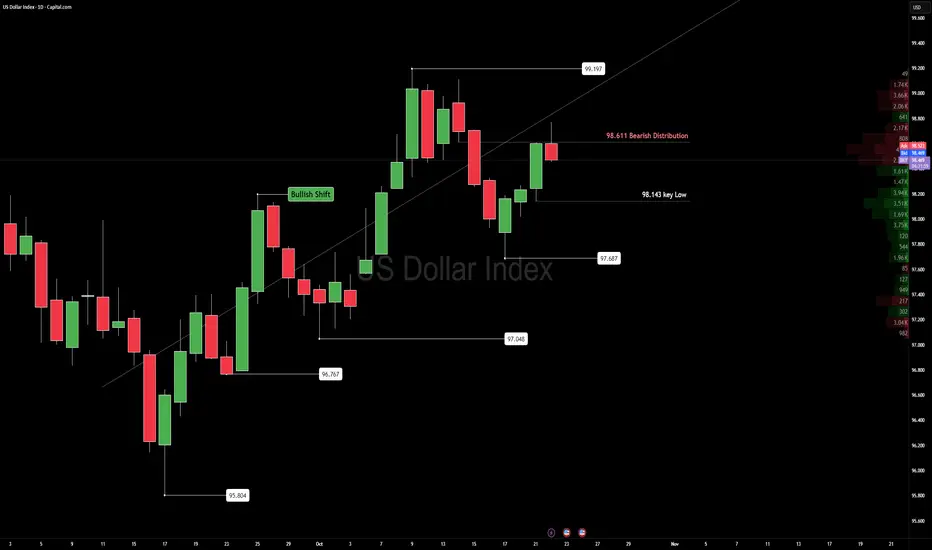
DXY UpdateDXY — Reaction at 98.611 Distribution Zone
The U.S. Dollar Index met firm resistance near 98.611, the same Bearish distribution area that capped momentum last week.
Price remains inside a wide daily range but shows the first sign of cooling after a strong stretch higher.
Below sits 98.143, the line that that changes chart bearish. Until then We are still good.
Acceptance under that level would confirm a structure shift and open space for continued rotation lower.
Upcoming jobless claims and Fed remarks may decide which side gains conviction.
For now, this is a market balancing inventory — not trending, just redistributing.
Trade confirmation, not anticipation.
Key levels:
98.611 — Distribution cap
98.143 — Structural pivot
— Institutional Logic. Modern Technology. Real Freedom.
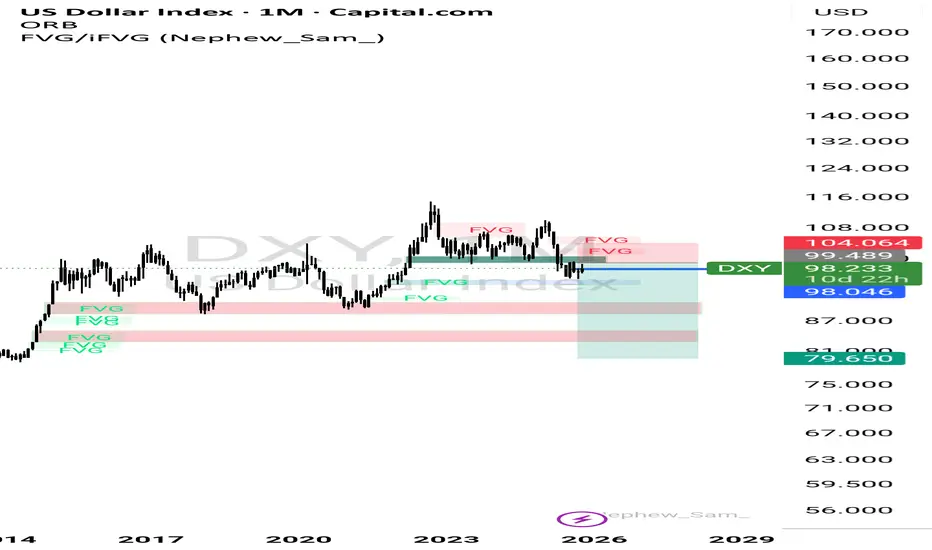
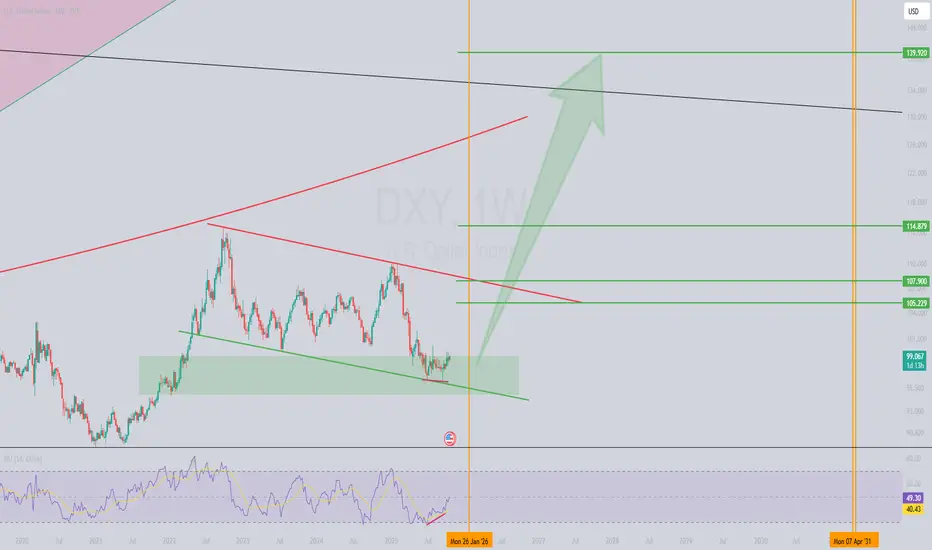
DXY: Bullish Setup Brewing at Key Weekly Support!The US Dollar Index (DXY) is showing a compelling setup on the weekly timeframe! 📈 The price has reached a critical support zone between 99.120 and 94.802. This level also aligns with the lower boundary of a descending channel, adding confluence to this high-probability zone.
🔍 Key Technical Observations:
Bullish Divergence: A clear bullish divergence has formed between the price and the RSI indicator, signaling potential exhaustion of sellers and a possible trend reversal.
Channel Support: The price is testing the lower trendline of the descending channel, a spot where buyers have stepped in before.
Support Zone: The 99.120–94.802 range is a high-value area for accumulation, making it a prime spot for a bounce.
📡 What’s Next?Technically, the DXY looks poised for a bullish reversal. However, global macroeconomic events and fundamental news (like Fed decisions or geopolitical developments) will play a crucial role in confirming this move. Keep an eye on upcoming economic data releases! 📅
What do you think of this setup? Are you bullish on DXY, or waiting for more confirmation? Drop your thoughts below! 👇
DXY AnalysisDXY remains within a broader uptrend, but currently shows signs of short-term consolidation after facing resistance near 99.05.
A head & shoulder pattern is likely to be forming, with right shoulder in the making, if successfully created, will force the prices lower towards the neckline near S2 (98.5)
Overall, the index is likely to retest support around 98.60–98.50 (S1–S2) before a potential rebound if the uptrend line holds.
Although, a break below 98.50 could trigger deeper correction toward 98.20, while sustained strength above 99.25 may resume bullish momentum.

DXY: The Market Is Looking Up! Long!
My dear friends,
Today we will analyse DXY together☺️
The recent price action suggests a shift in mid-term momentum. A break above the current local range around 98.619 will confirm the new direction upwards with the target being the next key level of 98.693 and a reconvened placement of a stop-loss beyond the range.
❤️Sending you lots of Love and Hugs❤️

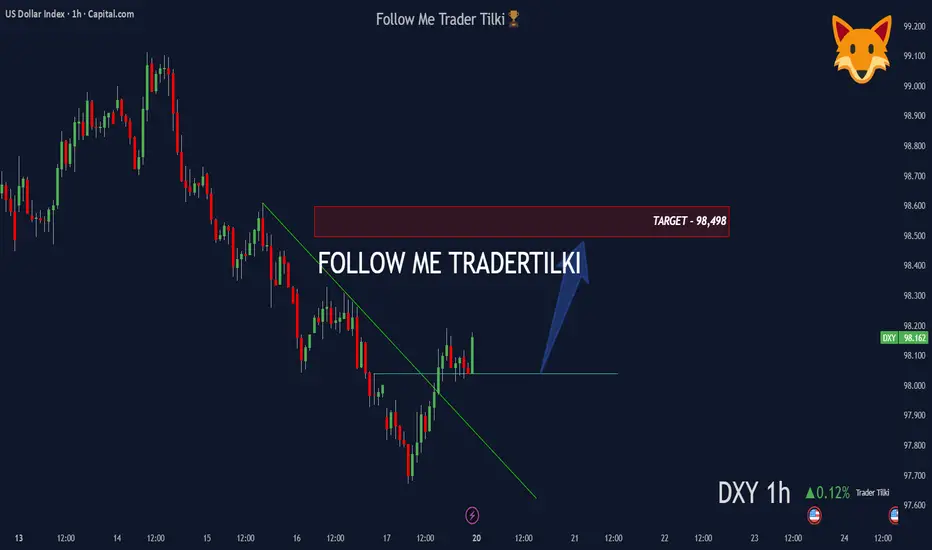
DXY 1H Analysis: Trendline Break with Rising Volume 📊 DXY – 1 Hour Analysis
Technical Outlook:
The trendline has been broken and rising volumes are drawing attention.
Based on this setup, my target level is: 98,498 🎯
Fundamental Analysis:
Recently, a White House economist stated that “we are not in any kind of economic war with China,” which reduced uncertainty in the markets and strengthened the dollar index.
In addition, FED policies, interest rate expectations, and tightening measures continue to be key factors supporting upward pricing on the DXY side.
🙏 Thanks to everyone who supports me with their likes.
Dollar Index Behavior in a Descending DiamondThe dollar index has made a very polite effort and has been fluctuating within the range I have drawn, and I think this effort will continue and continue its downward trend until the price range I have indicated in the image!
Time will tell if this claim is true!
Good luck...

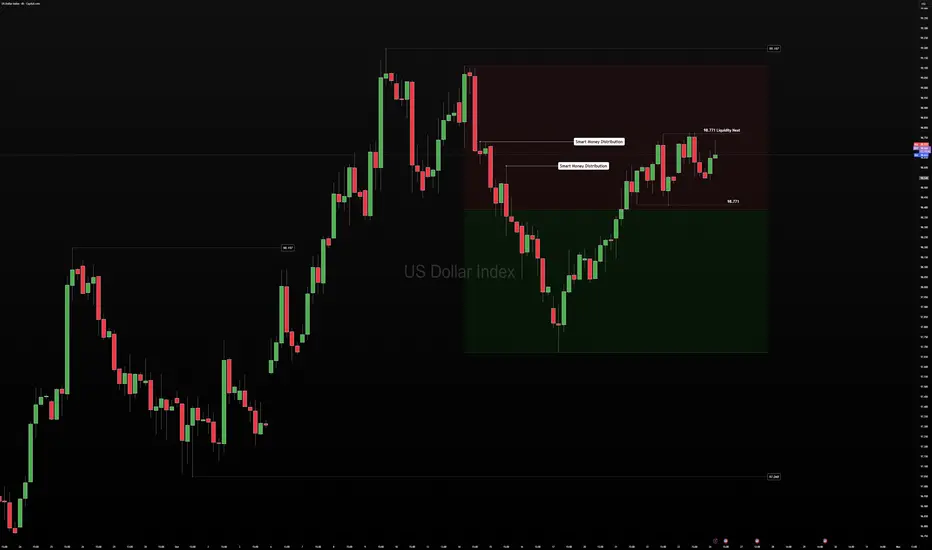
US Dollar — Pre-London Market NoteSmart Money Distribution — The Dollar’s Quiet Exit
🧭 Context
The U.S. Dollar Index is sitting in a premium range, absorbing liquidity near the highs.
This isn’t random — it’s the textbook signature of smart money distribution.
When professionals unload into late sellers and buyers end of week , the market looks stable… until it isn’t.
We’re watching the same pattern unfold into week’s end — a slow bleed of premium selling to generate liquidity for next week’s open.
📊 Technical Frame
Structure remains bearish on the weekly, bullish on the daily — a structural crossfire.
Retail eyes see a bounce; institutions see exit liquidity.
Dynamic structure math says: chasing longs here is paying premium for risk.
The 4H range low at 98.0 is under pressure; a sweep toward 98.77 during London would complete the liquidity cycle.
🌐 Fundamental Pulse
GDP and Core PCE ahead — both can shift yield expectations.
Yields up → stronger dollar, liquidity drains from risk assets.
Yields down → softer dollar, risk finds temporary relief.
This tug-of-war defines positioning — not headlines, but how liquidity behaves around them.
🧠 Trader’s Mindset
Smart money doesn’t predict — it prepares.
This week’s goal isn’t to be early; it’s to read how the distribution completes.
Patience preserves capital — and perspective.
💡 Takeaway
When everyone sees strength, the pros are already selling into it.
That’s smart money distribution in motion.
Learn to spot it, and you’ll stop donating to those who already have.
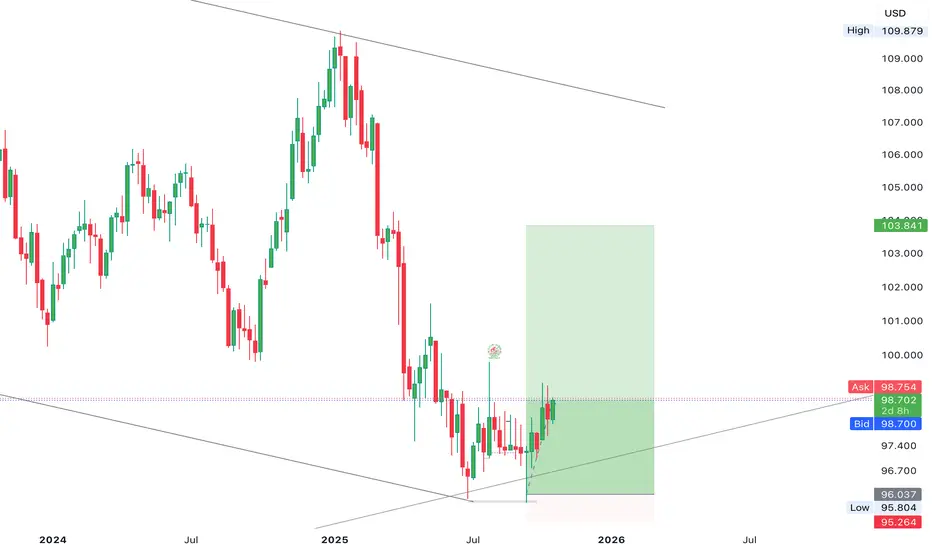
The DXY continues to establish a solid base for bullish recoveryThe DXY continues to establish a solid base for bullish recovery around the 98.000 level, aiming to mitigate toward the 103.000 region. This development highlights a potential shift in market momentum as dollar strength begins to rebuild. follow for more insights ,comment and boost idea
US Index is getting stronger and ready to climb the 100.149 markAfter rebounding from the 97.45 support zone, DXY is regaining strength above the 200 EMA, showing short-term bullish momentum. However, the broader price structure bearish strength will take over.
The MACD is currently showing a bullish crossover from oversold levels, supporting the ongoing corrective move to the upside. Once the index approaches the resistance region, momentum could begin to fade, leading to a potential bearish reversal.
Resistance Zone: 99.80, 100.50 and ultimate 100.14
Immediate Resistance: 98.93 followed by 99.84
Support Levels: 97.46 and 96.87 trendline support