DXY — Between Balance and Breakout
Date: Sunday, October 19
Timeframe: Daily
Analyst: @CORE5DAN
Context
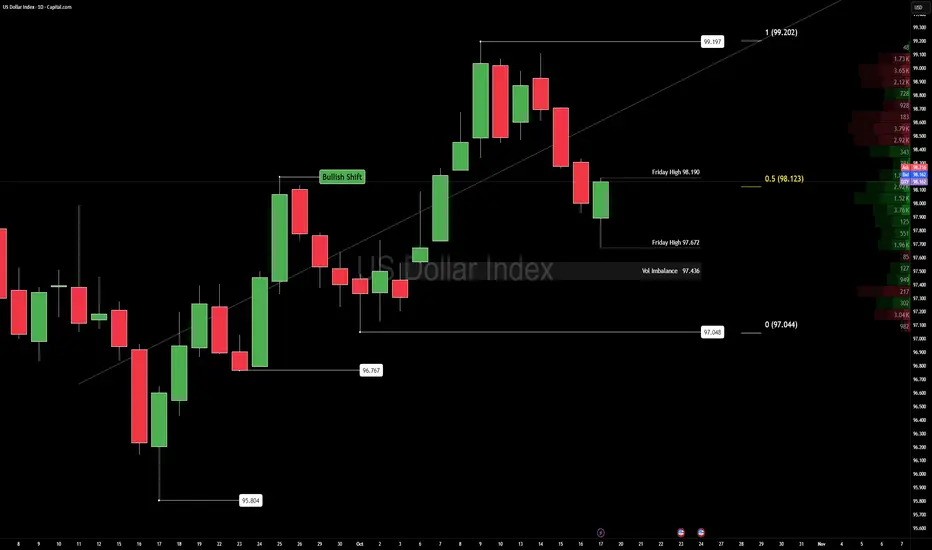
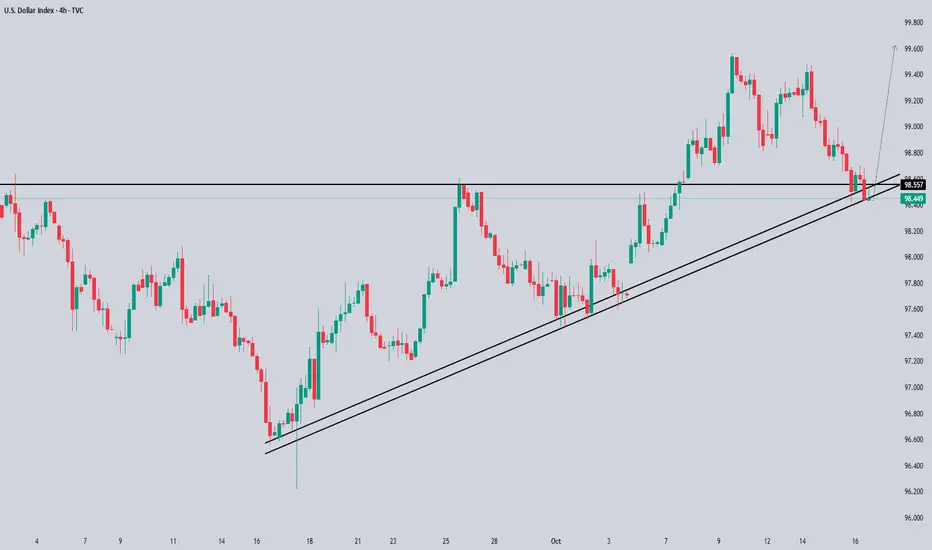
The U.S. Dollar Index holds a bullish daily range between 99.197 and 97.048, now sitting around the Fibonacci 50% retracement at 97.044.
Friday’s session formed a tight box — high 98.190, low 97.672 — showing compression inside balance conditions.
Price trades above mid-range, with a volume imbalance near 97.436 acting as a magnet for short-term rotation.
Key liquidity rests just below 97.700, and reactions there could define early-week direction.
Technical Map
• Structure: Short-term bullish, still inside a broader weekly bearish framework. Watch 97.436–97.700 — a clean reaction zone where imbalance and liquidity converge.
• Momentum: Range-bound bullish, confirming control but lacking expansion. A daily close above 98.190 opens the path toward the range high at 99.197.
• Volume: Imbalance remains unfilled — ideal for mean-reversion setups before any breakout impulse.
Fundamental Pulse (Week Ahead)
• Macro Drivers:
— US GDP advance data: key for growth tone.
— Core PCE inflation: the Fed’s favored inflation gauge.
— Fed speakers and PMIs: tone setters for November rate outlook.
• Yields:
— The 10-year sits near 4.6%.
— A push higher = bullish Dollar, stronger short-term flows.
— A pullback = potential consolidation across USD pairs.
• Global Flows:
— Mild rotation out of risk assets and emerging markets supports the Dollar.
— EURUSD and XAUUSD both reflect this hesitation near key supports.
Plan
Bias stays bullish in the short term, bearish in the long term.
We favor volume imbalance fills and reaction trades at 97.436–97.700 before re-evaluating structure.
If macro data or yield spikes support Dollar demand, expect continuation toward 98.190+.
Otherwise, a drift below 97.436 would signal distribution and confirm corrective pressure.
“Structure is the compass; sentiment is the weather.”
Mindset Pulse
“Authority comes from clarity, not prediction.”
Trade what’s confirmed — not what’s comfortable.
Trade ideas
dxyOn a monthly time frame, if DXY closes above the local resistance, I'm gonna long with the monthly chart

DXY key levels to look out for this week (WC 20/10)DXY key levels for the following week ahead. With Friday heavy on USD, GBP & EUR news releases.
DXY Free Signal! Sell!
Hello,Traders!
DXY Price is expected to retest the horizontal supply area early next week as liquidity builds up below Friday’s close. Smart Money may engineer a short-term rally into this zone before resuming the bearish move toward 98.38.
-------------------
Stop Loss: 98.71
Take Profit: 98.38
Entry: 98.58
Time Frame: 3H
-------------------
Sell!
Comment and subscribe to help us grow!
Check out other forecasts below too!
Disclosure: I am part of Trade Nation's Influencer program and receive a monthly fee for using their TradingView charts in my analysis.

DXY Will Go Higher! Buy!
Take a look at our analysis for DXY.
Time Frame: 1D
Current Trend: Bullish
Sentiment: Oversold (based on 7-period RSI)
Forecast: Bullish
The market is approaching a key horizontal level 98.541.
Considering the today's price action, probabilities will be high to see a movement to 99.742.
P.S
Overbought describes a period of time where there has been a significant and consistent upward move in price over a period of time without much pullback.
Like and subscribe and comment my ideas if you enjoy them!

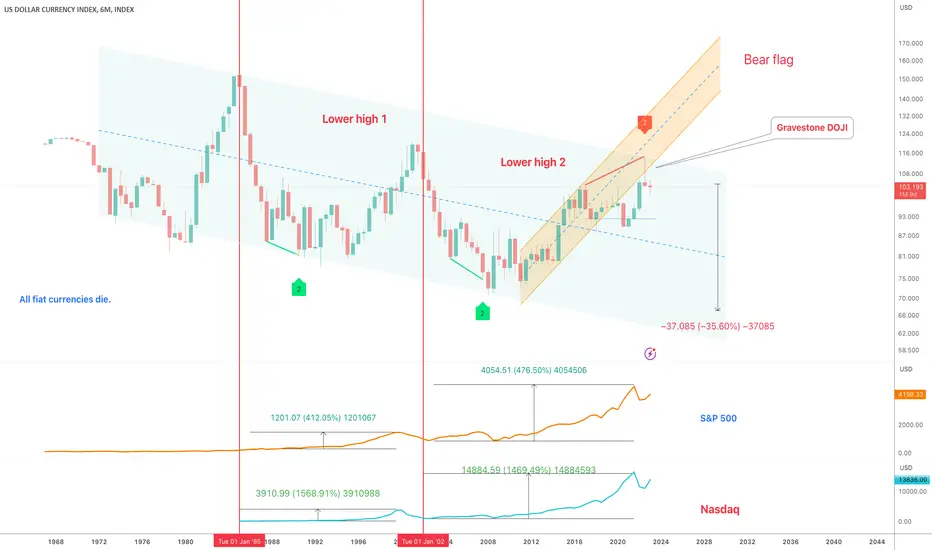
Dollar index - Macro Bearish divergenceA lot of information in the above 6-month chart of the dollar index, could discuss for hours.. some highlights:
1) The bearish divergence currently printing shall confirm by July 2023 should 100 level collapse. It is the only time in history a bearish divergence of this strength has printed on the 6-month chart.
2) IF it confirms, the index will target the lower side of the channel around 60-70 level.
3) Notice the trend of the index, lower highs lower lows. It is remarkable how many are bullish on the dollar, in the macro sense.
4) Both the S&P 500 and the NASDAQ made considerable gains in the 10-year period that followed a rejection from the upper side of the channel. Many ‘experts’ now talk about the coming lost decade. Gold is the only option, they say. Is that what you see in this chart?! Not what I’m seeing..
Will return in July to see how this candle prints, however with 1.3 months to go it is not looking good for the dollar.
Ww
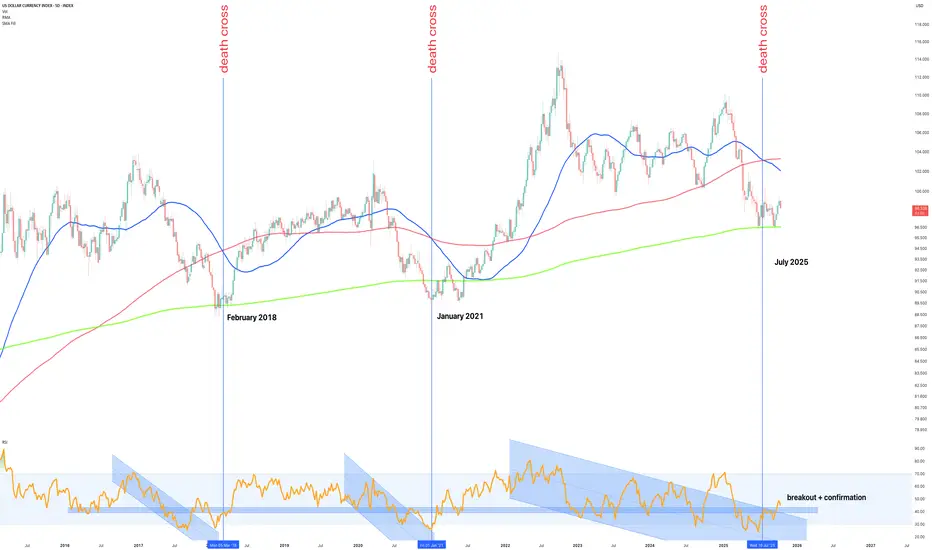
The Dollar Death Cross that marks the beginning – October 2025The term death cross often sends shivers through markets, but in the case of the US Dollar Index (DXY), it’s proven to be quite the opposite.
History tells us that every major death cross on the 5-day chart where the short-term 50 day simple moving average (SMA) crosses below the 200 day long term simple moving average (SMA), has in fact marked the end of a dollar downtrend, not the start of one. This is especially true after a test of the annual Rolling Moving Average (green line), as has just confirmed.
Look left:
February 2018, Death cross printed at the macro low. The dollar rallied for nearly two years.
January 2021, Death cross printed again, just before the dollar began its next sustained advance.
July 2025, Another death cross appears, once again coinciding with price touching the RMA, the same long-term structural support that has historically defined the beginning of each dollar bull cycle.
We can keep looking left if those last three dates do not satisfy, the story does not change, there is no “this time is different” while the DXY is in a macro uptrend.
Now, in October 2025, the RSI confirms a breakout from its multi-year descending channel, adding technical weight to what the moving averages are already signalling: the bear phase is likely over, and the next dollar bull market is quietly beginning. The 50 line is marked out, once it climbs above the rest is history.
What’s Next
Each of the prior bullish reversals began the same way:
1. Death cross, triggering capitulation sentiment.
2. Support test of the annual rolling moving average
3. RSI breakout and confirmation of trend reversal
That structure is now repeating almost perfectly.
If momentum follows prior cycles, the next 6–18 months could see the DXY recover toward the 105–110 zone, with potential for extension beyond 115 over the full bull phase.
A break and hold above 104 would confirm trend strength, while a close below the annual average around 96 would invalidate the structure and delay the signal.
This setup isn’t about calling tops or bottoms, it’s about recognising that death crosses on this timeframe have repeatedly marked strong uptrends for the dollar, not endings as the gold folks would have us believe.
Conclusions
The data is clear: every major death cross in recent DXY history has aligned with the start of a new bullish cycle. The 5-day structure, RSI breakout, and confirmation from the rolling annual average all point toward a macro reversal is underway.
The irony of the name death cross is not lost here, for the dollar, it often signals the exact opposite. If history rhymes once again, October 2025 will be remembered as the quiet beginning of the next US Dollar bull market.
Ww
==============================
Disclaimer
This post is for educational and informational purposes only and represents personal market analysis, not financial advice.
Currency markets are inherently volatile and influenced by complex macroeconomic factors. Always perform your own research, manage risk responsibly, and rely on confirmation, not emotion, when making trading or investment decisions.
Patience, data, and confirmation, the real currency of trading.
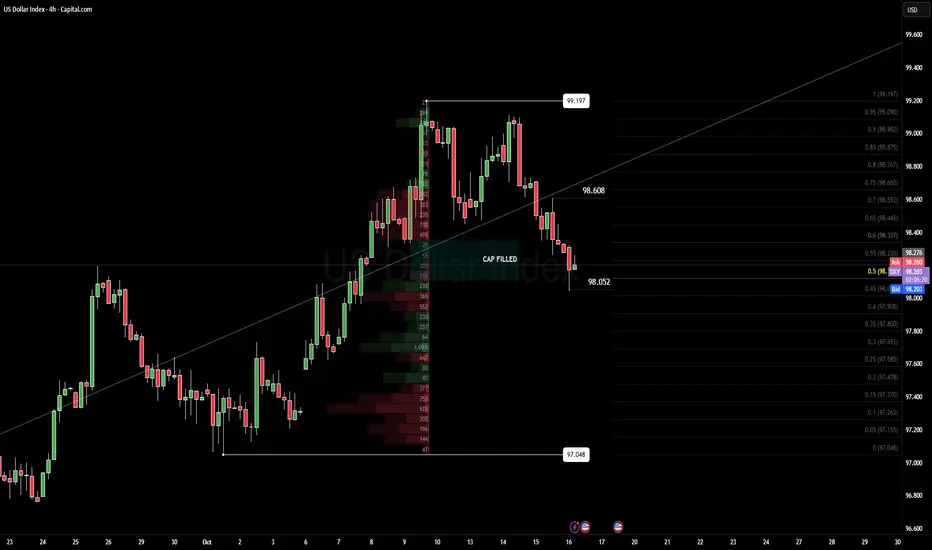
DXY UpdateDXY — The Volume Cap: Where Momentum Meets Memory
Every market has memory — and in the Dollar Index, it’s sitting right at 97.4.
That’s the current Volume Cap — a zone where heavy participation once stopped price cold, leaving unfinished business behind.
Price loves to revisit these caps, testing whether the imbalance still holds or finally gives way.
⚙️ Context (4H | Friday Recap)
Friday delivered heavy volume and clean directional flow — a textbook session.
DXY continues to rotate within the 97.048–99.198 range, holding a short-term bullish tone inside a larger consolidation.
📊 Technical Map
• Structure: Long-term bearish range inside a broader consolidation phase.
• Momentum: Still bullish, but showing early fatigue.
• Volume Cap: The 97.4 level remains unfilled, acting like a magnet for potential retests — the true battleground between continuation and correction.
🌐 Fundamental Pulse
After a month of running hot, the dollar finally cooled.
Retail Sales and Industrial Production softened, yields eased, and traders started whispering “rate cuts” again.
The Fed’s cautious tone keeps volatility contained ahead of next week’s Core PCE inflation data.
🧭 Trade Plan (If/Then)
If DXY runs through 97.4, watch for a bearish Volume Cap flip — potential downside toward nearby support.
If Monday’s price action drives higher, expect bullish momentum rotation back toward the 97.0 retest region.

DOLLAR INDEX 97.999-98 IF RESPECTED A S A BUY FLOOR THEN consider to selll GOLD ,SILVER COPPER eurusd sell,audusd sell,usdjpy buy,gbpusd sell, usdzar buy .
the dollar index is the measure of the value of us dollar to basket of six other mejor currency and its affected by the price action of US10Y.
LAYER BY LAYER .
DONT RUSH
#DOLLAR #DXY

DXY LOCAL SHORT|
✅DXY price is reacting to a confirmed ICT supply level, showing a clean mitigation from the imbalance zone. As long as this level holds, sellers may target the short-term liquidity resting below 98.30. Time Frame 2H.
SHORT🔥
✅Like and subscribe to never miss a new idea!✅

dxy similar to the last 3 mull markets dxy has broken down from it highs
last week dxy tried to break out of the range to be just put back into the range
so expect a continuation into low 90's , will it bottom at 93 or go lower to 89 , i something to be seen

Elliott wave analysis of the DXYThis is a full blown Elliott wave analysis of the DXY, the US Dollar Index.
I show three possible scenarios. Both the macro and current wave forms are analyzed.

2025 – The Year of the Normalized Dollar (Episode 2)2025 – The Year of the Normalized Dollar (Episode 2) 📉💵
📆 Feb 25 was just the beginning — and now we’ve got confirmation.
DXY couldn’t hold above structure, and the drop is on. What began as a quiet theme is turning into the macro headline:
The King Dollar is softening... on purpose.
🔍 Chart Context
• 🔴 Rejection at 112.3 — clean and brutal**
• 🔁 100.95 now flipped into resistance**
• 📉 Heading toward Target: 94.37** — the long-term structure low
The structure hasn’t changed — only the velocity has.
This isn’t a flash move. This is policy-meets-price.
🧨 Fundamentals: Trump’s Soft Dollar Doctrine
Back on January 23, Trump told the world exactly what he wanted:
“I’d like to see interest rates come down… a lot.”
“Oil down, prices down, inflation gone — and then rates down.”
Translation?
💵 A weaker dollar to fuel exports, ease debt loads, and juice the real economy.**
This is not weakness — it’s a recalibration.
Add in:
• Tariffs + labor policy inflation
• Pressure on Powell
• Geopolitical chess moves (Putin negotiations, Middle East detente)
→ and you’ve got a coordinated softening playbook.
📉 What’s Next?
• 🔹 Break 98 = Target 94.37 opens wide
• 🧱 If 94 cracks, we’ll re-assess — but for now, that’s the magnet
• DXY needs a miracle to reclaim strength without Fed resistance easing
2025 could be the year the dollar gets normalized by force — not finesse.
🔄 Perspective Shift 🔄
This isn’t dollar death — it’s dollar diplomacy.
Strong enough to hold global weight, soft enough to boost Main Street.
You think this isn’t coordinated? Look again. 📡
One Love,
The FXPROFESSOR 💙
First episode:
⚠️ I’m not a financial advisor — just a philosopher with better chart vision than 99% of the noise out there. What I share is my view, not a signal. You trade? You’re responsible. Just don’t blame me when I’m right again.

17.10.25 Morning ForecastJust a heads up! I will be in Italy the beginning of next week, so most likely will not be able to upload any video forecasts. I will do my best to post what I am looking at for the day to keep you guys in the loop. From Thursday next week I will be back to normal schedule 🫡
Pairs on Watch -
FX:USDJPY
A short overview of the instruments I am looking at for today, multi-timeframe analysis down to what I will be looking at for an entry. Enjoy!

DXYThe dollar just isn’t getting much love lately. It’s been losing steam, struggling to bounce, and the charts aren’t helping its case. With talk of the Fed easing up and other currencies picking up strength, there’s not much keeping the dollar afloat right now. Unless something shifts, it looks like the dollar could stay under pressure for a while.

DOLLAR Technical & Order Flow AnalysisOur analysis is based on a multi-timeframe top-down approach and fundamental analysis.
Based on our assessment, the price is expected to return to the monthly level.
DISCLAIMER: This analysis may change at any time without notice and is solely intended to assist traders in making independent investment decisions. Please note that this is a prediction, and I have no obligation to act on it, nor should you.
Please support our analysis with a boost or comment!
DXY: Bears Are Winning! Short!
My dear friends,
Today we will analyse DXY together☺️
The recent price action suggests a shift in mid-term momentum. A break below the current local range around 98.135 will confirm the new direction downwards with the target being the next key level of 98.012 and a reconvened placement of a stop-loss beyond the range.
❤️Sending you lots of Love and Hugs❤️

US Dollar: Bullish! The Pullback To Support Is An Opportunity!Welcome back to the Weekly Forex Forecast for the week of Oct 13 - 17th.
In this video, we will analyze the following FX market: USD Dollar
The USD was bullish all of last week, except for Friday. Pres. Trump announced China tariffs and the market dumped. For me, this is a market knee jerk reaction, and temporary in nature. I am looking for the DXY to continue higher this coming week, rendering last Friday's candle as only a pullback to support.
There is an opportunity here for buyers, in my opinion.
Enjoy!
May profits be upon you.
Leave any questions or comments in the comment section.
I appreciate any feedback from my viewers!
Disclaimer:
I do not provide personal investment advice and I am not a qualified licensed investment advisor.
All information found here, including any ideas, opinions, views, predictions, forecasts, commentaries, suggestions, expressed or implied herein, are for informational, entertainment or educational purposes only and should not be construed as personal investment advice. While the information provided is believed to be accurate, it may include errors or inaccuracies.
I will not and cannot be held liable for any actions you take as a result of anything you read here.
Conduct your own due diligence, or consult a licensed financial advisor or broker before making any and all investment decisions. Any investments, trades, speculations, or decisions made on the basis of any information found on this channel, expressed or implied herein, are committed at your own risk, financial or otherwise.

Will DXY Sustain The Pressure Amid Current Uncertainties?Fundamental approach:
- The US dollar retreated this week, pressured by expectations of continued Fed easing and signs of emerging economic weakness.
- The Fed's latest Beige Book revealed that economic activity remained flat, with increasing layoffs across districts, and middle- to lower-income households reducing their spending, reinforcing dovish expectations. Chair Powell's scheduled remarks and the ongoing government shutdown, which began on 1 Oct, have delayed critical data. The Sep NFP was not released, and the Sep CPI is rescheduled for Fri, 24 Oct, adding to the uncertainty surrounding the dollar's outlook.
- Meanwhile, the euro gained ground as European currencies strengthened against the greenback, with the dollar down around 10% YTD.
- The dollar may face continued downside pressure as markets await the Fed's October 28-29 meeting, where a 0.25% rate cut is widely anticipated. However, delayed economic data releases could inject volatility into near-term trading.
Technical approach:
- DXY is trading within the ascending channel and retesting the support at 98.60. The index is slightly above both EMAs, indicating the upward momentum persists.
- If DXY remains above the key support at 98.60, confluence with the ascending channel's lower bound, the index may rise to retest the psychological resistance at 100.00.
- On the contrary, breaking below the support and both EMAs may prompt the DXY to retest the following support at 97.15.
Analysis by: Dat Tong, Senior Financial Markets Strategist at Exness

DXY — 4H Fibonacci Discount ZoneDXY — 4H Fibonacci Discount Zone: bounce or breakdown?
Context (4H | Pre-London | 16 Oct)
Dollar Index is testing a 50% Fibonacci discount zone after an overnight -2 deviation.
Volume remains light, but buyers stepped in near the 98.2 region, defending short-term structure.
Big picture still leans bearish
Technical Map
• Structure: Consolidation within broader bearish context — 4H recovery attempts forming.
• Key Level: 98.2 acting as short-term decision point; deviation off 50% Fib zone.
• Momentum: −2 deviation within 4H range — early shift toward mean reversion.
• Volume: Heavy order flow support beneath 98.0; thin liquidity overhead until 98.6.
Structure overall remains bearish, but short-term momentum favors a corrective bid from the Fibonacci discount zone.
Fundamental Pulse
The Fed minutes gave us a small dip in yields, but the Dollar didn’t flinch — it’s still holding firm.
Sticky inflation keeps the Fed cautious, reinforcing that “higher-for-longer” tone.
Now all eyes turn to today’s CPI at 15:30 EET — the real test for rate expectations.
For now, rates steady, risk tone calm, traders waiting for direction.
Plan (If/Then)
If DXY pushes above 98.6, expect momentum toward the 99.0 zone.
Break below 98.05 reopens path toward 97.6–97.4 support band.
R:R potential ≈ 1 : 3 — solid setup if volatility expands post-CPI.
Stay patient and scale small before the CPI lands.
Mindset Pulse
Observation beats anticipation.
Let price confirm your story, not the other way around.
Stay aligned with structure; one mouse click can cost a narrative.
16.10.25 Morning ForecastPairs on Watch -
FX:EURUSD
FX:GBPUSD
FX:GBPCAD
A short overview of the instruments I am looking at for today, multi-timeframe analysis down to what I will be looking at for an entry. Enjoy!

Dollar Index Big Map: Trend Is Your Friend This year, the dollar has been in the red all the way down — until it hit the strong support line of a multi-decade uptrend (white). From there, it bounced to the upside. So, what’s next?
I’d like to share with you a big map of the Dollar Index.
I assume that we are still within the large second leg ((Y)) of the ((WXY)) corrective structure (white).
Within this structure, we can see a smaller-degree (WXY) correction (blue).
Currently, the market is moving in the last leg C of the final upward move in blue wave (Y).
Many times, I’ve observed how beautifully these wave structures align with strong pivot points.
The ultimate target for wave ((Y)) is near the top of wave ((W)), around 121.
This level also matches the target where blue wave (Y) equals blue wave (X) — an amazing correlation!
There are two key confirmation levels marked on the map:
Bullish confirmation — above 110 (this would invalidate the bearish scenario).
Bearish confirmation — below 89 (this would invalidate the ((WXY)) structure).

