DXY Analysis – Bullish Structure Still IntactIn my latest DXY analysis, I mentioned that the 100.00 level remains the next key target for the U.S. Dollar Index.
After an initial push higher to 99.55, the index faced some selling pressure and is now trading slightly below 99.00.
However, the constructive bullish structure remains intact as long as price holds above the 99.60 support zone.
________________________________________
1. Technical Context
• The recent pullback looks more like a healthy correction rather than a trend reversal.
• The higher-lows pattern remains valid, keeping the bullish momentum alive.
• The 99.60 area now acts as a key pivot zone — holding above it favors a renewed push toward 100.00.
________________________________________
2. Trading Implications
Given this setup, selling rallies in EUR/USD and GBP/USD remains the preferred strategy, as both pairs are likely to face renewed dollar strength once DXY resumes its upward leg.
________________________________________
In short:
The Dollar Index remains bullish.
As long as 99.60 holds, the path of least resistance stays upward — and 100 remains on the radar. 🚀
Trade ideas

Dxy index on high time frame
"Focusing on the DXY index on the high time frame, a downward trend is observed on the daily time frame. Utilizing the liquidity concept, the price has swept liquidity and appears poised for a decline. The first potential target could be around 97.5."
If you have more insights to share or need further assistance, feel free to let me know!

DXY Trade Plan 13/10/2025Dear Traders,
💵 U.S. Dollar Index (DXY) Analysis – 16H Timeframe
📅 October 13, 2025
The U.S. Dollar Index (DXY) remains in a mid-term consolidation phase, but recent bullish momentum suggests that a new upward leg may soon begin.
After testing resistance near 99.10, DXY is showing signs of a short-term pullback. The 97.50–97.80 area (highlighted in blue) stands out as a strong demand/support zone, aligning with previous structure and horizontal support levels.
If the index manages to hold above this area, a bullish reversal from this zone could trigger a continuation move toward the 102.00–102.10 resistance level — the next major upside target.
This scenario would align with a potential recovery in USD strength across major pairs, particularly if macro data supports tightening or a risk-off sentiment in markets.
📊 Summary:
Overall Trend: Bullish bias after correction
Key Support Zone: 97.50 – 97.80
Key Resistance Target: 102.00 – 102.10
Scenario: Waiting for a pullback into 97.5–97.8 zone for a possible long continuation toward 102
Regards,
Alireza!

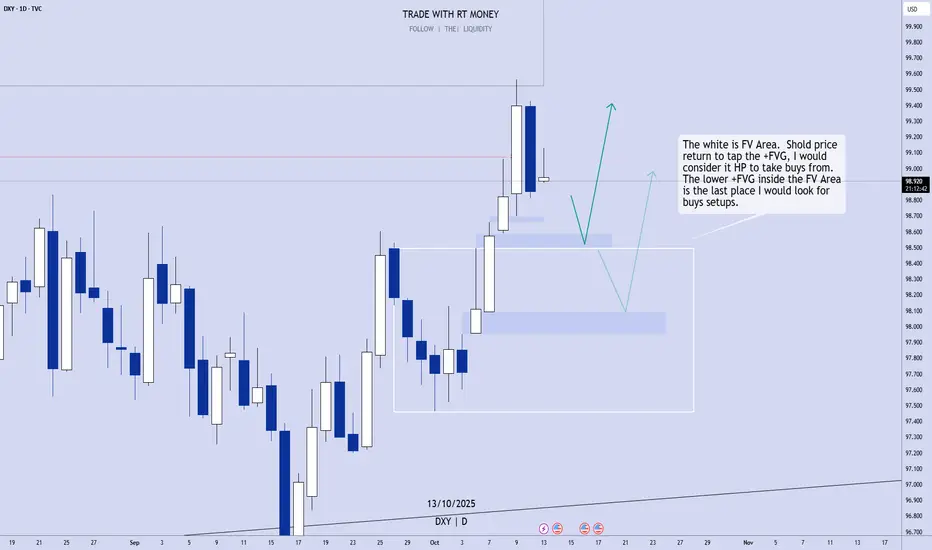
US Dollar: Still Bullish. Wait For Buy Setups!Friday's candle notwithstanding, the USD is strong, and still bullish. Taking sells into the bullish Fair Value Area is not a good option. Looking for buys at the _FVGs is!
Enjoy!
May profits be upon you.
Disclaimer:
I do not provide personal investment advice and I am not a qualified licensed investment advisor.
All information found here, including any ideas, opinions, views, predictions, forecasts, commentaries, suggestions, expressed or implied herein, are for informational, entertainment or educational purposes only and should not be construed as personal investment advice. While the information provided is believed to be accurate, it may include errors or inaccuracies.
I will not and cannot be held liable for any actions you take as a result of anything you read here.
Conduct your own due diligence, or consult a licensed financial advisor or broker before making any and all investment decisions. Any investments, trades, speculations, or decisions made on the basis of any information found on this channel, expressed or implied herein, are committed at your own risk, financial or otherwise.
DXY key levels to look out for this week (WC 13/10)DXY key levels for the following week ahead. With Thursday heavy on USD news releases.

DXY - Dollar Could Rise if Fed's Cook Wins Fight Against Her DiDollar investors would express relief if U.S. courts thwart President Trump's attacks on the Federal Reserve, Commerzbank's Thu Lan Nguyen says in a note. A court on Friday heard Fed Governor Lisa Cook's request for a temporary retraining order to block Trump from removing her from the role. The hearing ended without a ruling. Trump faces the threat of a defeat as it seems questionable whether the grounds for Cook's dismissal are legally valid, Nguyen says. If the Fed's independence holds firm and the court rules against Cook's dismissal, the dollar could rise. "However, the courts' final ruling is still pending. It's "by no means guaranteed" that Trump would accept a ruling against him, she says.

Like I said, DXY is now bearish. Buy Eurusd et alI published a trade idea before the big move down - It still stands, dxy is bearish. So just look for counter buy on EURUSD, GBPUSD et others.
Go through my page and see for yourself, if it comes to dxy and EUR, I'm hardly wrong. Don't miss this trade, trade accordingly
I think fundamental always wait for price to reach a specific level (technical) before news comes. How the hell did Trump start tariffing China once we entered that weekly FVG. It really amazes me.
All things been equal, liquidity is now remaining on the sell side and we will start looking for buy, if and only if those liquidity are taken.
These are levels we should keep eyes on as potential TP
TP 1 @ 97.96
TP 2 @ 97.46
TP 3 @ 96.215
DXY is still bearish, dont miss this trade. It may probably be the last ride down before we see higher dxy, I will update you guys then
Enjoy

Pair: DXY Date: 12 October 2025Market Context:
Price showed a rejection from the daily trend area around 98.997 – 99.193, creating a new downward movement.
Possible Scenarios:
1. Bearish continuation:
Price may continue toward the next support area at 98.300.
2. Short-term pullback:
Price could retrace to fill the previous IMB (Imbalance) and form a consolidation zone before continuing its move

Bullish bounce?The US Dollar Index (DXY) is falling towards the pivot which is a pullback support and could bounce to the 1st resistance.
Pivot: 98.54
1st Suport: 96.63
1st Resistance: 101.95
Disclaimer:
The above opinions given constitute general market commentary, and do not constitute the opinion or advice of IC Markets or any form of personal or investment advice.
Any opinions, news, research, analyses, prices, other information, or links to third-party sites contained on this website are provided on an "as-is" basis, are intended only to be informative, is not an advice nor a recommendation, nor research, or a record of our trading prices, or an offer of, or solicitation for a transaction in any financial instrument and thus should not be treated as such. The information provided does not involve any specific investment objectives, financial situation and needs of any specific person who may receive it. Please be aware, that past performance is not a reliable indicator of future performance and/or results. Past Performance or Forward-looking scenarios based upon the reasonable beliefs of the third-party provider are not a guarantee of future performance. Actual results may differ materially from those anticipated in forward-looking or past performance statements. IC Markets makes no representation or warranty and assumes no liability as to the accuracy or completeness of the information provided, nor any loss arising from any investment based on a recommendation, forecast or any information supplied by any third-party.

DXY Demand Area! Buy!
Hello,Traders!
DXY pulls back into a well-defined horizontal demand area, aligning with ICT displacement logic. A bullish reaction from this level may confirm accumulation before expansion toward 99.10 liquidity. Time Frame 3H.
Buy!
Comment and subscribe to help us grow!
Check out other forecasts below too!
Disclosure: I am part of Trade Nation's Influencer program and receive a monthly fee for using their TradingView charts in my analysis.

Out into Right-field she goes!-⚠️ Market Forewarning: Potential Weakness in the U.S. Dollar (USD)
Issued on: October 12, 2025
Prepared by:
Disclaimer: The following is for informational and educational purposes only and does not constitute financial advice. Trading and investing involve risk. Please consult a licensed financial advisor.
Overview:
Based on a convergence of technical indicators, macroeconomic factors, and cyclical analysis, we are issuing a forewarning regarding potential near- to mid-term weakness in the U.S. dollar (USD).
Recent developments in the global macroeconomic landscape—paired with emerging technical patterns—suggest that the greenback may be entering a corrective or even impulsive decline phase, particularly against major currency pairs such as the EUR/USD, GBP/USD, and JPY/USD.
🔍 Technical Analysis Breakdown:
1. Supply and Demand Ray Line Zones
The DXY (U.S. Dollar Index) is currently testing a multi-month supply zone between 108.50 – 109.30, which has historically acted as a reversal region.
Demand zones below near 104.00 – 103.20 have weakened after multiple tests, suggesting a likely breakdown and continuation of downward momentum.
The ray line trend indicates supply is overtaking demand, as evidenced by fading bullish volume and weaker retracements on rebounds.
2. Elliott Wave Pattern
The broader wave structure from the March 2024 low appears to have completed a 5-wave impulsive cycle, peaking around September 2025.
Current price action suggests we are in the early stages of an A-B-C corrective wave:
Wave A likely concluded in early October with a sharp drop.
A shallow Wave B retracement is in progress but struggling to reclaim previous highs.
If pattern symmetry holds, Wave C could extend toward the 102.00 – 101.50 zone, in line with Fibonacci projection levels (1.618 extension of Wave A).
3. Pivot Market Points
October’s monthly pivot point lies around 105.80, and price is trading consistently below it — a bearish sign.
Key support pivots reside at 104.20 (S1) and 102.75 (S2); a breach below these levels could confirm further downside.
Resistance at the 107.60 – 108.00 range remains firm and unbroken.
🔮 Forward Outlook: Bearish Bias
Given:
Sustained rejection from a known supply zone,
A likely Elliott Wave correction unfolding,
And consistent trading below pivot levels,
…we anticipate a bearish trajectory for the USD over the next 1–3 months, barring a major macroeconomic shock or intervention.
Target zones:
Short-term: 104.20
Mid-term: 102.00
Risk invalidation: Close above 109.50 with strong bullish volume
📉 Key Drivers to Watch:
U.S. Federal Reserve commentary and policy shifts
Treasury yields and bond market stress
Geopolitical developments impacting safe-haven flows
Inflation print volatility (CPI/PPI releases)

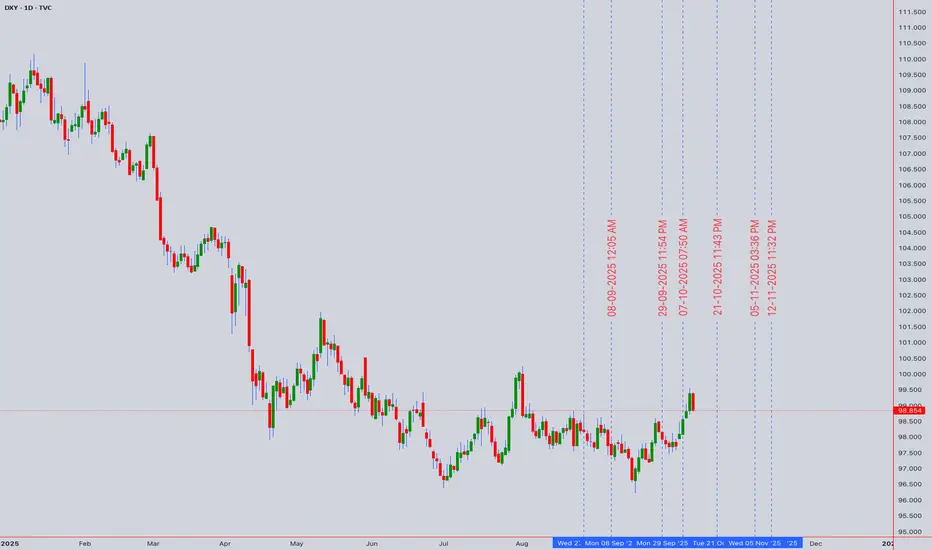
Dollar at Max Deviation — Watching 99.197 CloselyThe dollar had another wild week, closing around 99.197 — right on the edge of major structure.
Most traders see strength, but when you zoom out, this move looks stretched.
Yields have started to cool off, which takes pressure off the dollar’s safe-haven run.
We still got smaller data releases like PMIs and Fed talks, but the big stuff like CPI is on hold until the U.S. shutdown clears.
Even the IMF warned about growing liquidity risks in global FX — meaning sudden spikes or fake outs can happen fast when markets get thin.
Technically, we’re in a bearish zone on the higher timeframe.
The last three months of liquidity targets are already taken, and the market’s now trading inside maximum deviation — a point where algorithms usually reset before any new trend forms.
That’s why 99.197 matters: it’s the last shelf before structure confirms the drop.
If price breaks and holds below that level early next week, momentum likely shifts bearish.
If it holds above, expect more sideways chop before a correction.
For now, it’s all about patience and tracking structure — not emotions.

DXY - 3 SCENARIOS - TRADING WEEK 13 - 17 OCTOBER 2025NEXT WEEK I FORESEE THREE DIFFERENT SCENARIO FOR THE DXY AS FOLLOW:
- THE DXY COULD POTENTIALLY USE 98.600 AS A SUPPORT ON THE WAY UP TO 99.600, 100.200 AND POSSIBLY 101.395
- (MY FAVOURITE) THE INDEX COULD BREAK 98.600 AND LOWER TO 97.800/97.700 COVERING LAST WEEk GAP AND RALLY-UP TROUGH THE WEEK
- IF THE INDEX BREAKS 97.700 WITH MOMENTUM WE COULD SEE A RE-TEST AND THE INDEX RALLYING DOWN FROM THERE CHALLENGING THE PREVIOUS LOW 96.260 (17 SEPTEMBER 2025) AND SEEK NEW LOWS.
Always be reactive rather than predictive, these 3 scenarios are well valid and i don't think we will see a fourth scenario ...
Please like, comment and share this idea if you liked it, I will keep updating it as the market starts

DXYDXY has given us push up last week, now it needs correction or impulse down.
Disclosure: We are part of Trade Nation's Influencer program and receive a monthly fee for using their TradingView charts in our analysis.

mrmoney limited DXY position/swing trading ideaprice has reacted from our monthly support level giving us pin bar which created a double bottom on the weekly time frame looking for mor bullish move for the time being except price reacts on our resistance level

Th Dollar rallies ⚠️ What Traders Must Know for Next Week
The US government shutdown fundamentally changes the trading environment for the week ahead by creating a severe "information vacuum."
A. The Data Blackout is the Biggest Risk
Delayed Critical Data: Key federal economic reports—such as the Consumer Price Index (CPI) and Non-Farm Payrolls (NFP)—are suspended until funding resumes. These are the reports the Federal Reserve uses to make policy decisions.
The "Flying Blind" Problem: Without objective, reliable inflation and employment data, the Federal Reserve and investors are "flying blind." This uncertainty forces traders to rely on technical analysis, geopolitical headlines, and potentially less reliable private-sector indicators (like ADP or private sentiment surveys).
Volatile Swings: The lack of scheduled market-moving news means any single, unconfirmed headline (e.g., a "leak" on a negotiation, a new tariff threat, or a surprise private data release) could trigger vicious, whipsaw price corrections due to thin liquidity and high uncertainty.
B. Trading Strategy Adjustments
Reduce Exposure: Consider decreasing your overall position sizes to manage the heightened, unpredictable volatility created by the data vacuum.
Focus on Cross-Pairs: Shift focus to non-USD pairs (e.g., EUR/JPY, AUD/NZD) where the primary fundamental drivers are clearer and not distorted by the US shutdown.
Monitor Geopolitics: The Dollar's strength is brittle. Any resolution on the trade war or signs of stability in Europe or Japan could quickly reverse the USD rally.
Look for Clues Outside the US: Pay extra attention to foreign economic calendars (like Chinese trade and inflation figures, or Australian employment data) to gauge global risk sentiment in the absence of US information.
The US Dollar enters the new week strong, but this strength is built on shaky foundations. Prudent traders must prioritize risk management over aggressive trend-following until the data flows from Washington are restored.

DXY 4H🔹 Overall Outlook and Potential Price Movements
In the charts above, we have outlined the overall outlook and possible price movement paths.
As shown, each analysis highlights a key support or resistance zone near the current market price. The market’s reaction to these zones — whether a breakout or rejection — will likely determine the next direction of the price toward the specified levels.
⚠️ Important Note:
The purpose of these trading perspectives is to identify key upcoming price levels and assess potential market reactions. The provided analyses are not trading signals in any way.
✅ Recommendation for Use:
To make effective use of these analyses, it is advised to manually draw the marked zones on your chart. Then, on the 5-minute time frame, monitor the candlestick behavior and look for valid entry triggers before making any trading decisions.

Weekend breakdown 11.10.2025Diversified watchlist for upcoming week.
Seems like the Q4 momentum is on its way
TVC:DXY
FX:GBPUSD
FX:USDJPY
FX:EURAUD
FX:AUDJPY

DXY Technical Analysis: Navigating Key Juncturre1. Big Picture & Market Context
The DXY is consolidating near a critical technical juncture. Geopolitical tensions and shifting rate expectations continue to be the primary drivers, creating volatility perfect for both intraday scalps and strategic swing positions.
2. Multi-Timeframe Technical Snapshot
Monthly/Weekly (Swing): Price is squeezed between the 50-week EMA (support ~98.20) and the 200-day SMA (resistance ~99.50). A decisive break either way will set the medium-term trend.
Daily (Swing & Intraday Bias): The chart shows a potential bearish flag formation following the recent decline. RSI (14) is neutral at 48, offering no extreme bias. The Ichimoku Cloud is thick above price, representing a significant resistance zone.
3. Elliott Wave & Harmonic Perspective
The pullback from the 100.50 high is being analyzed as either a Wave 4 (corrective) or the start of a larger bearish impulse. The key Harmonic zone for a potential bullish reversal (Bat pattern) lies between 98.30 - 98.50.
4. Key Support & Resistance Levels
Strong Resistance: 99.50 (200-day SMA & prior swing high)
Minor Resistance: 99.10 (Intraday)
Immediate Pivot: 98.85 (Current Price)
Strong Support: 98.50 (50-week EMA & 50% Fibonacci)
Critical Support: 98.20 (Breakdown Level)
5. Gann & Wyckoff Analysis
Gann Square of 9: Key levels align with 98.50 (support) and 99.20 (resistance). A close above 99.20 could trigger a run towards 99.80.
Wyckoff Cycle: Price action suggests we are in a possible Re-Distribution phase. A failure to hold 98.50 would signal a new Markdown phase, targeting 97.80.
6. Intraday Trading Strategy (5M-1H Charts)
Bullish Scenario (Long):
Entry: 98.55 - 98.65 (with bullish reversal candlestick confirmation)
Stop Loss: 98.35
Take Profit 1: 98.95
Take Profit 2: 99.15
Bearish Scenario (Short):
Entry: 99.05 - 99.10 (with bearish rejection confirmation)
Stop Loss: 99.30
Take Profit 1: 98.70
Take Profit 2: 98.50
7. Swing Trading Strategy (4H-Daily Charts)
Swing Long:
Entry Zone: 98.30 - 98.45 (Accumulation Zone)
Stop Loss: 97.90 (Daily Close)
Target 1: 99.20
Target 2: 99.80
Swing Short:
Entry Trigger: Daily close below 98.20
Stop Loss: 98.60
Target 1: 97.80
Target 2: 97.20
8. Indicator Cluster Consensus
Bollinger Bands: Price is trading in the upper band, indicating neutral momentum. A squeeze is forming, signaling a volatility expansion is due.
Anchored VWAP: (Anchored at last swing high) Price is below VWAP, indicating a Weak Bearish medium-term trend.
Moving Averages: The 50 EMA is about to cross below the 200 SMA on the 4H chart—a potential "Death Cross" warning for the week ahead.
Final Verdict: The DXY is at a make-or-break level. The bias is cautiously bearish below 99.10. The 98.50-98.20 zone is critical; a hold there could spark a relief rally, while a break opens the door for a significant swing down.
Disclaimer: This is technical analysis, not financial advice. Always manage your risk and use stop-loss orders.
DOLLAR INDEX DXY The US Dollar Index (DXY) recently traded around 98.85 on October 10, 2025, experiencing a slight decline after a daily rejection from a supply roof @ 99.516 the dxy is standing on a daily support structure and lack momentum after the FOMC MEETING , the federal reserve under the chairman control of sir, Jerome Powell cut cut rate by 25basis point from 4.25%-4.5% to 4.0%-4.25%.
The next Federal Open Market Committee (FOMC) meeting is scheduled for October 28-29, 2025. During this two-day meeting, the committee will discuss and decide on U.S. monetary policy, including the federal funds rate.
Federal Funds Rate Decision Outlook:
The Fed is widely expected to cut the federal funds rate during this meeting to support economic growth amid recent uncertainties.
The current federal funds rate stands at a range of 4.00% to 4.25%. previous 4.25%-4.5% representing a 25basis point cut .
The exact size of the new rate cut and forward guidance will depend on economic data and conditions leading up to the meeting.
key Economic data tools used by FEDS .
These indicators help the Fed assess the state of the economy, inflationary pressures, employment levels, and overall growth, enabling it to set appropriate monetary policy.
(1)Inflation Measures
Consumer Price Index (CPI): Measures the average change in prices paid by consumers for goods and services.
(2)Personal Consumption Expenditures (PCE) Price Index: The Fed’s preferred inflation gauge that measures changes in prices for goods and services consumed by individuals, especially the core PCE excluding volatile food and energy prices.
(3)Employment Data
Non-Farm Payrolls: Monthly report on the number of jobs added or lost in the economy, excluding farms. It's a primary gauge of labor market health.
(4)Unemployment Rate: Percentage of the labor force that is unemployed and looking for work.
Labor Force Participation Rate: Measures the percentage of working-age population active in the labor market.
(5)Gross Domestic Product (GDP)
Measures the overall economic output and growth. The Fed looks at quarterly GDP data to understand economic momentum.
(6)Retail Sales and Consumer Spending
Consumer spending accounts for a large portion of economic activity; strong spending may indicate economic strength, influencing Fed decisions.
(7)Manufacturing and Service Sector Data
Reports like the ISM Manufacturing and Non-Manufacturing Indices provide insight into business activity.
Wage Growth and Productivity
Rising wages can signal inflationary pressures, while productivity affects economic efficiency.
(8)Stock market trends, bond yields (e.g., 10-year Treasury yield), and credit market conditions also influence the Fed’s outlook.
(9)JOHN TYLOR RULE.
The Federal Reserve looks at the Taylor Rule during rate decision-making because it provides a systematic, rules-based framework that links key economic variables to the appropriate level of the federal funds rate. the rule helps policymakers gauge whether monetary policy is too tight, too loose, or appropriate based on inflation and economic output.
Why the Fed Considers the Taylor Rule:
Framework for Monetary Policy:
The Taylor Rule offers a clear formula that relates the federal funds rate to inflation deviations from the target (usually 2%) and the output gap (difference between actual GDP and potential GDP). This helps the Fed set interest rates consistent with its goals of stable prices and maximum employment.
Balancing Inflation and Growth:
The rule suggests raising interest rates when inflation is above target or the economy is growing too rapidly (closing output gap), which can prevent overheating and inflationary pressures. Conversely, it recommends lowering rates when inflation is below target or growth is sluggish, supporting economic expansion.
Rule vs. Discretion:
While the Fed retains discretion, the Taylor Rule enhances transparency and predictability in policy decisions, providing a benchmark for evaluating whether current rates align with economic conditions.
Historical Relevance:
The Taylor Rule has been found to approximate the Fed’s policy stance over several decades and helps discipline monetary policy amid economic fluctuations.
Policy Communication:
It aids clear communication to markets and the public about the rationale behind rate moves, reducing uncertainty.
Summary
The DXY reflects the value of the US dollar versus a basket of six major currencies, with the euro composing about 57.6% of the index followed by the Japanese yen, British pound, Canadian dollar, Swedish krona, and Swiss franc.
The US 10-Year Treasury Yield (US10Y) is currently around 4.058% daily open 4.1375 daily close 4.058%, representing the yield investors receive on US government debt with a 10-year maturity. The yield level is a significant driver of financial markets and often correlates with the strength of the US dollar.
Relationship
Generally, a higher US10Y yield tends to support a stronger DXY because higher yields attract international capital, increasing demand for the US dollar.
Movements in DXY and US10Y can also be affected by geopolitical risks, monetary policy expectations, and macroeconomic data, leading to short-term deviations.
THE DXY AND US10Y ARE YOUR TRADING BAROMETER AS A TRADER.
WHEN DXY IS UP EURUSD,AUUSD,USDJPY,USDZAR,USDCAD,NZDUSD,GBPUSD,THEY GO DOWN BECAUSE OF INTERNAL CARRY TRADE ACTIVITIES, BOND YILED AND INTEREST RATE DIFFERENTIAL IN THE FX WINDOW.
WE NEED INSIGHT INTO THE BIS (BANK OF INTERNATIONAL SETTLEMENT TRANSACTION ACTIVITIES TOO.
FOREX IS EDUCATION 100%.
RISK MANAGEMNET
100% PROBABILITY BASED ON ECONOMIC DATA AND FUNDAMENTAL ANALYSIS.
#DXY #US10Y #DOLLAR #BOND #YIELD.
GOODLUCK

10.10.25 Morning ForecastPairs on Watch -
FX:EURCAD
OANDA:XPTUSD
FX:CADJPY
A short overview of the instruments I am looking at for today, multi-timeframe analysis down to what I will be looking at for an entry. Enjoy!

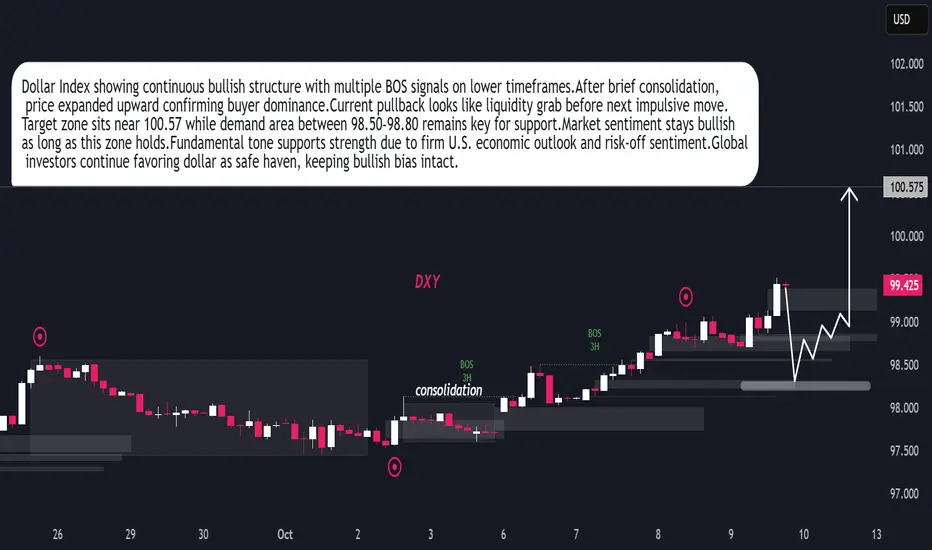
DXY Ready for Next Bullish Leg After Liquidity SweepDollar Index maintaining bullish structure after recent BOS on 3H timeframe.Market formed consolidation phase early October before expansion.Buyers showing control pushing price towards 100.57 objective.Current retracement indicates liquidity grab before next bullish impulse.Demand zone 98.50–98.80 remains key area for continuation.Technical sentiment stays positive as long as price holds above 98.50.Fundamentally, dollar supported by strong U.S. data and cautious global tone favoring safe-haven demand.Momentum outlook remains bullish with potential continuation toward 100.50+ zone.
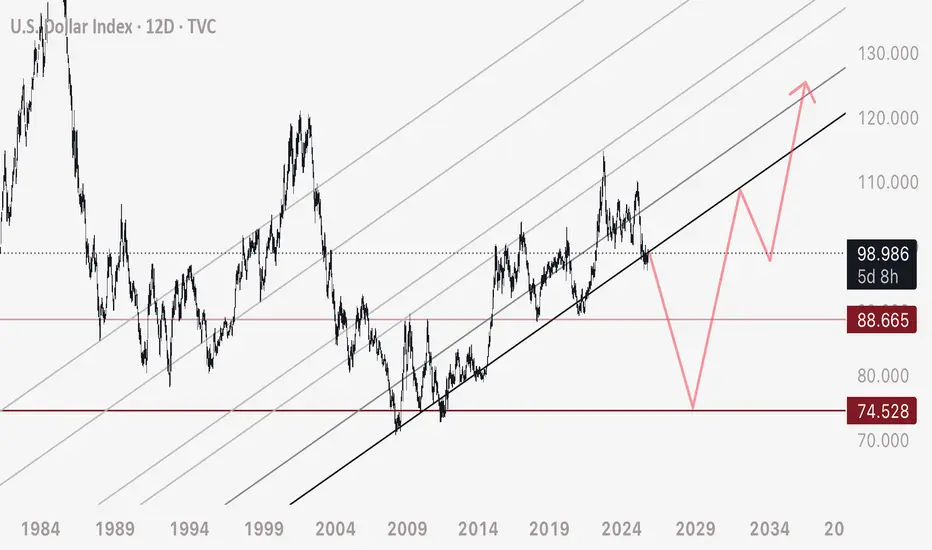
DXY - Major Breakdown of Ascending ChannelAs a preface here, I am not a Forex trader. I analyze DXY as a method for predicting manipulated moves on Bitcoin / Cryptocurrency.
Since I started with DXY analysis some 8 odd years ago, I’ve used the same channels. Price seems to (without argument) respect this channel and move in this fashion. So if anyone reading this has tips or knowledge I am missing. I’d appreciate the tips and insights.
I draw here my expected DXY path - and related to that, the span of a true bull market on stocks and equities (4-7 years long beginning current)
I’ll be using this post here to use as a reference for my analysis of a Bitcoin flash crash to 8,000 USD. Bitcoin has always seem to react to major pivots on DXY (in this case, a bearish retest).
Love and respect to all of you.
- DD