Trade ideas

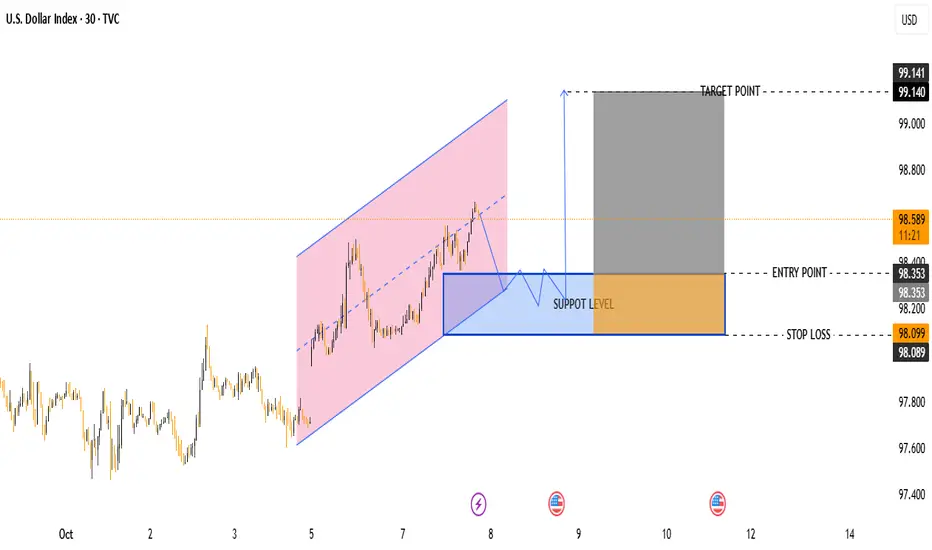
DXY Buy Opportunity – Support Retest Before Next Leg UpPair: U.S. Dollar Index (DXY)
Timeframe: 30 minutes
Current Price: 98.602
Trend: Short-term bullish channel (highlighted in pink)
🧭 Key Levels
Support Zone: 98.100 – 98.350
Entry Point: 98.353 (buy zone confirmation)
Stop Loss: 98.099 (below support)
Target Point: 99.140
📊 Market Structure
The price is moving within an ascending channel, showing a steady uptrend.
It has recently reached the upper boundary of the channel and is now expected to retrace toward the support zone (blue box).
After retesting this support level, a bullish continuation is expected.
🧩 Trade Idea
Plan: Wait for price to retest the blue support area.
If bullish candlestick confirmation appears (e.g., bullish engulfing, hammer), enter a buy trade near 98.350.
Stop Loss: below 98.099 (safe margin under support).
Take Profit: near 99.140, aligning with the top of the projected move.
Risk–Reward Ratio:
Approx. 1:3.5 — good reward compared to risk.
⚠ Possible Scenarios
1. ✅ Bullish Scenario:
Price respects the support level → breaks above 98.80 → continues to 99.14.
→ Confirms continuation of bullish trend.
2. ❌ Bearish Scenario:
Price breaks below 98.10 → invalidates bullish setup → channel structure fails → potential drop toward 97.80 zone.
📈 Conclusion
Current trend: Bullish, but waiting for a retracement and confirmation is key.
Buy zone: 98.35–98.10
Target: 99.14
Stop Loss: 98.09
NEW WORLD ORDER BLUEPRINT : THE GRAND DESIGN I have said everything in prior posts
but this analysis dates to ray dalios hegemony video
looks like this is the time
so dxy will rebound in value good news will spur the economic tank willthen crash trump vs powell you cant rig the economy couple this with the bad after taste of tariffs negative sentiment from the world no one coming to sretch their hand out then boom
ni hao wo jiao Lao Ban Muji, wo ai bin qili
ai, shuo, follow
zaijian

Bitcoin & DXY $ PA since 2008 shows BTC PA in ATH Zone - Why ?
Really easy one this.
There is only ONE Bitcoin ATH that happened when DXY PA was NOT on or below the Lower trend line that DXY PA has been in since 2008
And that was on the way lower but turned higher after the BTC ATH.
When I begain with Bitcoin in 2013, I was told, There is a correlation between DXY and BTC...."They go in opposite directions"
On smaller, this can appear to be False but looking at this Monthly chart, it Very clearly shows it is true.
The Day counts above are the days from when DXY first touches the upper trend line to the last week that PA touches the Lower trend line before rising higher again.
You can see that, apart from the 2nd ATH in 2021, there are 2 ATH for Bitcoin in the 2nd half of this day count.
The Green Box shows us the potential Zone for the next 2 BTC ATH. We have already reached a New ATH this "Cycle" but we have NO idea if a Higher ATH is Due or not.....We have to wait and see but the expectation is currently that we will.
The Vertical orange Dotted lines are previous USA election dates and I can see no real connection to these and DXY PA. Some are high, others are Low....However, the Next election is just after t his Bitcoin ATH Zone and so we may see some influences.
Something I also find interesting is how Bitcoin PA is rising in a similar way to how the DXY $ has since its Drash in 2008
The Monthly BTC chart
DXY since 2008 Monthly
You can clearly see the controlled rise and fall of PA within a channel,
This cycles Weekly Bitcoin chart is the first time we have seen that type of PA in a weekly cycle.
This is Bitcoin since Jan 2023 Weekly
So, we may have opposing PA action but we also have a similar style within a channel
Things to take note of.
We may have reached the BTC ATH zone already and we may not go higher, though the potential does exist to move further and, my opinion, is we will.
But it would be incredibly Nieve to assume it will go higher with out having some precautions in place.
Everyone talks about UPtober.
We have had RED Octobers - October 2012 was red and in the Middle f a Bull run
So Caution while we surf the crest of this Wave...
Just something I thought I would share.

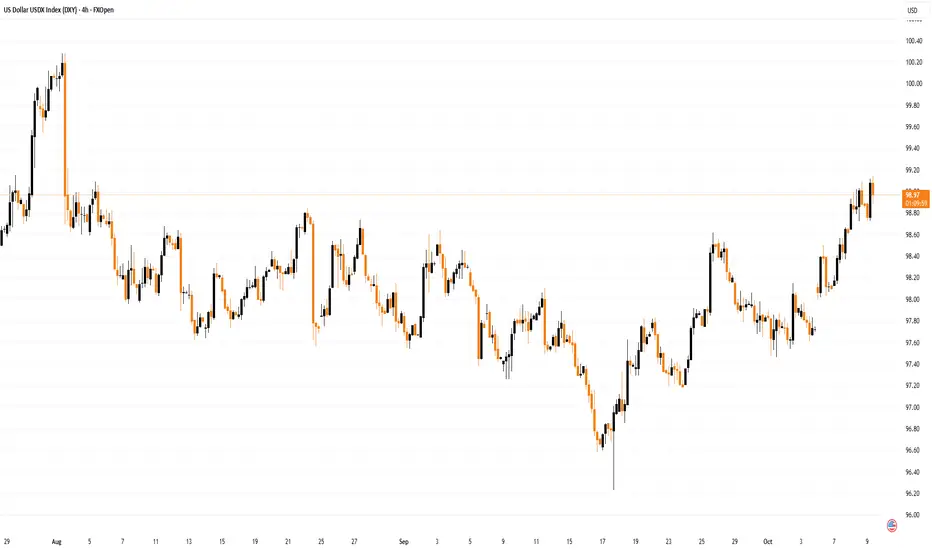
DXY to break resistance and open the door to further buying?From the US Dollar Index, you can see that the USD has regained some poise and rallied for four consecutive days this week.
This has led the DXY north of a 3M resistance at 98.33 – which is now a marked support level – and subsequently led price action to another 3M resistance level at 99.40. Despite the high of 100.26, formed on 1 August, a meaningful break of the current resistance level, paves the way for a move to a 1Y resistance at 101.43.
FP Markets Research Team

US Dollar RECAPDollar Index (DXY) — Range Heat Building
You’ve got a weekly bearish range, with a key high at 99.8 and price now trading into bearish distribution around 99.0.
The dollar’s been front and center this week — while Washington argues over funding, it’s been doing real damage across cross-asset charts.
Price has been printing higher lows all week, grinding inside this bearish range.
That’s your profit-taking zone, not an add-on zone.
Stay patient. Let the range speak.

USD Rate Cut Rally Continues, DXY Falling Wedge BreakoutI last looked at the build of a falling wedge in the USD in these pieces a couple of weeks ago, as we had a push of higher-highs and lows after the Fed's rate cut announcement.
That theme pushed to fresh highs today as DXY broke out of a falling wedge formation, and while the initial rally in October was very much pushed along by a weak Yen the move today is being prodded by a further breakdown move in EUR/USD.
The next significant test for DXY is just ahead, with the 100 level that's confluent with the swing low from last year at 100.22. This spot is what caught the high back in on August 1st after the post-FOMC breakout then, and that's the price that currently marks the four month high in the currency. Above that, it's the 102 level that caught the high back in May, which is also a Fibonacci level of note. - js

DXY- 4 HOUR TIMEFRAME ANALYSIS This is a clean and valid bullish channel on the U.S. Dollar Index (DXY), 4-hour timeframe. Let’s break it down technically and structurally 👇
---
🔹 Overall Trend: Strong Bullish Structure
The DXY is trending inside a well-defined ascending channel, showing higher highs and higher lows — the classic hallmark of a bullish trend.
Each time price touches the lower boundary (support trendline), buyers step in strongly, creating fresh impulsive waves upward.
The slope of the channel is consistent, confirming that bullish momentum is steady, not parabolic.
---
📊 Key Technical Levels
Current Price: 99.45 – 99.50
Upper Channel Resistance: Around 99.90–100.10 zone
Midline Area: Approximately 98.90–99.00 (often acts as short-term support/resistance)
Lower Channel Support: Around 97.50–98.00
---
🧭 Market Behavior
1. Momentum:
Price has recently broken above the last minor consolidation range and is now heading toward the upper boundary of the channel. This confirms a fresh bullish impulse leg.
2. Buyer Control:
The last few candles show strong bullish bodies with minimal wicks — indicating that buyers are dominating with little resistance so far.
3. Trend Continuation Bias:
The structure suggests continuation toward the upper trendline before any major correction occurs.
---
⚠️ What to Watch Next
Scenario 1 – Continuation:
If price maintains above 99.30–99.40, it could continue climbing toward the upper channel around 99.90–100.00.
→ That’s your short-term bullish target.
Scenario 2 – Pullback:
If there’s a rejection near the upper boundary (especially with long upper wicks or bearish engulfing), expect a retracement toward the midline (≈99.00) or even lower channel (≈98.00) for the next accumulation phase.
---
📈 Trading Insights
Buyers’ Edge: Buy retracements near the lower or midline of the channel as long as structure holds.
Profit Zones: Scale out or take profit near upper channel touches (~99.90–100).
Invalidation: A decisive break below 97.50 would invalidate the bullish channel and suggest a structural shift.
---
🔍 Institutional Context
Given DXY’s rise, this movement typically implies:
EURUSD and GBPUSD may face downward pressure.
Gold (XAU/USD) and Silver (XAG/USD) may pull back due to inverse correlation.

Dxy Clear Trade - Patience is a keyEverything is on the chart
Head and shoulder when we flip the chart
Goodluck

Bullish dollar!Trading at the bottom of the range, if holds we looking hella bullish for DXY holders, if back test fails here still hope depending how that follow through reacts, more info still needed but looking promising

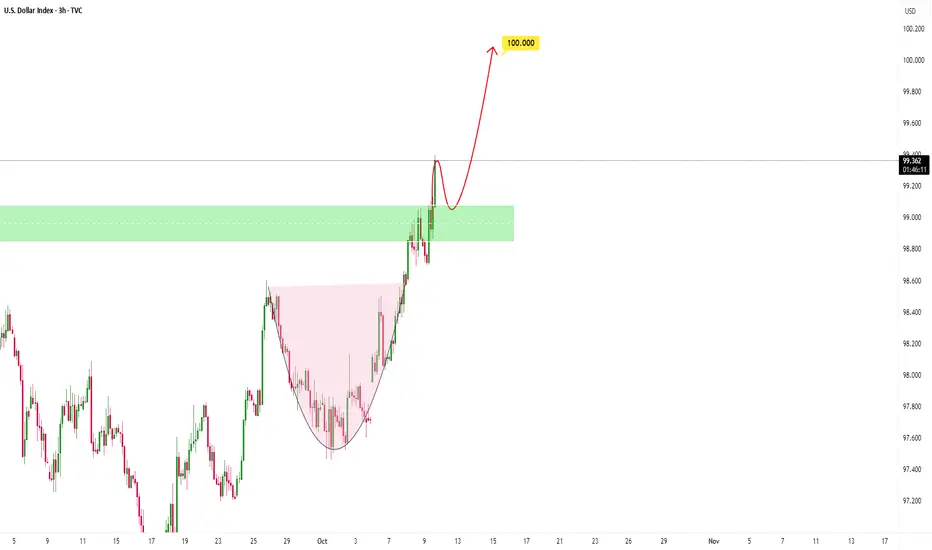
DXY could continue higherPrice has been in a bullish phase, forming a continuation setup showing buyers steadily gaining control after consolidation. The rounded base reflects accumulation, where buyers absorbed selling pressure and built momentum for a breakout.
If buyers manage to hold above the breakout zone, that would confirm continuation, with the next target projected toward the 100.
If sellers step in and drive price back below the breakout level, it could signal a false breakout and a short-term pullback before any renewed push higher.
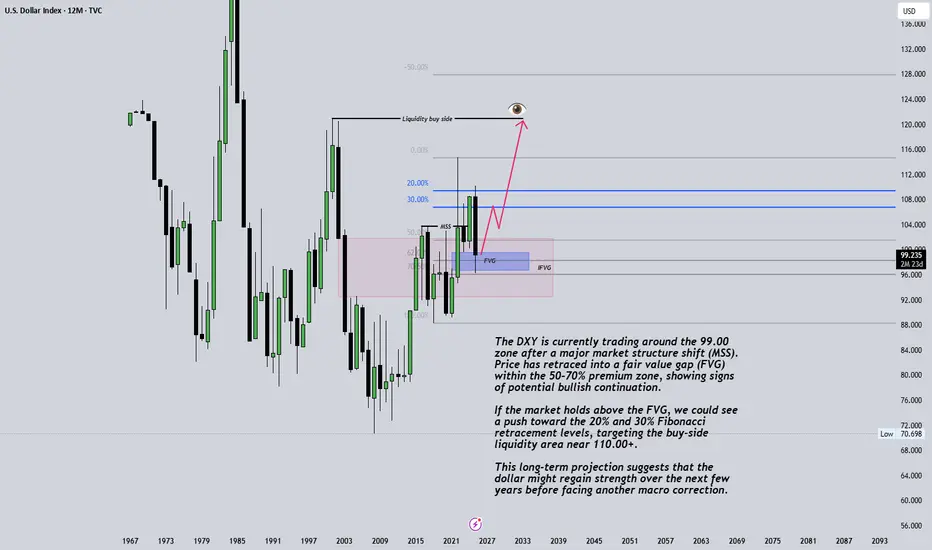
US Dollar Index (DXY) Monthly OutlookThe DXY is currently trading around the 99.00 zone after a major market structure shift (MSS). Price has retraced into a fair value gap (FVG) within the 50–70% premium zone, showing signs of potential bullish continuation.
If the market holds above the FVG, we could see a push toward the 20% and 30% Fibonacci retracement levels, targeting the buy-side liquidity area near 110.00+.
This long-term projection suggests that the dollar might regain strength over the next few years before facing another macro correction.
📅 Timeframe: Monthly
💡 Bias: Bullish towards liquidity highs
⚠️ Disclaimer: This analysis is for educational purposes only and does not constitute financial advice.
#DXY #USDX #DollarIndex #ForexAnalysis #SmartMoneyConcepts #MarketStructure #FVG #Liquidity #Herotraderfx #TradingView
DXY 4H – Possible Head & Shoulders Breakdown (My Bias)I’m watching DXY form a clean Head & Shoulders on the 4H chart. The neckline sits around 99.0 — if price breaks and retests, I expect a move toward 97.5 and possibly 96.0. My invalidation is above 100.2, near the right shoulder. Momentum seems to be fading, hinting at short-term weakness. I’ll wait for confirmation before acting.
⚠️ This isn’t a signal — just my personal bias and thought process on DXY.

DXYClose your long positions once it hits the red liquidity line and look for a selling opportunity after it enters in to the green supply zone.

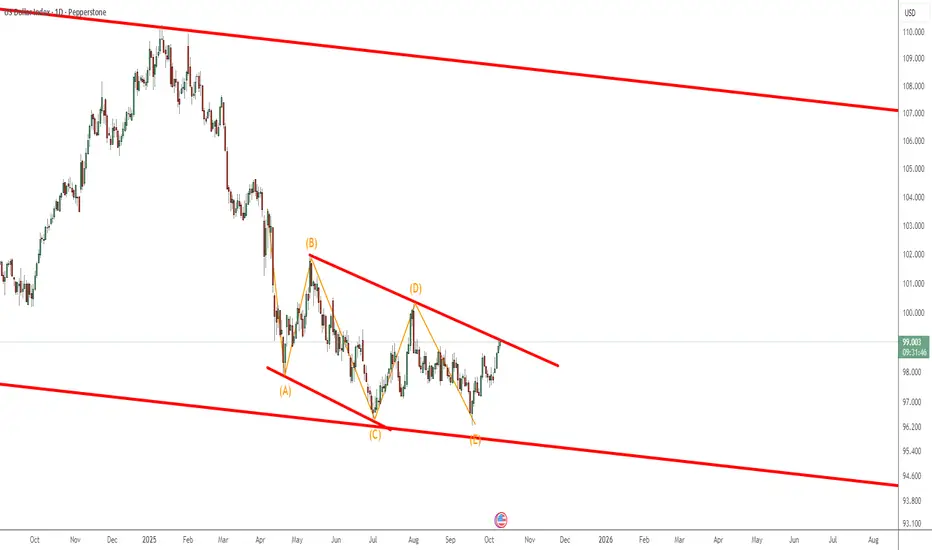
US Dollar Index (DXY) – Ending Diagonal Signals a Major Bullish The DXY is currently testing the upper boundary of a well-defined ending diagonal pattern on the daily timeframe — a structure that often appears at the end of a corrective phase, signaling the beginning of a new impulsive move.
After months of consolidation inside the narrowing wedge, momentum is now turning upward, suggesting a potential bullish breakout is underway. This diagonal likely marks the final wave of a corrective decline (Wave 5 of C) — meaning a larger bullish cycle could be ready to unfold.
Key Technical Notes:
🔹 Price is challenging the upper diagonal resistance near 99.00–99.40.
🔹 A confirmed daily close above this zone would invalidate the bearish wedge and trigger a trend reversal signal.
🔹 Next upside targets: 101.00, 103.50, and potentially 107.00 in extension.
🔹 Pullbacks toward 97.50–98.00 may offer buy-the-dip opportunities within the breakout structure.
Wave Context:
This move could represent the early stages of a new impulse (Wave 1 or Wave A) following the completion of an ending diagonal — a classic reversal signal in Elliott Wave theory.
Momentum Outlook:
Bullish divergence and a tightening structure suggest sellers are exhausted. A confirmed breakout would likely ignite short covering and renewed USD strength across the board.
Bias: ✅ Bullish / Long-biased — watching for breakout confirmation above 99.40.
Dollar Index (DXY) Rises to Highest Level in Over Two MonthsDollar Index (DXY) Rises to Highest Level in Over Two Months
The chart shows the Dollar Index (DXY) trading above the 99-point level today — its highest since early August. The dollar’s strength is supported by the weakening of other currencies:
→ The yen is weakening amid expectations of looser monetary policy. Conservative Sanae Takaichi could become the first female prime minister in Japan’s history, pursuing substantial spending and economic stimulus.
→ The euro remains under pressure amid France’s political crisis. Following the resignation of Prime Minister Sébastien Lecornu’s government, President Emmanuel Macron stated he plans to appoint a new prime minister this week.
Will the Dollar Index continue to rise?
Technical Analysis of the DXY Chart
On 19 September, we provided a significant analysis of the DXY chart in which we:
→ Confirmed the relevance of a descending channel (shown in red), which includes intermediate QL and QH lines dividing the channel into quarters.
→ Highlighted a reversal upward from the QL line (shown with an arrow).
→ Suggested a bullish scenario aiming to reach the QH line.
This scenario has indeed unfolded:
→ On 25 September and 6 October (as shown by arrows), the QH line acted as resistance.
→ On 7 October, it was broken upward, underlining bulls’ strength.
Given this, it is reasonable to suggest that bulls remain in control, while:
→ DXY fluctuations since mid-September’s low are forming an upward channel;
→ its upper boundary may act as resistance, potentially triggering a pullback towards the Support line;
→ the upper boundary of the red channel appears to be a key target for the current rally that began last month.
This article represents the opinion of the Companies operating under the FXOpen brand only. It is not to be construed as an offer, solicitation, or recommendation with respect to products and services provided by the Companies operating under the FXOpen brand, nor is it to be considered financial advice.
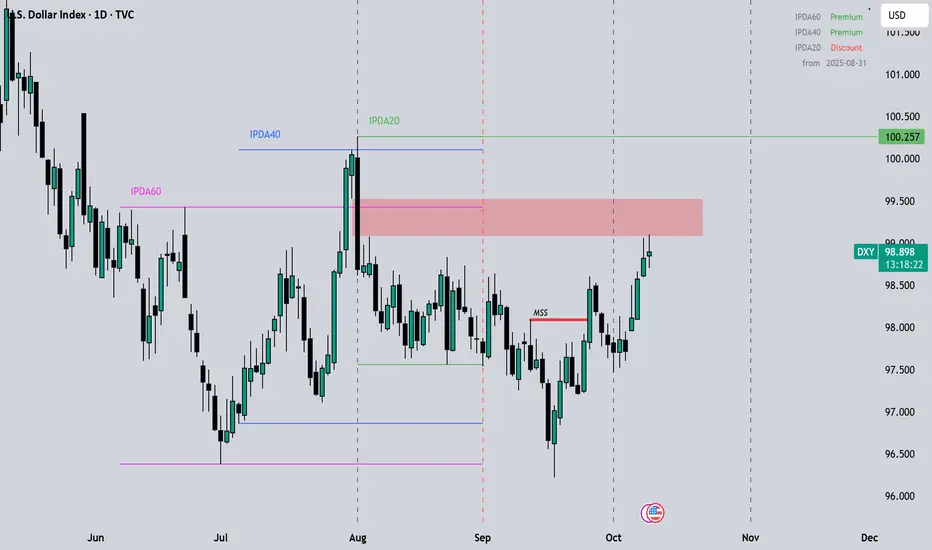
Dollar Index HTF BiasBased on the most recent Market Structure Shift, Quarterly Shift, using ICTs' IPDA 20-40-60 Lookback and Cast Forward.
I am expecting a DXY reaching 100.257 within this month, with a Daily SIBI getting ran through quite easily.
Some Quick Setups for the DayJust some ideas and things to consider this week with certain instruments mentioned in this video.
Have questions? Feel free to drop me a DM
Trade Safe!

Dollar TVC:DXY
DXY Technical Outlook
The U.S. Dollar Index has successfully broken out of the long-term descending trendline and is showing strong bullish momentum.
Trend: Turning Bullish

09.10.25 Morning ForecastPairs on Watch -
FX:EURCAD
FX:USDJPY
A short overview of the instruments I am looking at for today, multi-timeframe analysis down to what I will be looking at for an entry. Enjoy!

BULLISH RUNwe are looking at a bullish run in the market, this run will be fueling up the drop in price of Gold as the DXY GAINS strength on Daily TF, this will allow us to go to LTF's and look for entry opportunities.

DXY & XAUUSDThe U.S. Dollar Index (DXY) is moving within a long-term upward channel but has entered a downward trend since the beginning of 2025, while gold (XAU/USD) has surged sharply (from around the $2,600 level).
Apart from the large-scale gold purchases by the People’s Bank of China on **July 17, 2015**, which increased its reserves to about **1,658 tons**—roughly **600 tons more** than the previously reported figure in 2009—it seems to me that the bullish trend in gold might (at least temporarily, for a few weeks) pause **only when the U.S. Dollar Index breaks above its short-term downward trendline**.
However, for the U.S. dollar to fully reverse its current downtrend, it would need to break above the **100.3 and 102** levels.

DXY Implusive Bullish Trend - Longter OutlookThe U.S. Dollar Index (DXY) appears to have completed a major A–B–C corrective supercycle that started in the mid-1980s, with wave C bottoming around 2008. Since then, the index has been forming a new impulsive structure (1–5) within a long-term ascending channel.
Currently, DXY seems to be developing wave (E) of sub-wave iii, which could mark a short-term top before entering a corrective wave iv phase near the 103–108 region. Once that correction completes, the next bullish leg — wave v — is projected to extend toward the 130–165 zone, signaling the potential start of a new bullish supercycle for the USD.
The parallel channel structure and long-term EMA support reinforce this view that recent weakness is corrective rather than a trend reversal, keeping the long-term outlook firmly impulsively bullish for the dollar.
