DXY is in SIDEWAYS consolidation phase in near future📈 DXY – Long-Term Elliott Wave Analysis (Monthly) –
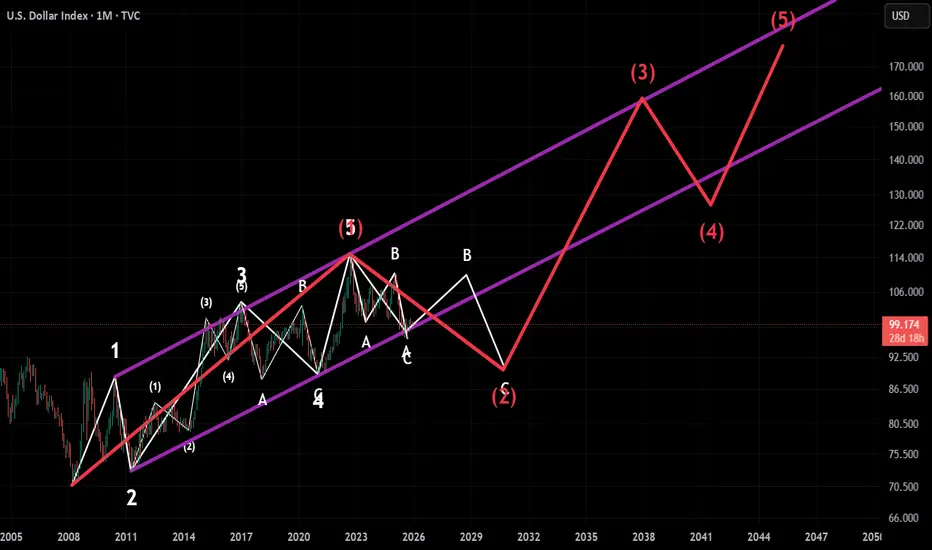
The US Dollar Index continues to follow a clear multi-decade Elliott Wave structure inside a rising purple channel, and the long-term configuration strongly suggests that a major Cycle Wave (1–5) impulse has already completed. The advance began with Wave (1) rising sharply off the long-term base, followed by a deep Wave (2) correction back to channel support. From there, the index entered its strongest bullish phase, producing a powerful Wave (3) rally that pushed price into the upper boundary of the long-term channel. After this expansion, the Dollar consolidated through Wave (4), a prolonged sideways/down correction that held the channel midline, before finally completing the sequence with Wave (5), which tagged the upper channel once more and confirmed a multi-decade cycle top.
Following this Cycle Wave (5) top, DXY transitioned into a large A–B–C corrective structure, forming Cycle Wave (2). The first leg, Wave A, broke the uptrend decisively. The subsequent Wave B rally was corrective and choppy, failing to retest the highs and respecting the underside of the channel midline. The ongoing decline represents Wave C, which structurally aligns with a classic deep retracement. Confluence from the long-term channel, structural levels, and Fibonacci projections places the ideal Wave C low inside the 88–92 zone, highlighted as the red box on the chart. This region corresponds with the 0.5–0.618 retracement of the entire Wave (1–5) advance, making it the most logical area for Cycle Wave (2) to complete.
Momentum also supports a continued corrective bias in the near term. The monthly RSI sits around 44–47, historically consistent with mid-correction conditions rather than a completed low. Previous major cycle bottoms formed closer to RSI 30–35, hinting that further downside pressure may still be required before a durable reversal emerges. Key horizontal levels add confluence: 92.00 serves as the first structural support, while the 88–90 zone marks the primary inflection point for the end of Wave C. Strong resistance overhead rests at 105, followed by 120–122 at the channel midline.
Once Wave C completes and Cycle Wave (2) bottoms, the structure supports the beginning of a massive Cycle Wave (3) advance. This next impulsive sequence has long-term targets at 110–115 initially, then 125–130 as the mid-cycle rally develops, followed by a potential retest of the 135–140 range at the upper channel. The final Cycle Wave (5) of the future structure projects toward 150–155, aligning with the extended upper channel shown on the chart. This represents the super-cycle bullish scenario for the Dollar.
An alternative, lower-probability scenario suggests that Wave B may not have fully completed, allowing additional sideways action before Wave C resumes downward. However, only a sustained break below the long-term lower channel boundary (around 80–82) would invalidate the bullish super-cycle outlook. Until then, the primary expectation remains that DXY is approaching the final stage of its Wave C decline, after which a multi-year uptrend should begin.
Overall, the next 1–3 months appear biased toward downside continuation into the 88–92 support zone to finalize Cycle Wave (2). The subsequent 3–6 months favor the emergence of a strong bullish reversal that begins the early stages of Cycle Wave (3). The long-term chart remains structurally bullish, and once the corrective C-wave completes, the Dollar is positioned for a powerful multi-year advance.
Trade ideas
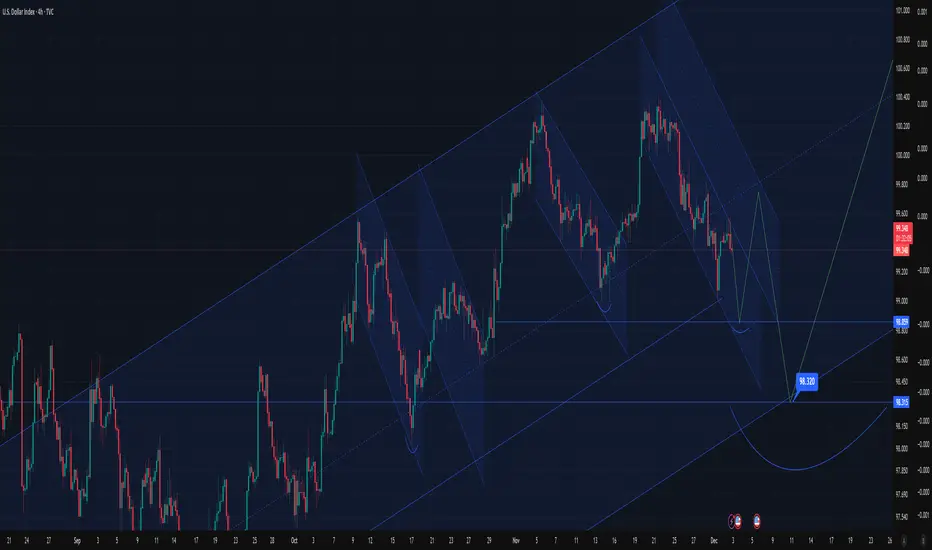
US Dollar: Bearish! Look To Sell it towards 98.56!Welcome back to the Weekly Forex Forecast for the week of Dec 8-15th.
In this video, we will analyze the following FX market: USD Dollar
The USD is currently bearish, sitting in a Daily -FVG. If the FVG holds, the sell off will continue from last week. Should the -FVG fail, then hold off on sells! A close above the -FVG will be a bullish indication.
Wed's FOMC will likely weaken the currency further, as institutions have seemingly baked in their bearish bets.
Enjoy!
May profits be upon you.
Leave any questions or comments in the comment section.
I appreciate any feedback from my viewers!
Disclaimer:
I do not provide personal investment advice and I am not a qualified licensed investment advisor.
All information found here, including any ideas, opinions, views, predictions, forecasts, commentaries, suggestions, expressed or implied herein, are for informational, entertainment or educational purposes only and should not be construed as personal investment advice. While the information provided is believed to be accurate, it may include errors or inaccuracies.
I will not and cannot be held liable for any actions you take as a result of anything you read here.
Conduct your own due diligence, or consult a licensed financial advisor or broker before making any and all investment decisions. Any investments, trades, speculations, or decisions made on the basis of any information found on this channel, expressed or implied herein, are committed at your own risk, financial or otherwise.

DXYU.S Dollar Index
- Buy Side Liquidity
- Break of Structure
- Completed " 12345 " Impulsive Waves
- Change of Characteristics
- RSI - Divergence

DXY bottomed and is starting the new Bullish Leg.The U.S. Dollar index (DXY) has been trading within a Channel Up since the October 01 Low last week even broke above its 1D MA200 (orange trend-line) for the first time since March 05 2025.
Technically, that is confirmation for the long-term continuation of the uptrend. As long as the 1D MA50 (blue trend-line) holds, we expect DXY to start the new Bullish Leg of the Channel Up as yesterday it hits its bottom.
There is a high symmetry between the last three Bullish Legs but since the 'weakest' one has been +2.17%, we have a Target at 101.100. As you can see, that would even test the 1W MA50 (red trend-line), which is the natural long-term Resistance of the market.
Notice also the 1D RSI bounce on its 2-month Support Zone as well as the just formed Bullish Cross on the 4H MACD. All perfectly aligned with bottom formations signaling buy opportunities.
---
** Please LIKE 👍, FOLLOW ✅, SHARE 🙌 and COMMENT ✍ if you enjoy this idea! Also share your ideas and charts in the comments section below! This is best way to keep it relevant, support us, keep the content here free and allow the idea to reach as many people as possible. **
---
💸💸💸💸💸💸
👇 👇 👇 👇 👇 👇

Road Map of DYX My main Idea for the DYX is the range from 98-102 approximately .when riches 102-102.5 it has potential to Crash Under 90 ! I think its really Big crash like 2008! I think Its gonna happen. this time for crypto Markets to Go Higher and Higher and Strong Bullish Candles .
US Dollar: Wait For The Breakout!Welcome back to the Weekly Forex Forecast for the week of Dec 1 - 5th.
In this video, we will analyze the following FX market: USD Dollar
The USD is bearish-neutral. It had a bearish close to last week, but did not close below the low of the previous week. This could indicate more consolidation coming.
Wait for price to trade above or below Friday's candle, and let that be your guide for the week.
Enjoy!
May profits be upon you.
Leave any questions or comments in the comment section.
I appreciate any feedback from my viewers!
Disclaimer:
I do not provide personal investment advice and I am not a qualified licensed investment advisor.
All information found here, including any ideas, opinions, views, predictions, forecasts, commentaries, suggestions, expressed or implied herein, are for informational, entertainment or educational purposes only and should not be construed as personal investment advice. While the information provided is believed to be accurate, it may include errors or inaccuracies.
I will not and cannot be held liable for any actions you take as a result of anything you read here.
Conduct your own due diligence, or consult a licensed financial advisor or broker before making any and all investment decisions. Any investments, trades, speculations, or decisions made on the basis of any information found on this channel, expressed or implied herein, are committed at your own risk, financial or otherwise.

Bearish drop off?US Dollar index (DXY) has rejected off the pivot and could drop to the 1st support.
Pivot: 99.54
1st Support: 98.62
1st Resistance: 100.28
Disclaimer:
The opinions given above constitute general market commentary and do not constitute the opinion or advice of IC Markets or any form of personal or investment advice.
Any opinions, news, research, analyses, prices, other information, or links to third-party sites contained on this website are provided on an "as-is" basis, are intended to be informative only, and are not advice, a recommendation, research, a record of our trading prices, an offer of, or solicitation for, a transaction in any financial instrument and thus should not be treated as such. The information provided does not involve any specific investment objectives, financial situation, or needs of any specific person who may receive it. Please be aware that past performance is not a reliable indicator of future performance and/or results. Past performance or forward-looking scenarios based upon the reasonable beliefs of the third-party provider are not a guarantee of future performance. Actual results may differ materially from those anticipated in forward-looking or past performance statements. IC Markets makes no representation or warranty and assumes no liability as to the accuracy or completeness of the information provided, nor any loss arising from any investment based on a recommendation, forecast, or any information supplied by any third party.

Dollar Index Bearish Setup: Dead Cat Bounce Then Collapse. The weekly chart shows a strong bearish signal, with a bearish engulfing candle forming and a confirmed double top structure on the daily chart. Price has already broken below the neckline of this double top, indicating weakening bullish momentum.
Currently, price is consolidating just below the 50 EMA. With RSI deeply in oversold territory and stochastic oscillators near cycle lows, a short-term relief bounce is likely. This bounce could push price toward the 99.032 level, just below the 21 EMA, which now acts as a key resistance zone.
On the daily timeframe, the 9 EMA has crossed below the 21 EMA, reinforcing a bearish trend and suggesting that upward moves will face strong resistance. More importantly, the weekly stochastics have already crossed down, and the weekly MACD is showing clear signs of momentum loss.
In conclusion, after a potential short-term bounce to fill the gap on the 4-hour chart—where a death cross is also forming—the broader expectation is for a significant bearish continuation in the Dollar Index.
As always, I thank you for supporting my publications with a boost and sharing your own thoughts in the comment section. I wish you the best trading in the coming week. Cheers!

DXY FRGNT Forecast - Q4 | W50 | Y25 |📅 Q4 | W50 | Y25 |
📊 DXY FRGNT Forecast
🔍 Analysis Approach:
I’m applying Smart Money Concepts, focusing on:
Identifying Points of Interest on the Higher Time Frames (HTFs) 🕰️
Using those POIs to define a clear trading range 📐
Refining those zones on Lower Time Frames (LTFs) 🔎
Waiting for a Break of Structure (BoS) for confirmation ✅
This method allows me to stay precise, disciplined, and aligned with the market narrative, rather than chasing price.
💡 My Motto:
"Capital management, discipline, and consistency in your trading edge."
A positive risk-to-reward ratio, paired with a high win rate, is the backbone of any solid trading plan 📈🔐
⚠️ Losses?
They’re part of the mathematical game of trading 🎲
They don’t define you — they’re necessary, they happen, and we move forward 📊➡️
🙏 I appreciate you taking the time to review my Daily Forecast.
Stay sharp, stay consistent, and protect your capital
— FRNGT 🚀
TVC:DXY

DXY 4h BUYWhat Is Occurring RIGHT NOW
👉 The chart is showing an LPS retest inside a bullish re-accumulation before continuation upward.
The clean correction toward 98.50 → 98.00 is exactly where institutions re-load positions before major expansion.
4. Analysis of the Last 5 Candles (Very Important)
Candle −1 (latest candle)
Small body, long lower wick → buyers absorbing sell-pressure at the retest region.
Candle −2
Bearish but with lower wick → selling attempts rejected.
Candle −3
Bearish engulfing type but on reduced volume, confirming correction not reversal.
Candle −4
Doji structure → market indecision as price meets first demand pocket.
Candle −5
Strong bearish push but again with a lower wick → supply weakening as price approaches demand.
Summary:
The last 5 candles show progressive loss of selling momentum, confirming the scenario of an LPS.
5. Expected Path (According to Chart Structure Only)
Primary scenario shown on your chart:
Pullback into 98.20–98.60 demand →
Expansion toward 102.00 → 104.20
Ultimately reaching the green target box.
The upward projection shown on your chart aligns perfectly with Wyckoff Phase E mark-up.
🔥 Final Conclusion
The chart is currently in Wyckoff Phase E (early Mark-Up), performing an LPS retest after a completed accumulation range.
Price is preparing for upward continuation following the corrective pullbac

USD Dollar FOMC IdeaBias until Dec FOMC:
We will be looking to continue to ride the Fed rate cuts odds increased on the markets as that is still holding most weight at the moment and will most likely continue to do so until the FOMC decision on 11 December.
The markets have been primarily pricing in the rate cut expectations 30 days well before the actual FOMC decision, there during the actual Rate decision release, we barely get any impact and we get markets repositioning for any future guidance to come. Basically a case of ‘Buy the rumour and Sell the news’’ play.
- Because at the moment, we have been seeing rate cut probabilities increasing to 85% which has been holding most weight for Gold upside and giving the greedy intuitions a reason to further buy up risk assets.
However,
- This doesn't mean that Dec is a guaranteed rate cut, and during the December FOMC, the fed may either cut rates by 25bps or Hold rates, and if there future guidance remarks are hawkish since inflation is still elevated - then we can see Profit taking on risk assets. Therefor expect to see Gold bears, DXY bulls, BTC Bears, Stock bears.
So until the actual December FOMC, If December Rate cut probabilities are still elevated (80%+), then, we can still expect Buyers in control on Risk assets, so:
- DXY - Downside.
- GOLD - Upside , potentially retest upto previous ATH’s $4380’s. Then Profit taking post FOMC.
- US Stocks - Upside on SPX to make New ATH’s and bearish wave if Dec FOMC hawkish.
- BTC - Upside to 100k, prev supply zone before Correction bearish phase.

GU ASIA SC Market moved 30 pips in ASIA, DXY is reversing around 99.00 line, 15 pips TP could be gained before market start hyping in LDN

Usdx . Dollar index Dollar index will invite us to his impulive party
Price will retrace to levels 98 . 97.485
Targeting 103 -104
Dont miss the party !
Party invalidation : daily close below 96.5 or below lowest low formed in recent downward trend .

NOV.30,2025 ANALYSIS ON THE DOLLAR INDEX (DXY)DXY is at crossroads with a monthly indecision Candlestick. Glass ceiling tops of 99.978 is still hanging, However the week still closed with a higher low defended on the 200EMA on the 4H timeframe with a bullish kicker reversal two candle pattern. Considering the weekly candle close, there is real risks to the downside, My 21 period RSI is below 50 on 4H confirms real downside risk too . My bias on the dollar index is still to the upside but however if you trade the long side apply tight stop loss using the 200EMA on 4H or the 35EMA on daily chart as the decision yard. If price loses these EMAs then short side is confirmed for 97.148 target. There is also a hidden bullish divergence on the daily and weekly chart so upside potential is equally weighted to the downside double tops target. Therefore prepared for both scenarios this coming week.
Thank you for supporting my publications with your boosts and comments. Best of forex trading everybody. Cheers

DXY consolidation after DXY sold out need retracement to take 99.50 then selloff. This uld happen Thursday into Friday close...seeing Sunday Sell againg....holdding buys on EURUSD and GBPUSD


Dollar index The market (dollar index) will be bearish after a jump and a fake-out. Fake out line specified!

EURUSD long setupEURUSD sitting on a London session low zone and in a P-Line zone along with the RSI showing oversold conditions, conversely DXY is at a the London session high and also the RSI showing overbought. Going for a 1:2 RR trade.

U.S. Dollar Index Gearing Up for a Powerful Upswing!💵 DXY — U.S. Dollar Index | Profit Pathway Setup (Swing Trade)
🧭 Bias: Bullish (Confirmed Setup)
📈 Market Type: Index (USD Strength Focus)
🧠 Strategy Style: Layered Limit Entry with SMA Pullback + Triangular MA Breakout
🎯 Trade Plan Breakdown
📊 Setup Insight:
The DXY (U.S. Dollar Index) has confirmed a bullish momentum as price reclaims above the Simple Moving Average (SMA) and breaks through the Triangular Moving Average (TMA) resistance zone — signaling potential continuation strength for the dollar.
📥 Entry Zone (Layering Strategy):
My “Thief Strategy” approach uses multiple limit layers for precision stacking entries:
Buy Limit Layers: 99.00 → 99.50 → 100.00
(You can extend or adjust layers based on your own conviction and risk appetite.)
🛑 Stop Loss:
My Thief SL sits near the recent lower low wick for structure protection → 98.50
💬 Note: Dear Ladies & Gentlemen (Thief OG’s) — I’m not recommending my exact SL.
You manage your own risk — make money, take money, your call.
🎯 Target (Take Profit):
The moving average line is acting like a police barricade — strong resistance area, potential overbought trap zone. Be smart and escape with profits near 102.00.
💬 Note: Dear Ladies & Gentlemen (Thief OG’s) — TP is flexible.
Lock profits where you’re satisfied; don’t let greed arrest your gains. 🚓💰
🌐 Correlated Market Watch
Keep an eye on these correlated pairs & assets for confirmation signals or divergence clues:
💶 $EUR/USD → Inverse correlation (DXY up → EUR/USD down)
$XAU/USD (Gold) → Often moves opposite to USD strength
💷 FX:GBPUSD → Mirrors EUR/USD volatility when DXY surges
BITSTAMP:BTCUSD → Weakens when DXY strengthens due to liquidity shifts
💹 FX:USDJPY → Supports bullish dollar narrative if yield spreads widen
These pairs can help you validate sentiment and timing entries better — especially during London & New York sessions when DXY liquidity peaks.
🧩 Technical Key Points
✅ SMA pullback confirms bullish continuation zone
🔺 Triangular Moving Average breakout shows renewed strength
🧱 99.00–100.00 acts as accumulation floor
🚨 102.00 remains resistance barricade zone (potential trap)
⏰ Best observed during London/NY overlap for volatility cues
✨ “If you find value in my analysis, a 👍 and 🚀 boost is much appreciated — it helps me share more setups with the community!”
⚠️ Disclaimer: This is a Thief-style trading strategy — just for fun and education. Not financial advice. Trade wisely and manage risk like a pro.
#DXY #USDollarIndex #ForexTrading #SwingTrade #TechnicalAnalysis #TradingIdeas #PriceAction #SMAStrategy #MovingAverages #CurrencyTrading #DollarStrength #ForexSignals #TradingStrategy #MarketAnalysis #ChartPatterns #BullishSetup #RiskManagement #ForexCommunity #TradingView #DXYAnalysis

The DXY has room to reboundThe DXY has room to rebound from the 98.848 level after the decline in new unemployment claims.
A stronger labor reading signals fewer layoffs and a resilient U.S. economy, reducing the likelihood of near-term Fed rate cuts.
Sticky rate expectations and stronger yield support typically lift the dollar, giving the DXY a bullish bias from current levels.

The Dollar Isn’t Falling. It’s Being Repriced.The dollar didn’t weaken because of a single headline.
It weakened because two forces aligned at the same moment—policy certainty and political uncertainty.
Futures now price a full December rate cut.
That removes the dollar’s yield premium and lifts liquidity expectations.
But the bigger shift is political.
Odds have increased that Kevin Hassett could replace Jerome Powell as Fed Chair.
Markets understand the implication: potential pressure on Fed independence.
Currencies respond quickly to credibility risk.
EURUSD strengthened.
Gold firmed.
Bitcoin stabilized despite its bearish structure.
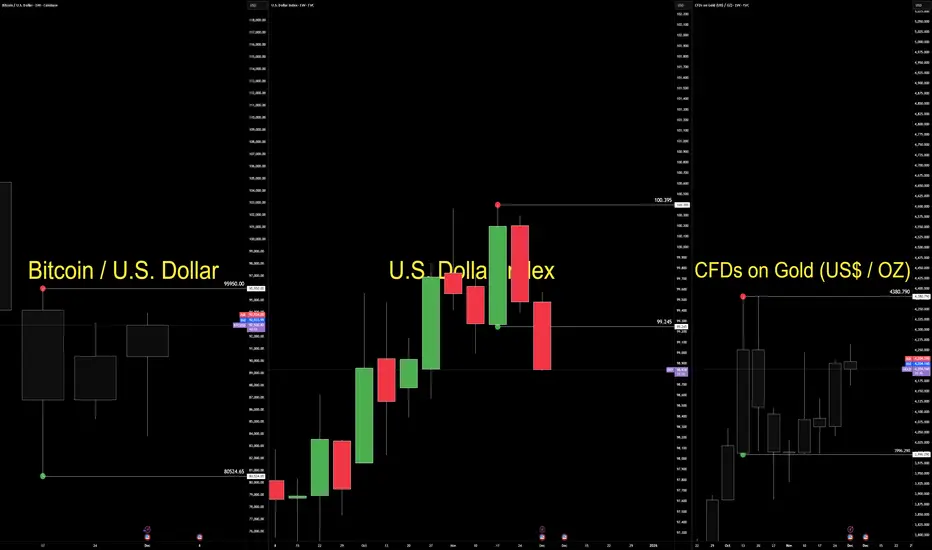
Now the technical side.
The dollar still trades inside a bullish consolidation between 99.245 and 100.395.
Structure is intact, but behaviour has shifted under the surface.
Pressure is building inside the box.
Gold holds a weekly bullish consolidation above 3996.290.
Price is absorbing quietly—typical when investors hedge independence risk.
Bitcoin remains in a weekly bearish consolidation between 95,950 and 80,524.
A rare decoupling from the debasement narrative.
The macro story supports upside, but structure has not yet released.
This environment demands a behaviour-first lens.
Market Structure maps the containment.
Geometry shows the compression.
Volume Flow reveals participation rotation.
Order Flow exposes intent before trend.
Execution depends on pressure validation, not prediction.
Today is not a trend shift.
It is a credibility repricing.
The dollar hasn’t lost structure.
It has lost premium—while gold and crypto absorb the early rotation of capital into assets less dependent on institutional stability.
When policy becomes predictable and leadership becomes political, markets adjust before headlines explain why.
— CORE5DAN
Institutional Logic. Modern Technology. Real Freedom.
CORE5 WEEKLY WARMAP — 1 DECEMBER 2025The market opens the week with the dollar locked inside a well-defined range between 97.67 and 99.98. Price is sitting near the mid-zone around 98.60, showing no structural breakout. Until one of these levels is taken out with conviction, this is a rotation environment, not a trend environment.
Yields continue to firm. The 10-year is up about 1.63 percent and the 2-year roughly 1.66 percent. Higher yields paired with a rangebound dollar create a more selective backdrop for risk assets. ES holds strength inside its upper band, but rising volatility signals a shift toward more two-way movement. Gold liquidated last week’s high and remains in a two-month bullish range. Across the six-chart grid, the underlying message is the same: strength on the surface, tension underneath.
The calendar is dense. ISM Manufacturing, ADP employment, ISM Services, trade balance, consumer credit, Michigan sentiment, and the full employment situation report arrive in a tight cluster. Each print feeds directly into expectations for the Fed’s December path.
Through the CORE5 lens, the dollar’s range defines the entire week. Market Structure confirms a rotation box. Dynamic Geometry shows price in discount, favoring fast intraday swings rather than smooth trends. Volume Flow flipped bearish last week after failing the bullish daily range, turning prior volume shelves into supply. Order Flow across FX pairs remains bullish, removing justification for blind shorting of risk assets. Execution must stay high-frequency, level-to-level, and based on clear confirmation.
The weekly thesis is direct: markets are being driven by firm yields and a heavy sequence of U.S. data. This is a reaction-driven week, not a predictive one. Intraday rotations offer more clarity than directional conviction.
The takeaway: the dollar remains inside its box, yields are firm, and volatility is rising. Treat every level as a behavior test. Trade the rotations, not your opinions.
— CORE5DAN
Institutional Logic. Modern Technology. Real Freedom.

DXY 7mo rounding bottom -- more gains likelyEarly 2025 saw a nasty TVC:DXY drawdown; one of the worst starts for the Dollar against foreign currencies in decades.
Despite bearish calls for the Dollar to drop significantly further it's been consolidating at the bottom of a long standing 19 year upward trend channel.
On the daily chart featured above, there's now a clear rounding bottom on TVC:DXY over the past 7+ months, with a clear, sharp uptrend in momentum right along the way.
The risk is to the upside imo.
