DXY MAX BUTTERFLYThe pattern is as title says a max butterfly. The xd ratio should be between 1.272 and 1.618. Risky short taken, maybe some relief on the shitcoins. 97.5 is obvious target.
Trade ideas


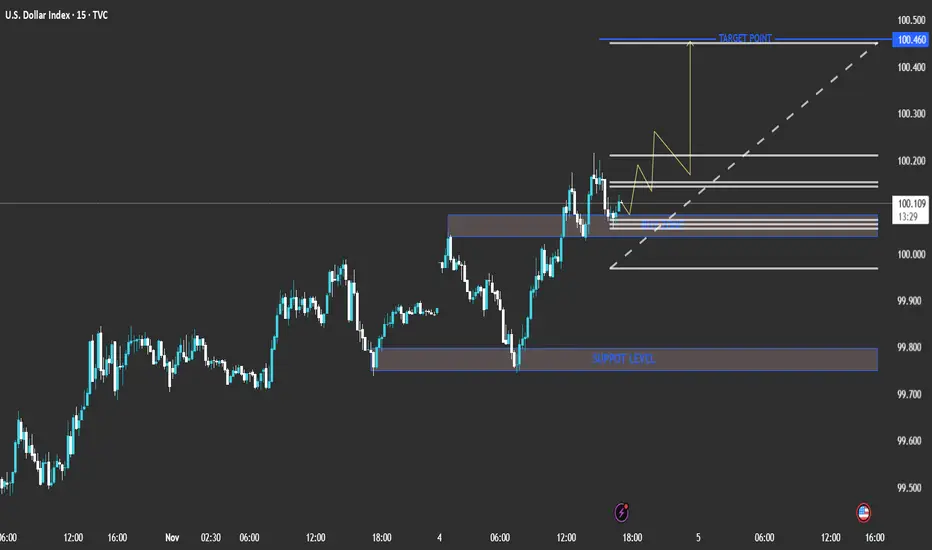
technical analysis of the chart you shared (U.S. Dollar Index Current Price: 100.112
Bias: Bullish short-term
Timeframe: 15-min
The chart shows a clear bullish structure with higher highs and higher lows forming. The price recently bounced from a minor support zone around the 100.00 level and is showing momentum to the upside.
📊 Key Levels
Support Level: 99.750 – 99.850 (major zone from previous lows)
Buy Zone: 100.000 – 100.050 (minor support/entry zone)
Target Point: 100.460
⚙️ Analysis Summary
Price has broken above short-term resistance and is now retesting the buy zone, suggesting a possible continuation higher.
The ascending trendline (dotted white line) supports this bullish bias.
The yellow zigzag projection indicates expected consolidation before a push upward.
🎯 Trading Plan (Based on Chart Setup)
Entry Zone: Around 100.000 – 100.050
Stop Loss: Below 99.900 (below structure support)
Take Profit: 100.460 (target zone)
Risk/Reward Ratio: Approximately 1:3
🔍 Conclusion
The chart suggests a short-term bullish scenario for DXY (U.S. Dollar Index). A successful bounce from the 100.00 zone could lead to a move toward the 100.46 target point. However, a break below 99.90 would invalidate the setup and shift bias to neutral or bearish. TVC:UKX FTSE:UKX FTSE:MCX FTSE:FBMKLCI FTSE:AIM1 FTSE:ASX FTSE:NMX FTSE:AW01 FTSE:JAPAN FTSE:GEISAC FTSE:FBM100 FTSE:AIM5 CBOEEU:BUK100P FTSE:XIN0 FTSE:AXX FTSE:XIN0U
US Dollar Index (DXY) – 4H Technical Analysis ( Update)US Dollar Index (DXY) – 4H Technical Analysis
Current Price: 99.77 (+0.28%)
Trend: Bullish continuation within a strong uptrend
Technical Overview
The DXY continues its bullish structure, forming a Break of Structure (BOS) above 99.60, confirming a continuation of upward momentum.
Price is trading above the 14 EMA (white) and 200 EMA (yellow), indicating strong bullish momentum and trend alignment.
The market recently tapped into a supply zone near 99.75 – 99.80, showing initial signs of short-term rejection, but the broader trend remains upward.
Key Levels
Immediate Resistance: 99.75 – 99.85 (current supply zone)
Next Resistance: 100.00 (psychological level)
Immediate Support: 99.35 (minor structure)
Major Support Zone: 98.70 – 98.30 (demand area with EMA confluence)
Indicators
Stochastic
RSI currently around 75, approaching the overbought zone, which could trigger a short-term pullback before continuation.
The momentum structure remains intact, and both moving averages are sloping upward — a bullish continuation bias remains valid unless 99.35 breaks down.
Market Context
A strong DXY typically pressures risk assets, including BTC and equities.
Combined with rising USDT Dominance, this reinforces a risk-off environment — investors are moving to safety (USD and stablecoins).
If DXY breaks above 99.80, expect further crypto weakness and possible BTC retest near 104,000 – 102,000.
Summary
Bias: Bullish
Short-Term Expectation: Minor pullback → continuation toward 100.00
Invalidation: A breakdown below 99.35 would signal a shift to neutral and potential mean reversion toward 98.70

Big Moves Ahead? DXY, EUR/USD & Gold at Crucial LevelsLadies and gentlemen, there was a time when forex was full of trading opportunities... to the point where most people struggled with overtrading. But these days, you need a solid watchlist to even find positions, and that's where Skeptic Lab comes in—it's a great spot for spotting good opportunities. So without further ado, let's dive into the analysis of DXY , or the dollar index.
💲 In the daily timeframe , after the drop it had, it's entered a consolidation box, and it looks like we're nearing the end of that box. The main long trigger is a break of 100.262 from a technical standpoint, but personally, after the break of 99.850, I'm already positioned on one of the USD symbols. In lower timeframes, plus the fact that breaking the ceiling of consolidations is usually not straightforward and comes with a lot of volatility, so it's better to have a pre-breakout position.
💶Let's head over to EURX in the 4H timeframe —we've had a good reaction at the 1085.9 support. Breaking it would be a great trigger if you want a EURUSD position.
Speaking of EURUSD , it's already entered a secondary bearish trend after breaking its daily trend line. If the DXY consolidation box breaks, EURUSD will officially change its HWC trend to bearish. The position I mentioned at the start of the analysis—I opened it with the break of that same daily EURUSD trend line. The key level for profit-taking will be 1.14640. I'll wait to see what reaction DXY gives—if it fakes the box break, I'll close the position; if not, I'll leave it open for now.
🪙But let's move on to gold —the commodity I'm eyeing today for opening a position. From a technical perspective, it's at a spot that gives both short and long triggers... let me explain.
In the daily timeframe, we had a strong uptrend rally that, after reaching 4377.67 , entered its secondary corrective trend. In the 4H timeframe, what's interesting is the formation of these range boxes we're seeing. So our long and short triggers are clear: break of the box ceiling = long / break of the box floor = short.
But the thing is, the targets are the same... see, opening a short here basically means going along with the secondary trend, so? Your expectations should be relative to this leg, not the weekly one... so it's better to take your targets quicker, like 3896.31 (the 0.38 fib intersection), which could be a good target. Plus, each bearish leg is weaker than the previous one, so the point I mentioned makes sense for the target.
For longs, though, you can proceed with partial profits and not close too early. Alright, that's it. Now get outta here.

DXY: Local Bearish Bias! Short!
My dear friends,
Today we will analyse DXY together☺️
The recent price action suggests a shift in mid-term momentum. A break below the current local range around 99.564 will confirm the new direction downwards with the target being the next key level of 99.427 and a reconvened placement of a stop-loss beyond the range.
❤️Sending you lots of Love and Hugs❤️

DXY bullish weekly run to resistance. DXY is hunting that 100+ line.
Could see some interesting volatility on data dumps this week.
Hunting for sub 1.14 on EU

DXY analysis
The DXY is currently trading below the neckline of both the cup-and-handle and head-and-shoulders patterns. It’s retesting the previously broken channel as support while attempting to reclaim the neckline. Despite this short-term effort, the broader macro structure remains bearish.

dxy 1h🔹 Overall Outlook and Potential Price Movements
In the charts above, we have outlined the overall outlook and possible price movement paths.
As shown, each analysis highlights a key support or resistance zone near the current market price. The market’s reaction to these zones — whether a breakout or rejection — will likely determine the next direction of the price toward the specified levels.
⚠️ Important Note:
The purpose of these trading perspectives is to identify key upcoming price levels and assess potential market reactions. The provided analyses are not trading signals in any way.
✅ Recommendation for Use:
To make effective use of these analyses, it is advised to manually draw the marked zones on your chart. Then, on the 5-minute time frame, monitor the candlestick behavior and look for valid entry triggers before making any trading decisions.


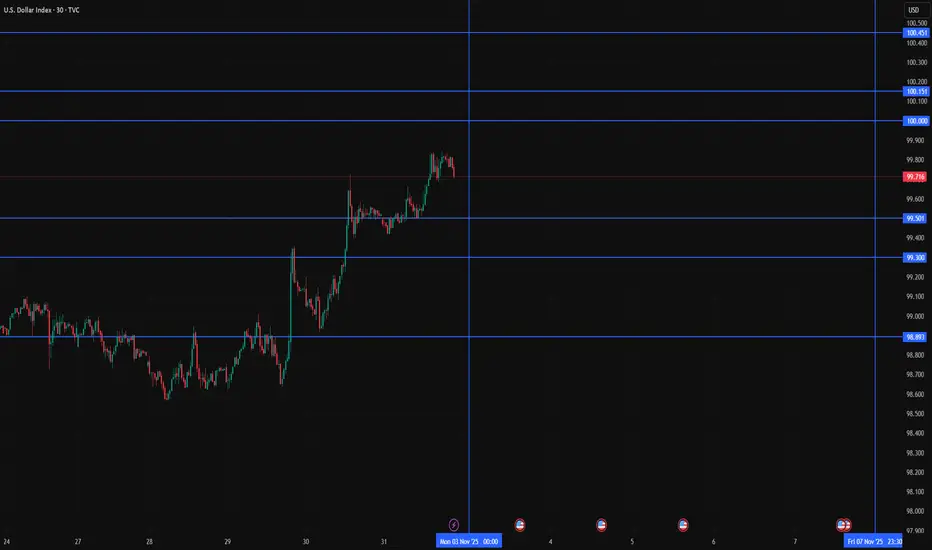
DXY Daily Map for 3 to 7 November 2025What this is
A clean, event aware plan for the Dollar Index for the week ahead. We start the week with DXY holding the ninety nine handle and sitting just below the round one hundred line. The location is the story. Round numbers compress behavior. If you pre mark the right shelves and then trade the reaction to data and auction tone, you can avoid most of the week’s traps while still catching the meaningful moves.
Chart setup
Use TVC:DXY on the daily and one hour. Keep the chart clean. Draw only the bands you will act on.
• 100.00 round number
• 100.15 to 100.45 first resistance band
• 100.50 to 101.00 second resistance band
• 99.50 to 99.30 first support shelf
• 98.90 to 98.60 second support shelf
• 98.20 daily defense line
Add a fifteen minute ATR for sizing. No other overlays. You do not need them.
Why this week matters
The heaviest flow sits midweek when private labor gauges, services surveys, and refunding headlines can all hit inside a tight window. On Thursday the Bank of England adds a cross current through GBP and EUR which together carry real weight inside DXY. You do not have to predict any of these. You only need to decide what you will do if price reaches your bands with momentum or with rejection.
How to read the round number
One hundred is not a signal. It is a liquidity pocket. The first touch after a period below tends to be noisy because participants with different time frames meet there. The more disciplined path is to let the first touch play out, then trade the second decision. If a fifteen minute close accepts above 100.20 and pullbacks hold, you have confirmation to work the first band. If the first test spikes and fails, the wick itself gives you a clear invalidation for a fade back toward 99.50.
Scenarios to plan for
Acceptance above the first band
Price pushes through 100.15 and holds above 100.20 on a fifteen minute close after firm services or a solid tone in rates. The plan is to buy the first clean retest of 100.20 with a stop a few ticks below the retest low. First target 100.45. Second target 100.80 to 101.00 if the tape stays orderly. Trail only after the first target prints.
Rejection at the first band
A sharp wick into 100.15 to 100.45 that fails within the first five to ten minutes after headlines is often the highest quality fade of the week. Short into the rejection with a stop above 100.55. Take partials into 99.80 and again into 99.50. If 99.50 loses on a fifteen minute close, hold a runner for 99.30.
Breakdown through support
If 99.50 to 99.30 gives way without a clear catalyst, do not chase the first break. Wait for a back test that fails. Then target 98.90 to 98.60 with small size. This environment rewards patience because air pockets near round numbers can retrace quickly.
Cross current from the Bank of England
If the press conference lifts GBP and EUR, DXY can slide even if U.S. data is mixed. In that case the plan is simple. Respect your support shelves. Do not fight a broad based dollar selloff at support unless the curve turns back in your favor.
Execution checklist
• Price touches a band on a headline.
• Wait five full minutes.
• Decide between confirmation or rejection.
• If confirmation, demand a fifteen minute close through the band and a clean retest.
• If rejection, let the wick print and use the wick high or low as your invalidation.
• Take partials one band at a time rather than the exact level.
• If you are still in a trade into the U.S. close on Friday, flatten first and protect your weekend.
Risk and position sizing
Keep risk small until the midweek cluster passes. Use a volatility stop based on the current fifteen minute ATR. Tie your size to that stop so that one loss equals a fixed fraction of account risk. Set a max loss for the day and for the week. If either is hit you are done. That is a rule, not a suggestion.
What can go wrong
• A surprise release at an unexpected time can push the index through a band before you have a signal. If you missed it, you missed it. Do nothing.
• A sloppy Treasury headline can move rates while equities rally. That mixture can confuse the dollar for an hour. Size down and let the tape choose a side.
• The Bank of England tone can reverse a move you liked. During the press conference keep positions smaller and stops wider or stand aside.
Three simple rules for the week
• Trade reaction, never the headline itself.
• Confirm with a fifteen minute close before betting on a break.
• Take partials into the next band every single time.
Disclaimer
Education and analytics only. This is not investment advice.
DXY Update - AttentionIt's very interesting to observe the current movement of the US Dollar Index. From the price action, it appears the DXY is gathering strength to reverse direction.
This is evident in the strong consolidation above the 96 level.
We still need to pay attention to this area, as early signs of a reversal are already visible.
And I'm sure we already understand the implications of this.
Have a blessing week ahead !

USD COLLAPSE!This will be the final crash of the USD... coded.
This has been coming for years i have predicted this since 2022...

DXY WILL KEEP GROWING|LONG|
✅DXY After a clean breakout above the key level, the index is showing strength and structure shift in favor of buyers. A potential retest of the zone may trigger continuation toward the target area. Time Frame 4H.
LONG🚀
✅Like and subscribe to never miss a new idea!✅

US Dollar Index (DXY) – Institutional Structural OutlookMacro Context
The Dollar Index is currently holding within a weekly demand zone after a prolonged distributive phase. The market is evaluating whether this region will act as a structural accumulation base or if deeper liquidity levels will be tested. Confirmation from COT reports will be crucial to validate institutional positioning.
Technical Structure
Breakout & Acceptance: The last major breakout is still respected, with price now consolidating above demand.
Demand Layers: Three clear demand zones are mapped:
Current Demand – where the market is attempting to accumulate.
Deep Discount Demand – a deeper structural level where liquidity could be absorbed if the first zone fails.
Extreme Deep Discount Demand – ultimate defensive layer, aligned with long-term rebalancing.
Accumulation: Price is building a smaller accumulation range, signaling potential preparation for an institutional move.
Projected Scenarios
Primary Bias (Accumulation/Long): If confirmed by COT, current accumulation may trigger a structural recovery of the Dollar, strengthening against weaker counterparts (AUD, NZD).
Invalidation: A clean break below the current demand would open the path towards deeper demand zones, reframing the context as continuation of distribution.
Confirmation & Monitoring
COT Reports: Weekly positioning will confirm whether institutional players are indeed accumulating or still unwinding Dollar exposure.
Volatility Index (VIX + EVZ): As timing filters for breakout confirmation.
Macro Drivers: Next Fed communications and global liquidity flows remain critical catalysts.
⚖️ Institutional Note: The DXY is at a decision point – smaller accumulation is visible, but validation from institutional flows (COT) is essential before considering a structural recovery.

DXY SELL TO BUY-Monthly-Bullish respect candle
Weekly-Bullish orderflow leg
Daily bullish context area FVG overlapping with FvA
H1- entry time frame for swingers, Intra day traders use 5mnt

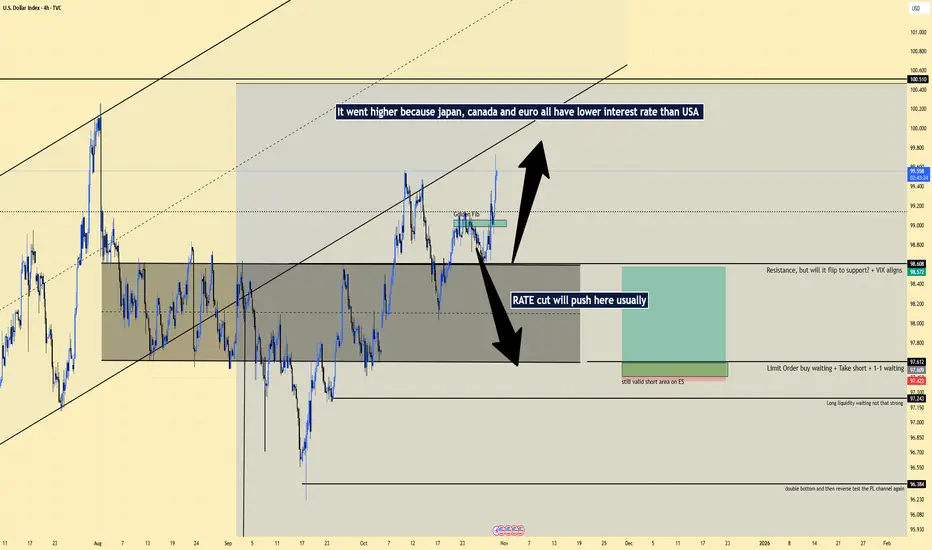
Dollar Index Analysis and Macro view in shortSo, I was analyzing the Dollar Index (DXY) to understand its next direction.
Initially, I had not checked the global interest rate landscape.
After reviewing the interest rates of Japan, Canada, Europe, and other regions, it became clear that the United States currently has higher interest rates.
This means capital is more likely to stay in the U.S. dollar, which supports continued strength in the DXY. The move was expected and aligned well with the VIX behavior.
In this analysis, I used a blend of:
Technical analysis
Semi-fundamental insights
Macro-economic context
If you have a different view or a different approach to analyzing the DXY, feel free to share your thoughts in the comments.
I would love to hear how you approach dollar index analysis, because understanding the DXY is one of the key components of global market insight.
DXY: Next Move Is Down! Short!
My dear friends,
Today we will analyse DXY together☺️
The recent price action suggests a shift in mid-term momentum. A break below the current local range around 99.155 will confirm the new direction downwards with the target being the next key level of 98.854 and a reconvened placement of a stop-loss beyond the range.
❤️Sending you lots of Love and Hugs❤️

dxy 1h🔹 Overall Outlook and Potential Price Movements
In the charts above, we have outlined the overall outlook and possible price movement paths.
As shown, each analysis highlights a key support or resistance zone near the current market price. The market’s reaction to these zones — whether a breakout or rejection — will likely determine the next direction of the price toward the specified levels.
⚠️ Important Note:
The purpose of these trading perspectives is to identify key upcoming price levels and assess potential market reactions. The provided analyses are not trading signals in any way.
✅ Recommendation for Use:
To make effective use of these analyses, it is advised to manually draw the marked zones on your chart. Then, on the 5-minute time frame, monitor the candlestick behavior and look for valid entry triggers before making any trading decisions.

HSC+SH EUTo accomodate any attempt to reach pre ois high or weekly
Half session confirmation LDN 2nd moving 24 pips, flexed SL 2 pips to give trade breathing space in case atte.pted to reach Weekly high, aligns with DXY movement (reversing against strong holding support line) that might hold for one last time :)

FOMC OutlookAs US–China trade war concerns ease, the market’s attention is turning to today’s FOMC meeting. The Fed is expected to cut rates by 25 basis points, a move that is already fully priced in. The decision comes amid “rising risks in the labor market,” as emphasized by nearly all Fed members.
In addition to today’s expected 25 bps cut, markets are also pricing in another reduction at the December meeting. With inflation increasing more slowly than expected and Trump easing tariffs, the Fed now has greater flexibility to lower rates, aligning with our outlook.
Two main topics will be in focus at this meeting. The first is quantitative tightening (QT). The Fed slowed QT earlier this year, and based on Powell’s recent comments, it could slow further or even be halted entirely. The 10-year Treasury yield has already fallen below 4% in anticipation of such a move. The Fed is likely to announce the end of QT or signal that it will conclude soon. If the announcement did not come, it will be seen as hawkish.
The second topic is further rate cuts in 2026. Markets are pricing in two to three additional cuts that year. Powell’s tone regarding the 2026 outlook could be one of the key drivers of today’s market reaction.
The dollar index remains calm ahead of the meeting. After testing the long-term trendline from 2011 (white line), the dollar recovered above its 100-day moving average and has since turned flat. The 99.60–100.80 zone, previously a major support, now acts as resistance. The dollar is currently trapped between that resistance and the long-term trendline. Depending on the outcome of today’s FOMC meeting, the index could start to move either toward the resistance area or back to the trendline.

DXY: DECODED ANALYSIS My technical analysis on DXY: It currently shows a bullish trend on the quarterly, monthly, and weekly charts. The target is $111.68.
This information is for educational purposes only.
Always DYOR (Do Your Own Research).
Note: TradingView does not allow showing certain charts that go beyond technical analysis.
