Trade ideas
Silver will continue to outperform Gold Hi Guys
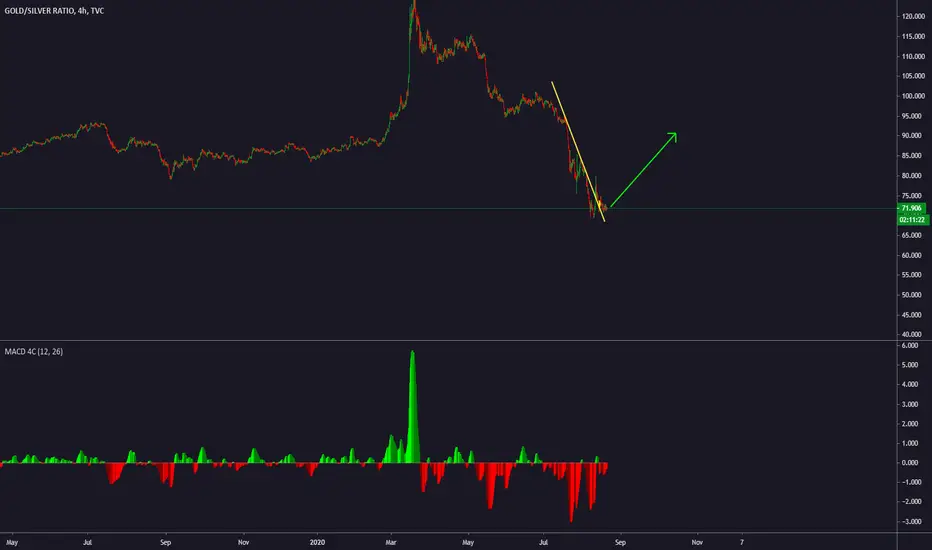
I bring you here the gold/silver ratio, we played this game beautifully selling Gold for silver at 118:1. It is currently 72:1.
In the short term I can see it testing 82:1, but as you can see here it had broken the 200 Week moving average about 3.5 weeks ago.
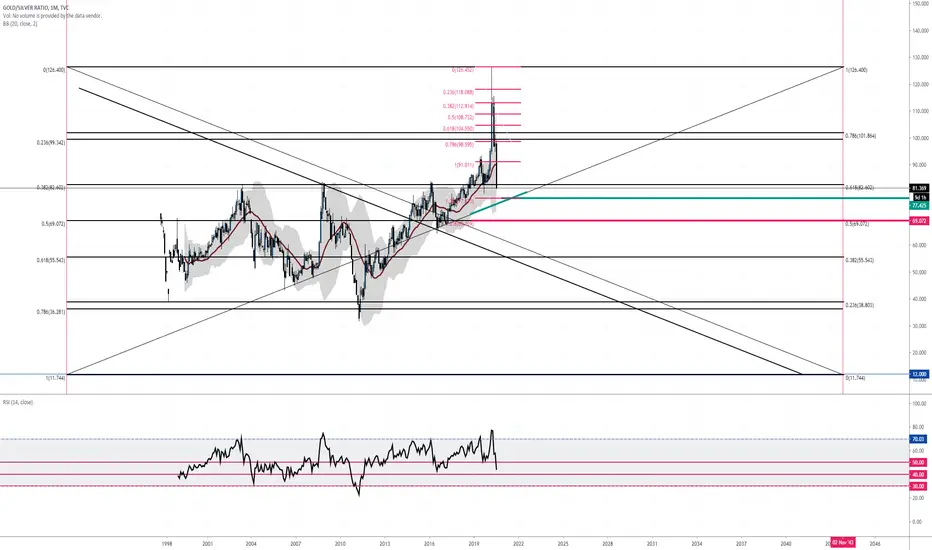
Previously the Ratio was below the 200WMA for 128, 202, 14 weeks respectively. With the biggest drop of 47% from OCT 10 - April 11
Since we hit record highs of 126:1 I expect the closeness of the Ratio to be closer, Making Silver Still an acceptation Buy


Use this ratio to forecast gold & silver movesThis ratio will help you to forecast XauUsd & XagUsd. When you forecast gold and silver next moves also use this ratio as an indicator. Currently this ratio is bearish, but expect some correction soon. Bearish ratio means XauUsd has more weakness than XagUsd, and vice versa.


Gold Should Outperform Silver in Near Term.The Gold/Silver Ratio decline appears to be nearing the end of its historical drop. The ratio is on its fifth wave extension, it's entering a convergence zone, and RSI shows oversold. At a silver price of $31 and gold price of $2125, the ratio should reach its terminus. I am still bullish silver in the short term, but I think it will be gold that really takes off. On the medium and long time frames, I think that either metal could outperform the other.

GOLDSILVER RATIO! BIG TIMES AHEAD!Gold silver ratio is falling, I expect that the silver price will jump up to 3 digit numbers in the near future. Recomand small position sizes for CFD-s, buy instead physical silver in order to protect yourself against liquidations.

GOLD rally to begingold silver ratio chart shows
gold is about to rally strongly and silver
to move even stronger.
even at just under $2K/oz the rally hasnt even
started yet.
people are waking up to the fact their
currency is being debased.

Silver ready to breakout from goldGold silver ratio currently resting on top of the channel at ratio 82.
I am expecting silver to break out this pattern soon en return to the average of 60 to 1 or even higher if history repeats


The Gold/Silver complex has caught renewed bids this weekShow Me the Money! 23 July, 2020, by Vladimir Rojankovski, Senior Analyst, Grand Capital
The Gold/Silver complex has caught renewed bids this week, which was tipped off by the major gold ETF – SPDR Gold Trust – showing up on the "Doji Week" scan back on Monday. The Doji Week scan is designed to find stocks that are in narrow ranges compared to prior week's activity that is geared up for a stronger directional move.
There are a number of Gold/Silver - related ETFs and stocks appearing on the Wide Range Breakouts, Power Up, and Overbought results today as the market gets behind their momentum against a sliding US Dollar. As investors’ classics – Barrick Gold (GLD) and Newmont Corp. (NEM) – look increasingly overvalued by both investment multiples and technically, new kids on the block, such as Agnico Eagle Mines (AEM) and Kinross Gold (KGC) look increasingly promising. The two latter stocks unveil single digit price-to-sales ratios as opposed to double-digit ones for Barrick and Newmont.

Most Bullish Chart for Silver70:1 GOLD/SILVER ratio is the average ratio when silver is treated as an industrial metal. However, if you believer Silver will be receiving monetary investment demand, like Gold has been, then 70:1 may become the neckline for a much more aggressive silver price and a ratio closer to 20:1 in Silver's favor.
That means if Gold hits $3,000 an ounce like Bank of America forecasts, then Silver should hit $150 an ounce with a 20:1 gold/silver ratio.

Silver in a Coma, Gold holding SteadyMain street still not waking up to what the big boys in gold are doing yet. When they do though, Silver is where the action will be. Gold:Silver ratio targeting 125:1

The ratio has reached the line of support.We took the profits from our short position in the ratio, as well as the profits from the silver long position. For now I expect to see some sideways trading and the ratio could pullback towards the 93-94 area. I don't see a reason to go long in this case, however it is an opportunity. If you wish to take the long position in the ratio - bear in mind the fact that the silver market is very strong and the trend could easily be broken without retracing back towards the 93-94 area. To monitor this - close out the long below 87.5 and enter a short position again targeting 81.5. I will make another update as soon as I see some movement.

Gold to make a comebackThat was parabolic for silver. I expect Gold to come back up from the the ratio. But that doesnt mean the fiat price will go up. Silver is overbought.
This is short term, I do expect eventually that the ration will be under 40:1

Silver to hit $400 by 2026?Assessing the G/S ratio and my prediction of $10,000/oz by 2026, the price of silver could potentially hit $400/oz by this time as inflation runs out of control.

Mint Ratio back to normalFirstly, please support our work by clicking like button & or following! These really assist us to reach more investors & traders like you!
Gold/Silver ratio might signal to investors that its high time to stop buying silver.

