JSE Top 40In my 07 March report I highlighted the technical risk with the index having traded at the upper boundary (2.5 to 3x the mean) of it’s 200-month linear regression channel. We have since seen the index retrace toward it’s mean with the price lower by 16.6% from the March peak. The 7-month RSI prints 38 which is considered weak but not yet oversold. While we may see rebounds on a short term basis, the regime remains ‘weak’. Considering the quarterly time frame, it remains in a strong but near overbought regime.
SA40 trade ideas

SA40Cash 15min inverted HS pattern15min ALSI broke neckline of a IHS pattern, this opens up targets to 60k if the bulls keep the momentum up

Top40- Cheap gets cheaperThe Top40 is precariously clutching to support, but as I see it, a breach of 59000 opens the door for another 4000 points downside. This chart just looks sick right now. I'd be selling here until I'm convinced otherwise. People who pick bottoms only end up with smelly fingers...

JSE Top 40JSE Top 40 Index - rejected at declining 8-EMA (prior demand-supply zone). Strength in Asian markets could see 21-EMA being targeted which will also be a distribution zone.

#SA40cash Diamond patternIts been a while since a diamond pattern has formed on the SA40 index.
take your pick, IHS or HS can form here. entry is key to risk management no matter which direction one plays.

JSE ALSI 40 - Short - Inverse Cup and Handle Technically an Inverse Cup and Handle has presented itself.
The breakout below the brim level is still quite a weak breakout, but the stop loss is quite wide to give leeway.
Fundamentally, Inflationary measures and rising interest rates are going to have a ripple effect around the world. The JSE will also following leading markets, which will bring it down. I'm going short...
What do you think?
Kind regards,
Timon Rossolimos
CEO, MATI Trader

TOP40: another leg down?Crossed below its 200-day simple moving average - which supports a bearish trend direction.
A price action below 63 600 supports a bearish trend direction Crossing above this level will negate the bearish stance.
Breaking further below 61800 might target 60600.
Breaking above 63000 will be the first sign of strength building in the index.
RSI leaves enough room for further downside price potential.

SA40/J200 bearish and more bearishSA40 index retested the breakdown level 64200 today after it broke down to the downside yesterday from a confirmed HS pattern.
right now bears are in full control of this downward channel and the lower price objective of 63000 can be achieved in the coming sessions

JSE Top 40 IndexAt the top of last week I highlighted the theme, which was 'be selective', mentioning that traders should take caution following the strong move over the prior two week. The channel resistance and 61.8% FIB retracement was highlighted as resistance zones and we have since seen the index unwind from a 'near overbought' rating to a neutral rating. The next level of potential support is around the prior breakout zone or just above that at the rising 21-day EMA however we could also overshoot these zone to the downside. We are seeing the index coming under pressure in line with other global markets as bond yields rise, specifically in the U.S where the US10Y is above the psychological 3% level. For now, the theme remains 'be selective'.

JSE ALL SHARE 40 - Bull Trap - Inverse Cup and Handle - 25 MayThe JSE ALL SHARE 40 seems to be forming two bearish patterns.
1. An Inverse Cup and Handle where the price is about to break below the brim level sending it down.
2. Bearish pennant which is tricking many traders into a bull trap.
I may be wrong and this might be the bottom but in my 2 decade career, I've learnt to go with the trend until it confirms an end.
So I am going short JSE ALSI 40 today.

#ALSI still trading bearish territory63600 has proven to be strong resistance on the SA40 index, bears can easily take prices back down to
62100 then possibly to 60250.
on the flip side, if the bulls can get sustained trading above 63600, then targets at 64500 and 66000 can be achieved

JSE Top 40 IndexJSE Top 40 (Spot) Index (63026) | Bottom Line: On Tuesday, the index traded into and slightly overshot the demand-supply zone at 62900 to 63400 highlighted on Monday morning. This level (the high of the day) is also in line with the declining 21-EMA acted as a resistance level and distribution zone.

TOP40- BrokenI think it's safe to say that support has been broken...Get ready to short the next bounce...

ALSI Top40 daily at support againALSI has tested its One year moving average for the 3rd time this year which also confluences with lateral support off the 63100 price level
this level offers good Risk to reward for swing traders

J200 ALSI bears remain in full controlJ200 trading below its 1 year average and looking technically bearish for further downside

j200 ALSI bears in Cruise controlJ200/top40 showing Continued weakness today after yesterdays 1.5% selling with today price action confirming a bigger double top breakdown.

Roll over Beethoven- Top40The Top40 certainly seems to be rolling over as small rallies are being sold. It also looks as if the 50 day moving average is acting as a resistance level which is also evident in today's price action. Momentum indicators have all started to turn lower so it look a good opportunity to cash in on some downside... I think there's at least 2500 points up for grabs in the next 2 weeks


j200/top40 Bulls desperately defending LIS 68150ALSI bulls doing whatever they can to hold this 68150 support level.
failure below 67950 see's more downside to 67250

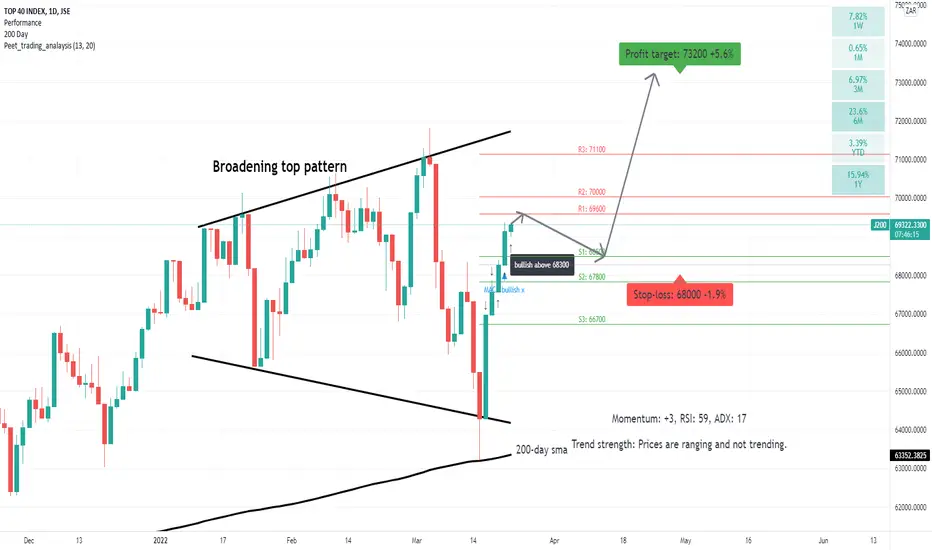
TOP40 index: further upside potential?A bullish trend is applicable above 68300. Crossing below this level will negate the bullish stance.
Upside price momentum supports the bullish trend direction.
RSI leaves enough room for further upside price potential.
Broadening top pattern applicable.
MACD bullish crossover also supports the bullish trend direction.
ALSI/Top40 support + 200dma confluenceon the Daily chart :
200ema + lateral support at 63250 is always a place to buy when given the opportunity,
nice and simple.

JSE Top 40The Top 40 Index approaching a level of support at the previous breakout level; which level is also coinciding with it's 200dma.
We currently about -10% off the highs; a further -10% drop will 'officially' take us into a bear market!

South Africa Top 40 Index: Bullish Bias on the 1 hour & DailyOn the daily chart we notice that the level of structure 65797 has been respected, but on the level of structure from 70127 was not respected. Down to the 1 hour chart we find that the same occurs on level of structure which is 68863 is respected but the structure which is from 70557 was not respected only once whereas from the average level of structure which is 69243 was not respected where a retest was also spotted with consolidation as well.
