Related indices
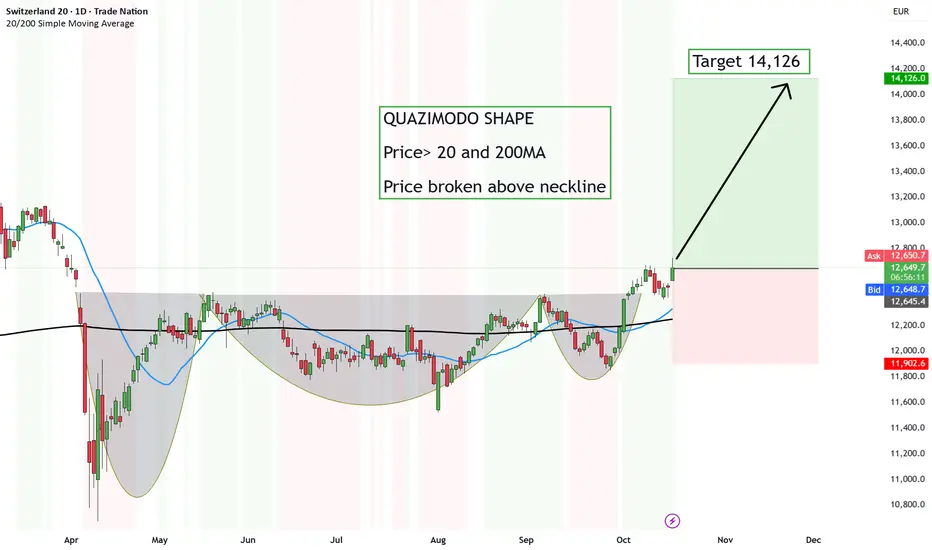
NEW Switzerland 20 – The Quasimodo Awakens with a BULL Meet the Quasimodo shape – yes, the same name as the hunchback from Notre Dame 😅
But in trading, it’s no fairy tale… it’s a powerful reversal pattern.
We’ve got price above both the 20MA and 200MA, and it’s now broken cleanly above the neckline — confirming the pattern.
That breakout signals a po
Swiss Market Index nice hammer off 200 MAIt is not everyday that we look at the Swiss Market Index, which is Switzerland's blue-chip stock market index of 20 of the largest and most liquid stocks.
BUT when something bounces off a trend line inside a long-term bullish trend, and that trend line happens to converge with a prior support and

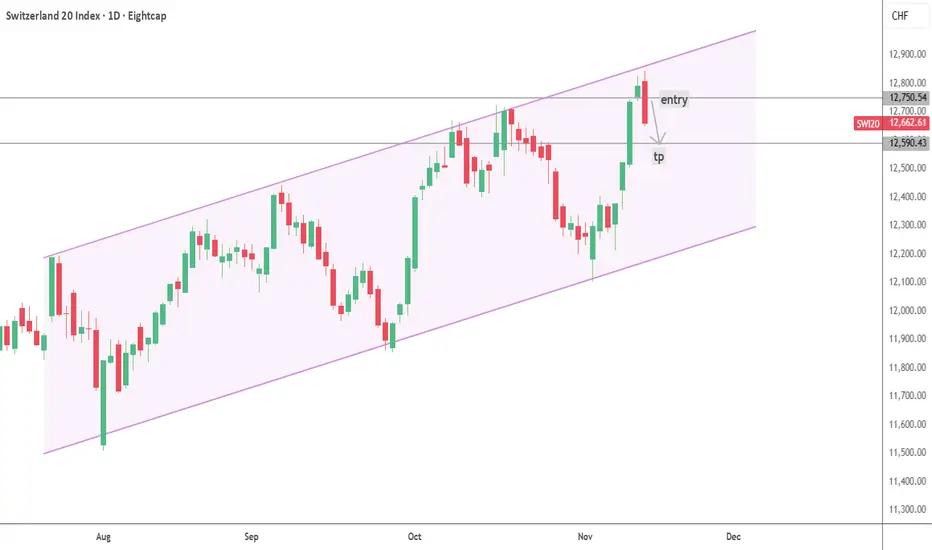
Something to keep eye on.. v2.0updating the previous idea
Diagonal down perhaps A
Flat B
Wave C to be executed

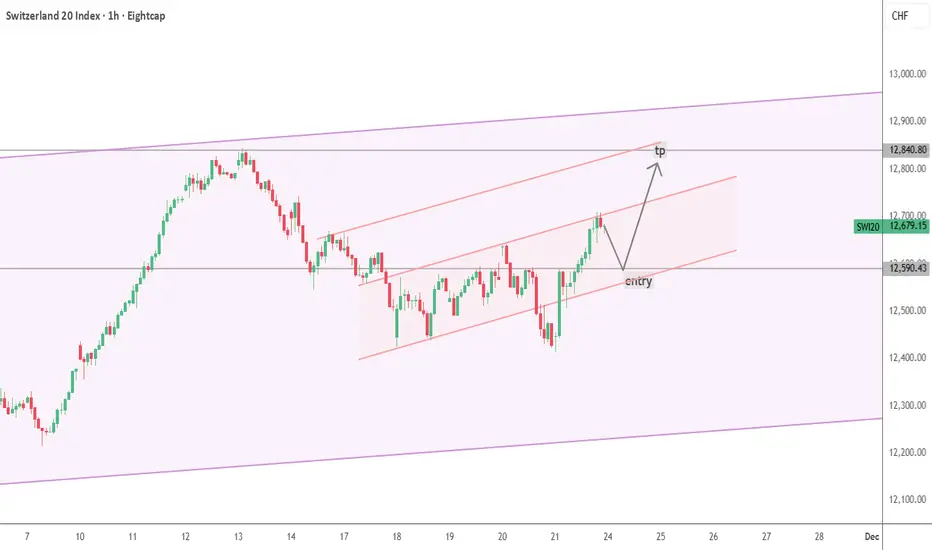
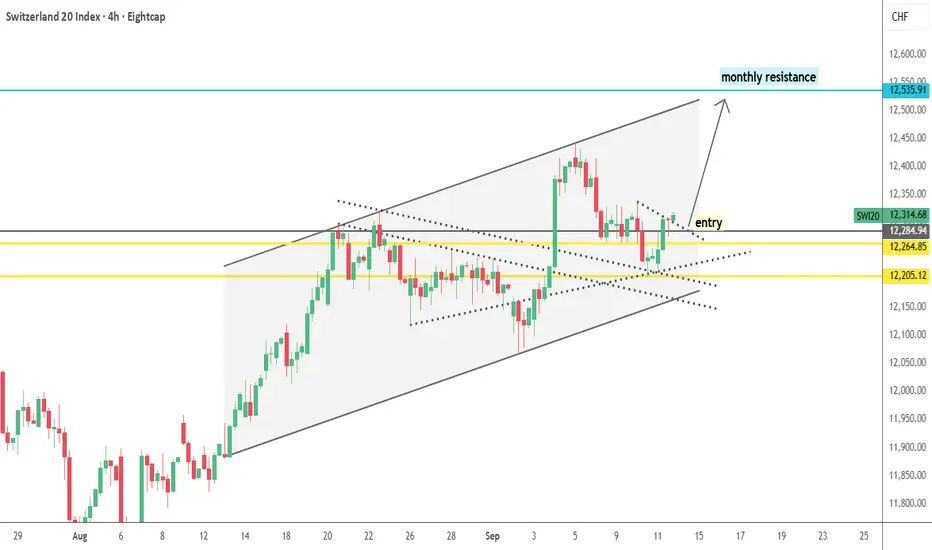
SWI20-LONG--Bulish bias
--monthly bullish
--daily bullish
--tp and entry levels are as shown on chart
Wyckoff Accumilation Live ExampleRichard Wyckoff has a theory regardign the markets phases, and this video exlaborates the accumilation with a live example from the main Swiss index SUI20
Best of Luch
MarketsTitan

Switzerland 20: A small to medium term bullish moveHello,
The Switzerland 20, a key benchmark of the Swiss stock market, is showing signs of a potential bullish move, driven by technical patterns and macroeconomic resilience. As global markets navigate trade tensions and economic uncertainties, the Switzerland 20 appears to be forming a bullish fla

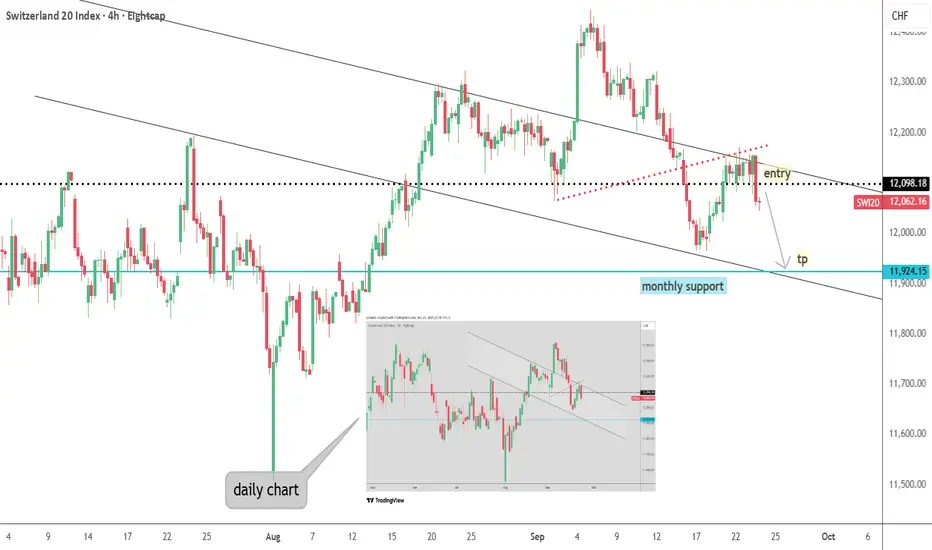
4-hr SMI20: 300 points Drop on The RadarThe Swiss stock market index is mirroring its global counterparts, such as Germany 40 and US100, experiencing a sharp decline following the announcement of new tariffs by the Trump administration yesterday.
In response, we placed a sell order at 12,350, aiming to profit from the prevailing risk-off

See all ideas
Summarizing what the indicators are suggesting.
Oscillators
Neutral
SellBuy
Strong sellStrong buy
Strong sellSellNeutralBuyStrong buy
Oscillators
Neutral
SellBuy
Strong sellStrong buy
Strong sellSellNeutralBuyStrong buy
Summary
Neutral
SellBuy
Strong sellStrong buy
Strong sellSellNeutralBuyStrong buy
Summary
Neutral
SellBuy
Strong sellStrong buy
Strong sellSellNeutralBuyStrong buy
Summary
Neutral
SellBuy
Strong sellStrong buy
Strong sellSellNeutralBuyStrong buy
Moving Averages
Neutral
SellBuy
Strong sellStrong buy
Strong sellSellNeutralBuyStrong buy
Moving Averages
Neutral
SellBuy
Strong sellStrong buy
Strong sellSellNeutralBuyStrong buy
Displays a symbol's price movements over previous years to identify recurring trends.
Frequently Asked Questions
The current value of Swiss Market Index is 12,905.16 CHF — it has fallen by −0.13% in the past 24 hours. Track the index more closely on the Swiss Market Index chart.
Swiss Market Index reached its highest quote on Mar 3, 2025 — 13,199.05 CHF. See more data on the Swiss Market Index chart.
The lowest ever quote of Swiss Market Index is 1,279.00 CHF. It was reached on Jan 14, 1991. See more data on the Swiss Market Index chart.
Swiss Market Index value has increased by 0.30% in the past week, since last month it has shown a 3.18% increase, and over the year it's increased by 11.07%. Keep track of all changes on the Swiss Market Index chart.
Swiss Market Index is just a number that lets you track performance of the instruments comprising the index, so you can't invest in it directly. But you can buy Swiss Market Index futures or funds or invest in its components.