UKOIL M30 | Potential Bullish riseUKOIL has bounced off the buy entry aat 60.69, whichis a pullback support and could rise from this level to the upside.
Stop loss is at 59.83, which lines up with the 61.8% Fibonacci projection.
Take profit is at 62.94, which is a swing high resistance.
High Risk Investment Warning
Trading Forex/
About CFDs on Brent Crude Oil
The Brent Сrude oil was originally produced from the Brent oilfield in the North Sea. About 2/3rds of all crude oil contracts around the globe include Brent Сrude oil, making it the most popular marker. Its relatively low density and sulphur content are the reasons why it’s described as light and sweet. One of the advantages is transportation since this type of oil is waterborne. The Brent Crude oil marker is also known as Brent Blend, London Brent and Brent petroleum and has a UKOIL ticker symbol.

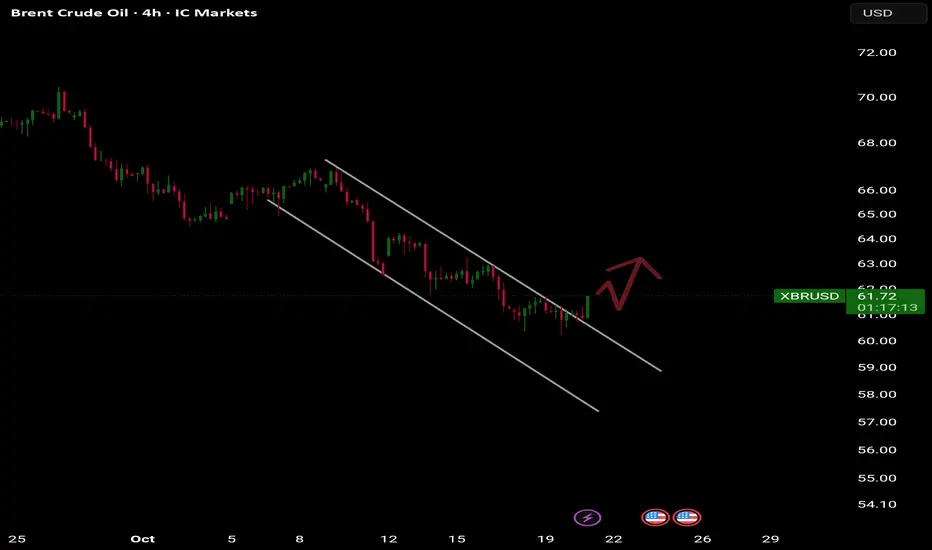
Brent Brent crude is compressing into a funnel. Expect upside in the near term. Htf and now ltf aligning. Expansion is next.

UKOIL H1 | Bearish Momentum BuildingBased on the H1 chart analysis, we can see the price rise to the sell entry, which is a pullback resistance, and could drop from this level.
Sell entry is at 64.43, whichis a pullback resitance.
Stop loss is at 65.10, whichis an overlap resistance.
Take profit is at 62.99, which aligns with the 7

UKOILSPOT H4 | Falling Towards 50% Fibonacci SupportBased on the H4 chart analysis, we could see the price fall towards the buy entry, which is a pullback support that aligns with the 50% Fibonacci retracement and could bounce from this level to the upside.
Buy entry is at 63.02, whichis a pullback support that lines up witht the 50% Fibonacci retra

Brent Crude bearish continuation at 6579 resistance
The Brent Crude Oil is currently trading with a bearish bias, aligned with the broader downward trend. Recent price action shows a retest of the longer term support, suggesting a temporary relief rally within the downtrend.
Key resistance is located at 6579, a prior consolidation zone. This level

Brent analysis for next weekBrent ended daily at resistance around 65.
I think Brent will be bearish next week, rebounding around 65 to hit support around 59.

Max bat Brent crudeThe obvious pattern is the max bat an hybrid pattern, gartley/bat. The image on screen gives max bat fib ratios.
The most crucial part of analysis is the price action from around early April. The red circle is around the heaviest volume candles. The fractal/ swing low candle has affected price ever

Brent Crude Oil – Potential Reversal and Early Recovery Setup#Brent Crude Oil – Potential Reversal and Early Recovery Setup
Current price: $61.08
Brent is forming a potential reversal structure after an extended downward cycle. The short-term pattern shows a breakout attempt from a descending channel, hinting at the possible start of a recovery phase.
🧩 Tec

OIL possibly reversing.OIL has broken out of the channel and started making Higher Highs on the lower timeframes. We will wait patiently to see if it is a FakeOut or will come back retesting and fly UP.🧐
OIL slowly rising.OIL has been moving in a range. Waiting for a BreakOut as it has been in one of the lowest points in history.

See all ideas
Displays a symbol's price movements over previous years to identify recurring trends.