FTSE 100 Perfect Channel Up buy opportunity.FTSE 100 (UK100) has been trading within a 5-month Channel Up and right now finds itself within its 4H MA50 (red trend-line) and 1D MA50 (blue trend-line). The 1D MA50 has been intact as a Support since May 02 and initiated its previous Bullish Leg on June 25.
We expect a similar rally towards the 2.382 Fibonacci extension, targeting 9700.
-------------------------------------------------------------------------------
** Please LIKE 👍, FOLLOW ✅, SHARE 🙌 and COMMENT ✍ if you enjoy this idea! Also share your ideas and charts in the comments section below! This is best way to keep it relevant, support us, keep the content here free and allow the idea to reach as many people as possible. **
-------------------------------------------------------------------------------
💸💸💸💸💸💸
👇 👇 👇 👇 👇 👇
UKX trade ideas

Heading into 38.2% Fibonacci resistance?UK100 is rising towards the pivot which acts as an overlap resistance that lines up with the 38.2% Fibonacci retracement and could reverse to the multi swing low support.
Pivot: 9,240.23
1st Support: 9,128.22
1st Resistance: 9,327.92
Disclaimer:
The above opinions given constitute general market commentary, and do not constitute the opinion or advice of IC Markets or any form of personal or investment advice.
Any opinions, news, research, analyses, prices, other information, or links to third-party sites contained on this website are provided on an "as-is" basis, are intended only to be informative, is not an advice nor a recommendation, nor research, or a record of our trading prices, or an offer of, or solicitation for a transaction in any financial instrument and thus should not be treated as such. The information provided does not involve any specific investment objectives, financial situation and needs of any specific person who may receive it. Please be aware, that past performance is not a reliable indicator of future performance and/or results. Past Performance or Forward-looking scenarios based upon the reasonable beliefs of the third-party provider are not a guarantee of future performance. Actual results may differ materially from those anticipated in forward-looking or past performance statements. IC Markets makes no representation or warranty and assumes no liability as to the accuracy or completeness of the information provided, nor any loss arising from any investment based on a recommendation, forecast or any information supplied by any third-party.

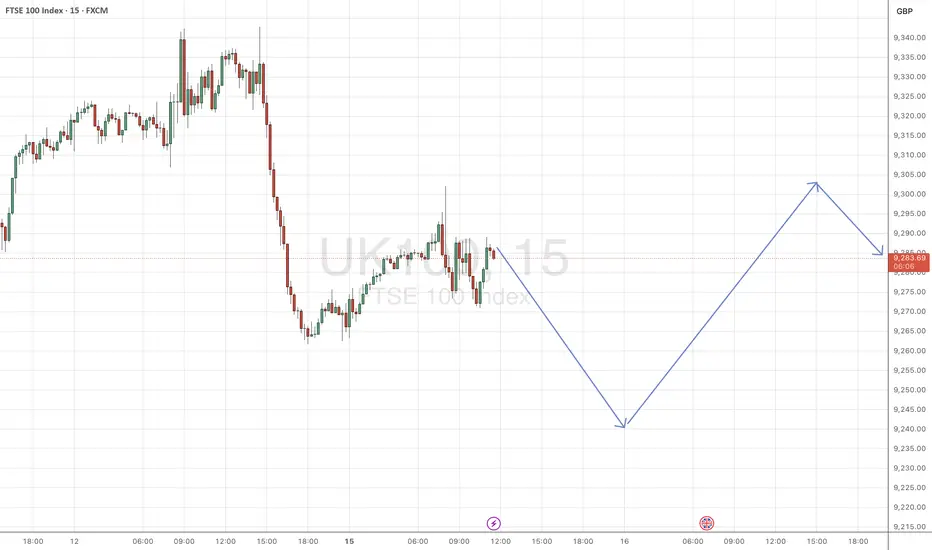
Rise and dip as bear Tuesday kicks in later30-Minute Chart Observations
Price is currently moving sideways around 9,274–9,278 (pivot level).
Very tight consolidation overnight with small candles (low volatility).
EMA cluster (10, 25, 200) is flat and converging — this often signals a larger directional move is coming.
Pivot points:
R1 = 9,297
R2 = 9,316
R3 = 9,334
S1 = 9,260
S2 = 9,242
S3 = 9,223
Daily Plan Adjustments with 30-Min View
Bullish Breakout (Intraday Long)
If FTSE clears 9,280–9,285 with volume (breakout of consolidation), target 9,297 (R1) first, then 9,316 (R2).
Intraday stop: below 9,265 (S1 / EMA cluster support).
This aligns with the daily bullish channel continuation.
Range Play (Mean Reversion)
As long as FTSE trades between 9,260 and 9,285, it’s just chop.
Scalpers can fade moves: buy near 9,260 support, sell near 9,285 resistance.
But this range is tight — better to wait for breakout.
Bearish Breakdown (Intraday Short)
If FTSE loses 9,260 with momentum, expect 9,242 (S2) test.
Stronger bearish momentum could target 9,223 (S3).
Stop for shorts: above 9,280 (back into range).
Summary
Bias unchanged: Daily still favors bullish above 9,260, bearish if we lose that.
Intraday twist: Market is compressing on the 30-min — watch for breakout from 9,260–9,285 box.
Best setup: Wait for a break of this narrow range → then align trades with daily pivot levels.

FTSE 100 uptrend remains intactThe FTSE 100 continues to trade above its multi-month rising trendline. The price has extended its recovery from the 9100 September low, rising above to a peak of 9340 last week, just shy of the 9360 record high.
Buyers will need to extend gains above 9360 to head towards fresh record highs. 9500 is a logical next target
Support is seen at 9150, the 50 SMA, and 9100, the August low. A break below 8880 negates the longer-term uptrend.
FC

Key Observations from the Chart with 9310 resistancePrice Action & Trend
The FTSE is currently at 9,281.7, just below the daily pivot (9,289).
Price is trading within a rising trend channel (red lines).
Higher lows since early September suggest short-term bullish momentum.
Moving Averages (EMA 10, 25, 200)
EMA (10) and EMA (25) are pointing upward, supporting short-term bullishness.
Price is above the EMA (200), confirming the longer-term uptrend is intact.
Pivot Points (Support/Resistance)
Pivot (P): 9,289 → price is hovering around here.
R1: 9,318, R2: 9,369, R3: 9,398 → upside resistance levels.
S1: 9,256, S2: 9,218, S3: 9,158 → downside support levels.
RSI (10)
RSI at ~58.4 → neutral to bullish, not yet overbought.
Trading Ideas
📈 Bullish Setup (trend-following)
Buy near support: ideally around S1 (9,256) or EMA (25).
Target: R1 (9,318), then R2 (9,369).
Stop-loss: below S2 (9,218).
📉 Bearish Setup (counter-trend / pullback)
Short near resistance: R1 (9,318) or upper channel line.
Target: back to Pivot (9,289) or S1 (9,256).
Stop-loss: above R2 (9,369).
⚠️ Neutral / Range Play
Since price is consolidating around the daily pivot, intraday traders might scalp between S1 (9,256) and R1 (9,318) until a breakout occurs.
Can Britain's Stock Market Survive Its Own Streets?The FTSE 100's recent 10.9% year-to-date outperformance against the S&P 500's 8.8% return masks deeper structural vulnerabilities that threaten the UK market's long-term viability. While this temporary surge appears to be driven by investor rotation away from overvalued US tech stocks toward traditional UK sectors, it obscures decades of underperformance: the FTSE 100 has delivered just 5.0% annualized returns over the past decade, compared to the S&P 500's 13.2%. The index's heavy weighting toward finance, energy, and mining, combined with minimal exposure to high-growth technology firms, has left it fundamentally misaligned with the modern economy's drivers of growth.
The UK's economic landscape presents mounting challenges that extend beyond market composition. Inflation rose to 3.8% in July, surpassing forecasts and increasing the likelihood of sustained high interest rates that could dampen economic activity. Government deficits reached £20.7 billion in June, raising concerns about fiscal sustainability, while policy uncertainty under the new Labour government creates additional investor hesitation. Geopolitical instability has shifted risk appetite for 61% of UK institutional investors, with half adopting more defensive strategies in response to global tensions.
Most significantly, civil unrest has emerged as a quantifiable economic threat that directly impacts business operations and market stability. Far-right mobilisation and anti-immigration demonstrations have resulted in violent clashes across UK cities, with over a quarter of UK businesses affected by civil unrest in 2024. The riots following the Southport stabbing incident alone generated an estimated £250 million in insured losses, with nearly half of the affected businesses forced to close premises and 44% reporting property damage. Business leaders now view civil unrest as a greater risk than terrorism, requiring increased security measures and insurance coverage that erode profitability.
The FTSE 100's future hinges on its ability to evolve beyond its traditional sectoral composition while navigating an increasingly volatile domestic environment where political violence has become a material business risk. The index's apparent resilience masks fundamental weaknesses that, combined with the rising costs of social and political instability, threaten to undermine long-term investor confidence and economic growth. Without significant structural adaptation and effective management of civil disorder risks, the UK's benchmark index faces an uncertain trajectory in an era where street-level violence translates directly into boardroom concerns.

UK100--LONG--monthly bullish
--weekly bullish
--daily bullish
--entry and tp levels are as shown on chart

UK100 ShortLooks like the index might tumble from the golden Fibonacci level, confirmed by a price correction at the previous golden level and the mid-golden level at the 1.276 Fibonacci level, using the extended Fibonacci tool.

FTSE uptrend resistance at 9285The FTSE remains in a bullish trend, with recent price action showing signs of a corrective pullback within the broader uptrend.
Support Zone: 9195 – a key level from previous consolidation. Price is currently testing or approaching this level.
A bullish rebound from 9195 would confirm ongoing upside momentum, with potential targets at:
9285 – initial resistance
9346 – psychological and structural level
9438 – extended resistance on the longer-term chart
Bearish Scenario:
A confirmed break and daily close below 9195 would weaken the bullish outlook and suggest deeper downside risk toward:
9133 – minor support
9100 – stronger support and potential demand zone
Outlook:
Bullish bias remains intact while the FTSE holds above 9195. A sustained break below this level could shift momentum to the downside in the short term.
This communication is for informational purposes only and should not be viewed as any form of recommendation as to a particular course of action or as investment advice. It is not intended as an offer or solicitation for the purchase or sale of any financial instrument or as an official confirmation of any transaction. Opinions, estimates and assumptions expressed herein are made as of the date of this communication and are subject to change without notice. This communication has been prepared based upon information, including market prices, data and other information, believed to be reliable; however, Trade Nation does not warrant its completeness or accuracy. All market prices and market data contained in or attached to this communication are indicative and subject to change without notice.

Will The FTSE100 Breakout Trigger This Bullish Plan?🎯 Title: UK100/FTSE100 Money Heist Plan: Bullish Breakout Play (Swing Trade) 💰⚡
Asset: #UK100 #FTSE100 ( TVC:UKOIL , FX:GBPUSD , OANDA:EURGBP )
🗺️ The Heist Plan Overview
Ladies & Gentlemen, Thief OG's! 👋🕵️♂️ Welcome to the vault. Our plan is a calculated BULLISH swing trade on the UK100, triggered by a key breakout. We're not kicking the door down; we're waiting for the alarm to be disabled first.
Trade Bias: Bullish (Pending Order Plan) 📈
Strategy: "The Thief" Layering Entry (Minimizes risk, maximizes opportunity)
Key Level: 9,250.00 – The Vault Door 🚪
⚡ Execution Details (The How)
ENTRY CONFIRMATION: We only move after a CONFIRMED BREAKOUT above 9,250.00. ⚡
SET AN ALARM! {{ticker}} > 9250 - Don't miss the signal!
ENTRY METHOD ("The Thief" Layer Strategy): 🎯
Instead of one risky entry, we use multiple BUY LIMIT orders placed below the breakout level to catch any retest. This is a sophisticated, risk-aware method.
Layer 1: 9,200.00
Layer 2: 9,225.00
Layer 3: 9,250.00 (Breakout Level Retest)
You can add more layers (e.g., 9,275) based on your capital & risk appetite.
STOP LOSS (The Escape Route): 🚨
My SL: 9,150.00 (Place after your entry is filled).
⚠️ IMPORTANT NOTE: This is MY plan. You, the Thief OG, MUST adjust your stop loss based on your own risk management strategy. Protect your capital.
TAKE PROFIT (The Escape with the Money): 💎
TP Target: 9,400.00
Why Here? This aligns with a major historical resistance zone, potential overbought conditions, and a classic bull trap area. Escape with your stolen profits before the market reverses!
⚠️ IMPORTANT NOTE: You can choose to take partial profits earlier or trail your stop. "Make money then take money at your own risk."
🕵️♂️ Why This Heist? (The Analysis)
This isn't a random guess. It's a plan backed by data.
📊 Real-Time Snapshot (#UK100CFD)
Daily Change: -0.09% 📉 (A slight dip for a better entry?)
1-Month Performance: +0.48% 📈
1-Year Performance: +12.55% 🚀 (Strong underlying trend)
😊 Market Sentiment & Fear/Greed
Retail Sentiment: 55% Bullish 🐂 | 45% Bearish 🐻
Institutional Sentiment: 60% Bullish 🐂 | 40% Bearish 🐻
Overall Mood: Moderately Bullish 😊
Fear & Greed Index: 53/100 (Neutral) ⚖️
This suggests the market is not overly euphoric or fearful, providing a stable backdrop for our breakout play.
📈 Fundamental & Macro Backdrop:
Fundamental Score: 65/100 ✅
Strong earnings in defensive sectors (Healthcare, Energy). 💪
Attractive valuations vs. US indices (P/E 20% below S&P 500). 💰
Stable UK interest rate environment. 📊
Macro Score: 55/100 ⚖️ (Caution Advised)
Risks: UK GDP contraction (-0.3%) and global trade tensions. 📉🌎
Support: Bank of England rate cuts providing a floor. 🏦
Overall Outlook: 60/100 (Mildly Bullish) 🐂
The resilience of the FTSE100, combined with solid fundamentals and neutral sentiment, creates a favorable setup for a breakout to the upside.
✅ Related Pairs to Watch
TVC:UKOIL (BP/Shell correlation)
FX:GBPUSD (GBP strength/weakness)
OANDA:EURGBP (UK vs. Eurozone strength)
✨ “If you find value in my analysis, a 👍 and 🚀 boost is much appreciated — it helps me share more setups with the community!”
#Trading #Investing #SwingTrading #Breakout #Strategy #LayerStrategy #UK100 #FTSE #CFD #Protest #MoneyHeist #Plan

FTSE Reignites Uptrend After PullbackA key characteristic of uptrends is broken resistance turning into support. Last week’s price action on the FTSE 100 showed clear evidence of this, with buyers defending the prior breakout zone.
Let’s take a look at the potential trigger levels that could fuel momentum, as well as the red flags traders should keep on the radar.
Daily Chart: From Breakout to Retest
The FTSE broke to new highs in August after spending several weeks consolidating in a tight range. The breakout was followed by a sustained but orderly pullback that carved out a descending channel. As the market retested that old range, buyers stepped back in and forced prices back above the channel, keeping the broader uptrend intact.
Interestingly, there were subtle price action clues before the breakout even occurred. On Tuesday 2nd September, the index sold off sharply in the morning but closed well off its lows, leaving behind a hammer candle that signalled selling exhaustion. The next day produced a bullish hammer contained within Tuesday’s range, forming an inside day pattern that hinted at pressure building. That combination of exhaustion and contraction set the stage for the breakout that followed.
UK100 Daily Candle Chart
Past performance is not a reliable indicator of future results
Hourly Chart: VWAP as the Battleground
If we drill down into the hourly candles, the detail helps refine market timing. Anchoring a VWAP to last week’s lows highlights the average entry point for traders who powered the FTSE’s recovery. That line now acts as a battleground: if price slips back beneath it, bullish momentum traders should be on alert.
In terms of entry triggers, last week’s swing high becomes a key pivot. A clean break above this level would confirm that buyers are back in control and could fuel another leg higher towards the August highs. Until then, the VWAP support zone remains the level to watch for signs of dip buying.
UK100 Hourly Candle Chart
Past performance is not a reliable indicator of future results
Disclaimer: This is for information and learning purposes only. The information provided does not constitute investment advice nor take into account the individual financial circumstances or objectives of any investor. Any information that may be provided relating to past performance is not a reliable indicator of future results or performance. Social media channels are not relevant for UK residents.
Spread bets and CFDs are complex instruments and come with a high risk of losing money rapidly due to leverage. 85.24% of retail investor accounts lose money when trading spread bets and CFDs with this provider. You should consider whether you understand how spread bets and CFDs work and whether you can afford to take the high risk of losing your money.


UK100 H4 | Price rebounds at 50% Fibonacci supportUK100 is falling towards the buy entry which is a pullback support that aligns with the 50% Fibonacci retracement and could bounce from this level to the upside.
Buy entry is at 9,181.01, which is a pullback support that aligns with the 50% Fibonacci retracement.
Stop loss is at 9,081.97, which is a swing low support.
Take profit is at 9,340.36, which is a swing high resistance.
High Risk Investment Warning
Trading Forex/CFDs on margin carries a high level of risk and may not be suitable for all investors. Leverage can work against you.
Stratos Markets Limited (tradu.com ):
CFDs are complex instruments and come with a high risk of losing money rapidly due to leverage. 65% of retail investor accounts lose money when trading CFDs with this provider. You should consider whether you understand how CFDs work and whether you can afford to take the high risk of losing your money.
Stratos Europe Ltd (tradu.com ):
CFDs are complex instruments and come with a high risk of losing money rapidly due to leverage. 66% of retail investor accounts lose money when trading CFDs with this provider. You should consider whether you understand how CFDs work and whether you can afford to take the high risk of losing your money.
Stratos Global LLC (tradu.com ):
Losses can exceed deposits.
Please be advised that the information presented on TradingView is provided to Tradu (‘Company’, ‘we’) by a third-party provider (‘TFA Global Pte Ltd’). Please be reminded that you are solely responsible for the trading decisions on your account. There is a very high degree of risk involved in trading. Any information and/or content is intended entirely for research, educational and informational purposes only and does not constitute investment or consultation advice or investment strategy. The information is not tailored to the investment needs of any specific person and therefore does not involve a consideration of any of the investment objectives, financial situation or needs of any viewer that may receive it. Kindly also note that past performance is not a reliable indicator of future results. Actual results may differ materially from those anticipated in forward-looking or past performance statements. We assume no liability as to the accuracy or completeness of any of the information and/or content provided herein and the Company cannot be held responsible for any omission, mistake nor for any loss or damage including without limitation to any loss of profit which may arise from reliance on any information supplied by TFA Global Pte Ltd.
The speaker(s) is neither an employee, agent nor representative of Tradu and is therefore acting independently. The opinions given are their own, constitute general market commentary, and do not constitute the opinion or advice of Tradu or any form of personal or investment advice. Tradu neither endorses nor guarantees offerings of third-party speakers, nor is Tradu responsible for the content, veracity or opinions of third-party speakers, presenters or participants.

FTSE100, 9190 support retest? The FTSE remains in a bullish trend, with recent price action showing signs of a corrective pullback within the broader uptrend.
Support Zone: 9190 – a key level from previous consolidation. Price is currently testing or approaching this level.
A bullish rebound from 9190 would confirm ongoing upside momentum, with potential targets at:
9290 – initial resistance
9340 – psychological and structural level
9420 – extended resistance on the longer-term chart
Bearish Scenario:
A confirmed break and daily close below 9190 would weaken the bullish outlook and suggest deeper downside risk toward:
9150 – minor support
9110 – stronger support and potential demand zone
Outlook:
Bullish bias remains intact while the FTSE holds above 9190. A sustained break below this level could shift momentum to the downside in the short term.
This communication is for informational purposes only and should not be viewed as any form of recommendation as to a particular course of action or as investment advice. It is not intended as an offer or solicitation for the purchase or sale of any financial instrument or as an official confirmation of any transaction. Opinions, estimates and assumptions expressed herein are made as of the date of this communication and are subject to change without notice. This communication has been prepared based upon information, including market prices, data and other information, believed to be reliable; however, Trade Nation does not warrant its completeness or accuracy. All market prices and market data contained in or attached to this communication are indicative and subject to change without notice.
UK100 H4 | Bearish reversal off pullback resistanceBased on the H4 chart analysis, we can see that the price has rejected off the sell entry at 9,246.71, which is a pullback resistance and oculd potentially drop from this level to the take profit.
Stop loss is at 9,340.97, which is a multi-swing high resistance.
Take profit is at 9,107.27, which is a swing low support.
High Risk Investment Warning
Trading Forex/CFDs on margin carries a high level of risk and may not be suitable for all investors. Leverage can work against you.
Stratos Markets Limited (tradu.com ):
CFDs are complex instruments and come with a high risk of losing money rapidly due to leverage. 65% of retail investor accounts lose money when trading CFDs with this provider. You should consider whether you understand how CFDs work and whether you can afford to take the high risk of losing your money.
Stratos Europe Ltd (tradu.com ):
CFDs are complex instruments and come with a high risk of losing money rapidly due to leverage. 66% of retail investor accounts lose money when trading CFDs with this provider. You should consider whether you understand how CFDs work and whether you can afford to take the high risk of losing your money.
Stratos Global LLC (tradu.com ):
Losses can exceed deposits.
Please be advised that the information presented on TradingView is provided to Tradu (‘Company’, ‘we’) by a third-party provider (‘TFA Global Pte Ltd’). Please be reminded that you are solely responsible for the trading decisions on your account. There is a very high degree of risk involved in trading. Any information and/or content is intended entirely for research, educational and informational purposes only and does not constitute investment or consultation advice or investment strategy. The information is not tailored to the investment needs of any specific person and therefore does not involve a consideration of any of the investment objectives, financial situation or needs of any viewer that may receive it. Kindly also note that past performance is not a reliable indicator of future results. Actual results may differ materially from those anticipated in forward-looking or past performance statements. We assume no liability as to the accuracy or completeness of any of the information and/or content provided herein and the Company cannot be held responsible for any omission, mistake nor for any loss or damage including without limitation to any loss of profit which may arise from reliance on any information supplied by TFA Global Pte Ltd.
The speaker(s) is neither an employee, agent nor representative of Tradu and is therefore acting independently. The opinions given are their own, constitute general market commentary, and do not constitute the opinion or advice of Tradu or any form of personal or investment advice. Tradu neither endorses nor guarantees offerings of third-party speakers, nor is Tradu responsible for the content, veracity or opinions of third-party speakers, presenters or participants.

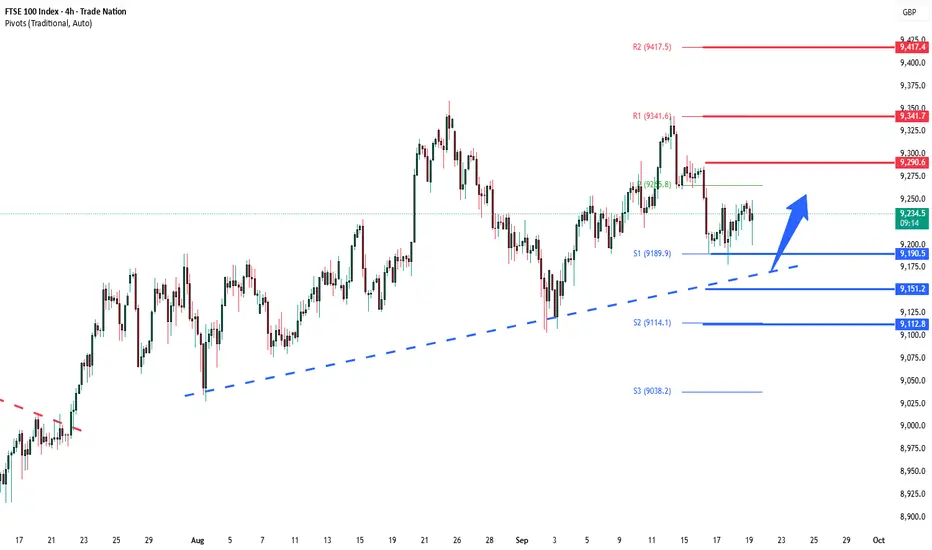
FTSE important support retest at 9190The FTSE remains in a bullish trend, with recent price action showing signs of a corrective pullback within the broader uptrend.
Support Zone: 9190 – a key level from previous consolidation. Price is currently testing or approaching this level.
A bullish rebound from 9190 would confirm ongoing upside momentum, with potential targets at:
9290 – initial resistance
9340 – psychological and structural level
9420 – extended resistance on the longer-term chart
Bearish Scenario:
A confirmed break and daily close below 9190 would weaken the bullish outlook and suggest deeper downside risk toward:
9150 – minor support
9110 – stronger support and potential demand zone
Outlook:
Bullish bias remains intact while the FTSE holds above 9190. A sustained break below this level could shift momentum to the downside in the short term.
This communication is for informational purposes only and should not be viewed as any form of recommendation as to a particular course of action or as investment advice. It is not intended as an offer or solicitation for the purchase or sale of any financial instrument or as an official confirmation of any transaction. Opinions, estimates and assumptions expressed herein are made as of the date of this communication and are subject to change without notice. This communication has been prepared based upon information, including market prices, data and other information, believed to be reliable; however, Trade Nation does not warrant its completeness or accuracy. All market prices and market data contained in or attached to this communication are indicative and subject to change without notice.

FTSE 100Trying to recover from that sell off.Can it .? That chart pattern is bearish,,,But it could turn around,>?

Short the rallies... buy the rumour sell the news on FOMC day!1. Short-Term (Intraday, 30-min chart)
Trend: Still bearish — price is trading below the 200 EMA (orange) and 25 EMA (blue). Multiple EMAs are aligned downward, showing short-term weakness.
Support:
Immediate: 9,165 (S1)
Next: 9,130 (S2)
Stronger: 9,070 (S3)
Resistance:
Pivot: 9,226
Stronger: 9,261 (R1)
Idea:
If price fails to reclaim the pivot (9,226) and gets rejected near EMA clusters, it favours a short back toward S1/S2.
A breakout above 9,226–9,261 zone with strong volume could shift bias to a quick long scalp targeting 9,300.
2. Medium-Term (Daily chart)
Trend: Mixed but leaning bearish — yesterday produced a strong red candle back under the 10 & 25 EMA. RSI (10) has rolled over at ~46, showing fading momentum.
Support:
Daily S1: 9,165
Trendline support: around 9,150–9,130
Resistance:
Pivot: 9,226
R1: 9,261
Idea:
If the index holds above 9,165 and rebounds, bulls may attempt another push into the 9,226–9,261 zone.
A close below 9,165 would confirm further downside toward 9,070–9,100.

FTSE 100 Wave Analysis – 16 September 2025- FTSE 100 reversed from resistance zone
- Likely to fall to support level 9090.00
FTSE 100 index recently reversed down from the resistance zone between the key resistance level 9330,00 (which stopped the previous wave (3) in the middle of August, as can be seen below) and the upper daily Bollinger Band.
The downward reversal from this resistance zone started the active short-term correction 2.
FTSE 100 index can be expected to fall to the next support level 9090.00, the target for the completion of the wave 2 (low of the previous correction (4)).

FTSE 100 updatedShowing signs of cold feet for the buyers...Needs to get right into support to really assess whether they are there

UK100 H4 | Bullish bounceBased on the H4 chart analysis, we could see the price fall to the buy entry of 9,236.24, whichis an overlap support that is slightly above the 50% Fibonacci retracement and could bounce from this level to the upside.
Stop loss is at 9,178.92, whichis a pullback support that is slightly below the 127.2% Fibonacci extension.
Take profit is at 9,340.36, which acts as a multi swing high resistance.
High Risk Investment Warning
Trading Forex/CFDs on margin carries a high level of risk and may not be suitable for all investors. Leverage can work against you.
Stratos Markets Limited (tradu.com ):
CFDs are complex instruments and come with a high risk of losing money rapidly due to leverage. 65% of retail investor accounts lose money when trading CFDs with this provider. You should consider whether you understand how CFDs work and whether you can afford to take the high risk of losing your money.
Stratos Europe Ltd (tradu.com ):
CFDs are complex instruments and come with a high risk of losing money rapidly due to leverage. 66% of retail investor accounts lose money when trading CFDs with this provider. You should consider whether you understand how CFDs work and whether you can afford to take the high risk of losing your money.
Stratos Global LLC (tradu.com ):
Losses can exceed deposits.
Please be advised that the information presented on TradingView is provided to Tradu (‘Company’, ‘we’) by a third-party provider (‘TFA Global Pte Ltd’). Please be reminded that you are solely responsible for the trading decisions on your account. There is a very high degree of risk involved in trading. Any information and/or content is intended entirely for research, educational and informational purposes only and does not constitute investment or consultation advice or investment strategy. The information is not tailored to the investment needs of any specific person and therefore does not involve a consideration of any of the investment objectives, financial situation or needs of any viewer that may receive it. Kindly also note that past performance is not a reliable indicator of future results. Actual results may differ materially from those anticipated in forward-looking or past performance statements. We assume no liability as to the accuracy or completeness of any of the information and/or content provided herein and the Company cannot be held responsible for any omission, mistake nor for any loss or damage including without limitation to any loss of profit which may arise from reliance on any information supplied by TFA Global Pte Ltd.
The speaker(s) is neither an employee, agent nor representative of Tradu and is therefore acting independently. The opinions given are their own, constitute general market commentary, and do not constitute the opinion or advice of Tradu or any form of personal or investment advice. Tradu neither endorses nor guarantees offerings of third-party speakers, nor is Tradu responsible for the content, veracity or opinions of third-party speakers, presenters or participants.

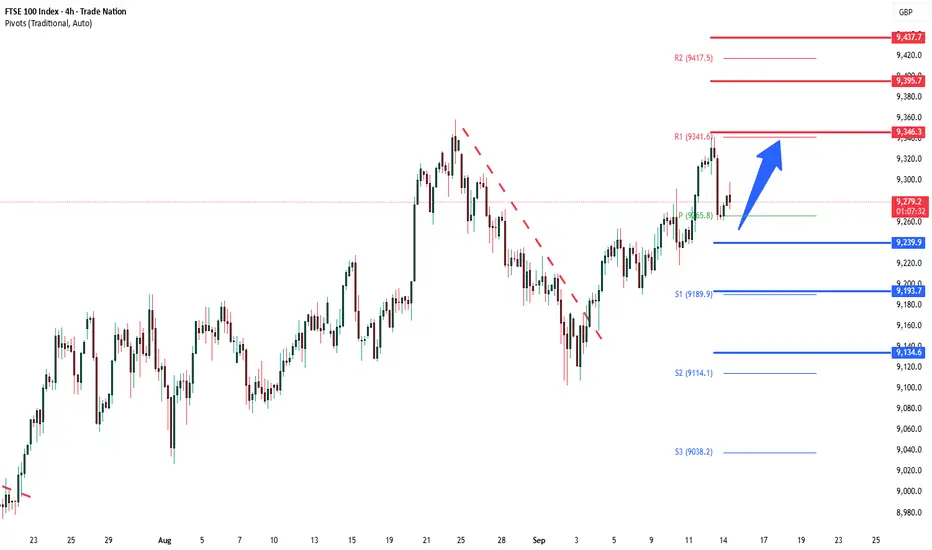
FTSE uptrend continuation resistance at 9346The FTSE remains in a bullish trend, with recent price action showing signs of a resistance retest within the broader uptrend.
Support Zone: 9240 – a key level from previous consolidation. Price is currently testing or approaching this level.
A bullish rebound from 9240 would confirm ongoing upside momentum, with potential targets at:
9346 – initial resistance
9395 – psychological and structural level
9437 – extended resistance on the longer-term chart
Bearish Scenario:
A confirmed break and daily close below 9240 would weaken the bullish outlook and suggest deeper downside risk toward:
9193 – minor support
9135 – stronger support and potential demand zone
Outlook:
Bullish bias remains intact while the FTSE holds above 9240. A sustained break below this level could shift momentum to the downside in the short term.
This communication is for informational purposes only and should not be viewed as any form of recommendation as to a particular course of action or as investment advice. It is not intended as an offer or solicitation for the purchase or sale of any financial instrument or as an official confirmation of any transaction. Opinions, estimates and assumptions expressed herein are made as of the date of this communication and are subject to change without notice. This communication has been prepared based upon information, including market prices, data and other information, believed to be reliable; however, Trade Nation does not warrant its completeness or accuracy. All market prices and market data contained in or attached to this communication are indicative and subject to change without notice.