FTSE bullish rally resistance at 9360The FTSE remains in a bullish trend, with recent price action showing signs of a corrective pullback within the broader uptrend.
Support Zone: 9220 – a key level from previous consolidation. Price is currently testing or approaching this level.
A bullish rebound from 9220 would confirm ongoing upside momentum, with potential targets at:
9360 – initial resistance
9380 – psychological and structural level
9400 – extended resistance on the longer-term chart
Bearish Scenario:
A confirmed break and daily close below 9220 would weaken the bullish outlook and suggest deeper downside risk toward:
9190 – minor support
9160 – stronger support and potential demand zone
Outlook:
Bullish bias remains intact while the FTSE holds above 9220. A sustained break below this level could shift momentum to the downside in the short term.
This communication is for informational purposes only and should not be viewed as any form of recommendation as to a particular course of action or as investment advice. It is not intended as an offer or solicitation for the purchase or sale of any financial instrument or as an official confirmation of any transaction. Opinions, estimates and assumptions expressed herein are made as of the date of this communication and are subject to change without notice. This communication has been prepared based upon information, including market prices, data and other information, believed to be reliable; however, Trade Nation does not warrant its completeness or accuracy. All market prices and market data contained in or attached to this communication are indicative and subject to change without notice.
UKX trade ideas

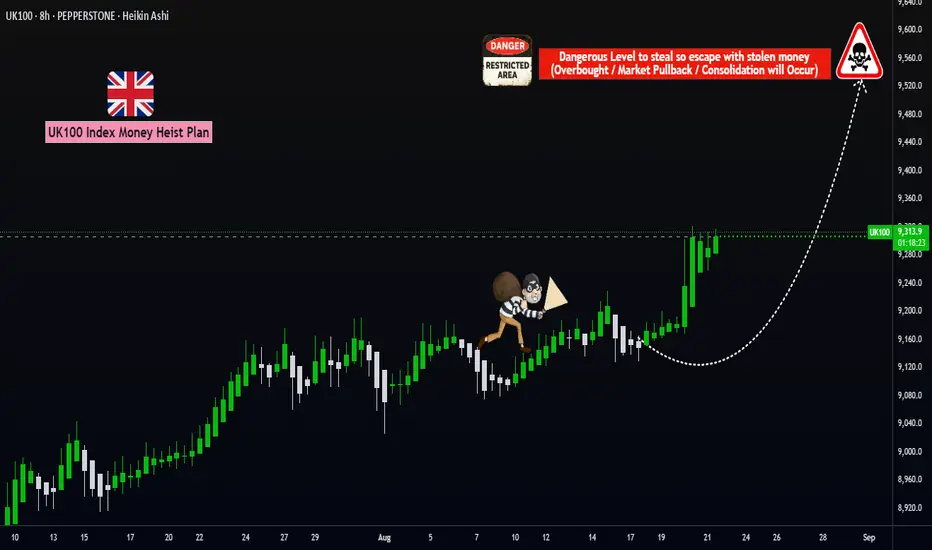
UK100 Bullish Heist: Ready to Loot the Upside?🎯 TRADE PLAN: UK100 BULLISH ROBBERY HEIST! 🎯
Asset: UK100 "FTSE 100 Index Cash" | Type: Indices CFD | Style: Swing & Scalping Larceny
Dearest Fellow Thieves & Money Bandits! 🤑💸🤵♂️👩💼
The vault doors to the UK100 are creaking open! Our intel confirms a BULLISH HEIST is in play. The big money is sitting pretty, and it's our duty to... redistribute it. Time to execute the plan with precision!
🗺️ THE HEIST BLUEPRINT
🎯 MISSION: BULLISH ROBBERY (LONG)
🔑 ENTRY:
The Thief's way is MULTIPLE LIMIT ORDER LAYERS! 🎰 We don't just enter; we infiltrate at all key levels. Deploy your buy limits at these coordinates:
👉 LAYER 1: 9240.0
👉 LAYER 2: 9260.0
👉 LAYER 3: 9280.0
👉 LAYER 4: 9300.0
(Pro Thieves: Add more layers based on your capital!)
🛑 STOP LOSS:
This is the Thief's OG Stop Loss @ 9160.0.
Attention Ladies & Gentlemen of refined taste: Adjust your SL based on your own risk appetite and strategy. Protect your capital!
🚨 TARGET - ESCAPE PLAN:
The police barricade is set up near 9600.0. Our escape car is waiting at 9520.0! 🚓💨
ESCAPE WITH THE STOLEN MONEY BEFORE TARGET! Do not get greedy and get caught! A true thief lives to rob another day.
👁️ NOTES FOR THE CREW:
Scalpers: Only swipe bags on the LONG side. Quick in, quick out. Use a tight trailing SL to lock in your stolen profits! 💰
Swing Traders: This is your masterpiece. Load up in layers and let the heist unfold.
⚠️ NEWS ALERT: High-impact news is like the security alarm going off! 🚨 Avoid new trades during these times and secure your running positions with trails.
💖 SUPPORT THE MISSION
💥 SMASH THAT "BOOST" BUTTON! 💥
Fuel our next heist! Your support allows us to case more joints and bring you the most profitable robbery plans. Let's make stealing money look easy! 🏆❤️🎯
Stay tuned, the next heist is already being planned... 🤑🐱👤🤫
Fresh record highs for the FTSE 100Increasing doubt over a quick resolution of the war in Ukraine gave defence and aerospace shares generally a boost around 20 August with companies like BAE Systems doing particularly well and propelling the FTSE 100 up to a new all-time high above 9,300. Recent warnings that the boom in AI might be running out of steam probably won’t affect the FTSE much since other areas like defence and mining are more important for this index than tech. Fresnillo plc remains by far the best performer of the FTSE 100 in 2025 so far, up more than 200%.
The 161.8% daily Fibonacci extension based on the drop around ‘liberation day’ is an obvious area of potential resistance around 9,350. A test there might be possible in the next few weeks if volume starts to return after summer’s lull.
9,000 as a psychological area is a potential support in the value area in the value area between the 50 and 100 SMAs. A significant retracement below there seems questionable unless there’s a strong change in fundamentals.
This is my personal opinion, not the opinion of Exness. This is not a recommendation to trade.

FTSE at record high - more upside to come?The FTSE benefitted from the recent rotation out of tech into value stocks, of which the FTSE has plenty, and which are undervalued.
Technically, the FTSE has hit resistance, which could slow gains for now.
The FTSE broke out of a short-term consolidation pattern, breaking higher to fresh record highs around 9300, with the rising trendline resistance dating back to April. The RSI tipped into overbought territory, so we could see further consolidation around this level.
With blue skies above, buyers will look to extend gains above 9300 to fresh record levels.
Support can be seen at 9200 and 9100. A break below here creates a lower low and opens the door to 9000.

FTSE hits a new record highFTSE 100 (+0.5%) hits a new record high above 9230, boosted by consumer staples. The UK index reversed earlier losses after hotter UK CPI data saw traders trim bets over further BoE rate cuts. Despite that, bond yields have fallen, and the pound has come off earlier highs.
The trend for the FTSE 100 remains bullish obviously with the index at records. Stating the fact there, but sometime it is important to do that as traders to remind ourselves which direction to pick for trades. As long as the series of higher highs and higher lows remain intact, dip-buying is the go-to trade for me. Key support now comes in around 9191, then 9127. Long-term support area is seen around the shaded green area on the chart, between 8837-8910.
By Fawad Razaqzada, market analyst with Forex.com

FTSE uptrend supported at 9114The FTSE remains in a bullish trend, with recent price action showing signs of a corrective pullback within the broader uptrend.
Support Zone: 9114 – a key level from previous consolidation. Price is currently testing or approaching this level.
A bullish rebound from 9114 would confirm ongoing upside momentum, with potential targets at:
9235 – initial resistance
9260 – psychological and structural level
9284 – extended resistance on the longer-term chart
Bearish Scenario:
A confirmed break and daily close below 9114 would weaken the bullish outlook and suggest deeper downside risk toward:
9085 – minor support
9045 – stronger support and potential demand zone
Outlook:
Bullish bias remains intact while the FTSE holds above 9114. A sustained break below this level could shift momentum to the downside in the short term.
This communication is for informational purposes only and should not be viewed as any form of recommendation as to a particular course of action or as investment advice. It is not intended as an offer or solicitation for the purchase or sale of any financial instrument or as an official confirmation of any transaction. Opinions, estimates and assumptions expressed herein are made as of the date of this communication and are subject to change without notice. This communication has been prepared based upon information, including market prices, data and other information, believed to be reliable; however, Trade Nation does not warrant its completeness or accuracy. All market prices and market data contained in or attached to this communication are indicative and subject to change without notice.

UK100 - potential head and shoulders on 1 hour chartWatching the UK100 for a potential short entry.
A head and shoulders pattern appears to be forming on the 1-hour chart. All my entry variables are currently met, but I’m holding off for now.
The UK100 will close in the next hour or two, and I prefer not to open a large position overnight due to potential slippage from market gaps. I’ll wait until tomorrow to see if my conditions are still valid before entering.
Trade Details:
📊 Risk/Reward: 3.5
🎯 Entry: 9 174.7
🛑 Stop Loss: 9 204.9
💰 Take Profit 1 (50%): 9 090.8
💰 Take Profit 2 (50%): 9 042.2
#GTradingMethod Tip: Always consider market timing and overnight risk when entering trades.
Thanks for checking out my post! Make sure to follow me to catch the next update. If you found this helpful, give it a like 👍 and share your thoughts 💬 — I’d love to hear what you think!
Please note: This is not financial advice. This content is to track my trading journey and for educational purposes only.

FTSE pullback to pivotal support at 9114The FTSE remains in a bullish trend, with recent price action showing signs of a corrective pullback within the broader uptrend.
Support Zone: 9114 – a key level from previous consolidation. Price is currently testing or approaching this level.
A bullish rebound from 9114 would confirm ongoing upside momentum, with potential targets at:
9235 – initial resistance
9260 – psychological and structural level
9284 – extended resistance on the longer-term chart
Bearish Scenario:
A confirmed break and daily close below 9114 would weaken the bullish outlook and suggest deeper downside risk toward:
9085 – minor support
9045 – stronger support and potential demand zone
Outlook:
Bullish bias remains intact while the FTSE holds above 9114. A sustained break below this level could shift momentum to the downside in the short term.
This communication is for informational purposes only and should not be viewed as any form of recommendation as to a particular course of action or as investment advice. It is not intended as an offer or solicitation for the purchase or sale of any financial instrument or as an official confirmation of any transaction. Opinions, estimates and assumptions expressed herein are made as of the date of this communication and are subject to change without notice. This communication has been prepared based upon information, including market prices, data and other information, believed to be reliable; however, Trade Nation does not warrant its completeness or accuracy. All market prices and market data contained in or attached to this communication are indicative and subject to change without notice.

UK100 H4 | Bullish bounce off overlap supportUK100 is falling towards the buy entry, which is an overlap support that is slightly above the 127.2% Fibonacci extension and the 38.2% Fibonacci retracemen,t and could bounce from this level to the upside.
Buy entry is at 9,047.56, which is an overlap support that is slightly above the 127.2% Fibonacci extension and the 38.2% Fibonacci retracement.
Stop loss is at 8,936.15, which is a multi swing low support.
Take profit is at 9,216.90, which is a swing high resistance.
High Risk Investment Warning
Trading Forex/CFDs on margin carries a high level of risk and may not be suitable for all investors. Leverage can work against you.
Stratos Markets Limited (tradu.com ):
CFDs are complex instruments and come with a high risk of losing money rapidly due to leverage. 65% of retail investor accounts lose money when trading CFDs with this provider. You should consider whether you understand how CFDs work and whether you can afford to take the high risk of losing your money.
Stratos Europe Ltd (tradu.com ):
CFDs are complex instruments and come with a high risk of losing money rapidly due to leverage. 66% of retail investor accounts lose money when trading CFDs with this provider. You should consider whether you understand how CFDs work and whether you can afford to take the high risk of losing your money.
Stratos Global LLC (tradu.com ):
Losses can exceed deposits.
Please be advised that the information presented on TradingView is provided to Tradu (‘Company’, ‘we’) by a third-party provider (‘TFA Global Pte Ltd’). Please be reminded that you are solely responsible for the trading decisions on your account. There is a very high degree of risk involved in trading. Any information and/or content is intended entirely for research, educational and informational purposes only and does not constitute investment or consultation advice or investment strategy. The information is not tailored to the investment needs of any specific person and therefore does not involve a consideration of any of the investment objectives, financial situation or needs of any viewer that may receive it. Kindly also note that past performance is not a reliable indicator of future results. Actual results may differ materially from those anticipated in forward-looking or past performance statements. We assume no liability as to the accuracy or completeness of any of the information and/or content provided herein and the Company cannot be held responsible for any omission, mistake nor for any loss or damage including without limitation to any loss of profit which may arise from reliance on any information supplied by TFA Global Pte Ltd.
The speaker(s) is neither an employee, agent nor representative of Tradu and is therefore acting independently. The opinions given are their own, constitute general market commentary, and do not constitute the opinion or advice of Tradu or any form of personal or investment advice. Tradu neither endorses nor guarantees offerings of third-party speakers, nor is Tradu responsible for the content, veracity or opinions of third-party speakers, presenters or participants.

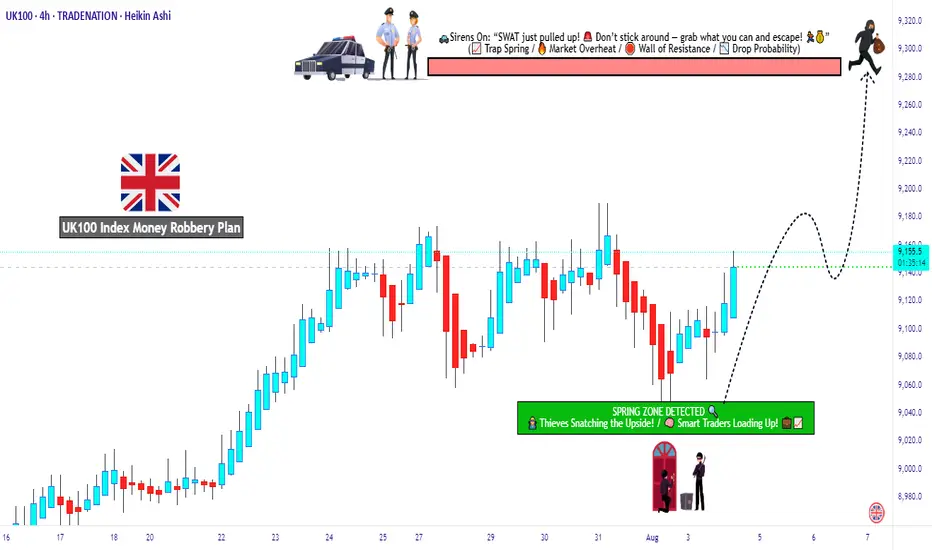
Is UK100 Setting Up the Cleanest Bull Robbery This Week?🏴☠️💹“UK100 Bullish Bank Job Heist 🧠💰” – Thief Trader Limit Order Operation 🚨📊
📢 Calling all stealthy traders, market pirates, and strategic looters! The vault is open, and the FTSE100 (UK100) index is now under our radar for a planned bullish extraction. This ain’t no regular trade — this is a Thief-Style Layered Entry Operation™.
🎯 Plan of Attack:
Asset: UK100 / FTSE100
Bias: Bullish
Entry: Any price level — we layer like legends (multiple limit orders across price zones)
Stop Loss: 9040.0 (vault protection level 🔐)
Target: 9280.0 (loot zone confirmed 🎯)
🧠 Thief Strategy Breakdown:
🔎 Why Bullish?
The setup is showing signs of accumulation + macro support, with strong risk-to-reward potential. Market exhaustion and liquidity traps are visible — it’s time to slip in quietly and stack long orders like a silent thief in the night.
📈 Execution Plan:
🔹 Use limit orders below current price (layer across price pockets)
🔹 DCA-style entries for better average and flexibility
🔹 Risk small, aim large
🔹 Always watch for market traps or surprise bear moves
🛡️ Stop-Loss Logic:
Below structure zones or 4H support – ~9040.0
Don't get greedy — protect the bag at all times.
🚪 Target the Escape:
Primary TP set at 9280.0
Optional: secure partials earlier using trailing SL once price breaks above 9200 zone.
📊 Trader Alerts:
⚠️ Avoid new positions during high-impact UK news
📅 Check for BOE surprises or global market shocks
🔁 Trail stops — don’t let profits vanish like a clumsy thief
📌 Notes from the Underground Vault:
🔐 This trade idea is based on market structure + liquidity flow
📌 Not financial advice — always rob with your own blueprint
💼 Trade light. Think sharp. Escape clean.
🔥 Join the Robbery Squad
Smash the idea boost 💥 if you're running this setup too.
💬 Drop a “HEIST LOADED” in the comments if you're in. Let’s loot this market the smart way — layered, patient, and untraceable. 🏴☠️💸
FTSE previous resistance retest? FTSE previous resistance retest?
The FTSE remains in a bullish trend, with recent price action showing signs of a corrective pullback within the broader uptrend.
Support Zone: 9114 – a key level from previous consolidation. Price is currently testing or approaching this level.
A bullish rebound from 9114 would confirm ongoing upside momentum, with potential targets at:
9235 – initial resistance
9260 – psychological and structural level
9284 – extended resistance on the longer-term chart
Bearish Scenario:
A confirmed break and daily close below 9114 would weaken the bullish outlook and suggest deeper downside risk toward:
9085 – minor support
9045 – stronger support and potential demand zone
Outlook:
Bullish bias remains intact while the FTSE holds above 9114. A sustained break below this level could shift momentum to the downside in the short term.
This communication is for informational purposes only and should not be viewed as any form of recommendation as to a particular course of action or as investment advice. It is not intended as an offer or solicitation for the purchase or sale of any financial instrument or as an official confirmation of any transaction. Opinions, estimates and assumptions expressed herein are made as of the date of this communication and are subject to change without notice. This communication has been prepared based upon information, including market prices, data and other information, believed to be reliable; however, Trade Nation does not warrant its completeness or accuracy. All market prices and market data contained in or attached to this communication are indicative and subject to change without notice.

FTSE poised to break to new highsThe stronger pound and weakness in crude oil prices have been among the reasons why we haven't seen a new high on the FTSE when US benchmark indices have hit new unchartered territories. But the underlying trend is bullish, and it looks like the UK index is coiling for a breakout, similar to that we saw in July.
Key short-term support that needs to hold now to support the bullish case is at 9127. Below that, 9100, 9050 and 9000 are the next short-term levels of support. Long-term support is between the shaded region on the chart at 8837-8910.
A new high above the current ATH of 9191 could see the index climb towards 9.5K in the coming weeks, with round handles like 9,200, 9,300 being interim profit-taking levels.
By Fawad Razaqzada, market analyst with FOREX.com

FTSE retesting resistance at 9185The FTSE remains in a bullish trend, with recent price action showing signs of a corrective sideways consolidation within the broader uptrend.
Support Zone: 9066 – a key level from previous consolidation. Price is currently testing or approaching this level.
A bullish rebound from would confirm ongoing upside momentum, with potential targets at:
9185 – initial resistance
9232 – psychological and structural level
9270 – extended resistance on the longer-term chart
Bearish Scenario:
A confirmed break and daily close below 9066 would weaken the bullish outlook and suggest deeper downside risk toward:
9023 – minor support
9000 – stronger support and potential demand zone
Outlook:
Bullish bias remains intact while the FTSE holds above 9066. A sustained break below this level could shift momentum to the downside in the short term.
This communication is for informational purposes only and should not be viewed as any form of recommendation as to a particular course of action or as investment advice. It is not intended as an offer or solicitation for the purchase or sale of any financial instrument or as an official confirmation of any transaction. Opinions, estimates and assumptions expressed herein are made as of the date of this communication and are subject to change without notice. This communication has been prepared based upon information, including market prices, data and other information, believed to be reliable; however, Trade Nation does not warrant its completeness or accuracy. All market prices and market data contained in or attached to this communication are indicative and subject to change without notice.

UK100 Will collapseAs we can see on this chart EIGHTCAP:UK100 is approaching a very critical area, as it stands, UK100 has put on a full garments of team Bearish. for more info, see the video. Sell UK100.

UK100 – Buying into Support with Anticipated ReboundTrade Idea
Type: Buy Limit
Entry: 9070
Target: 9178
Stop Loss: 9027
Duration: Intraday
Expires: 12/08/2025 06:00
Technical Overview
Price action is forming a bottom, suggesting potential bullish reversal.
Bias remains for higher levels, with dips expected to be limited.
Hourly chart indicates possible short-term downside before uptrend resumes.
Preferred approach is to fade into dips with a tight stop to capture the expected rebound.
Key Technical Levels
Resistance: 9290 / 9485 / 9770
Support: 8915 / 8620 / 8390
Disclosure: I am part of Trade Nation's Influencer program and receive a monthly fee for using their TradingView charts in my analysis.

FTSE100 key support at 9066The FTSE remains in a bullish trend, with recent price action showing signs of a corrective sideways consolidation within the broader uptrend.
Support Zone: 9066 – a key level from previous consolidation. Price is currently testing or approaching this level.
A bullish rebound from would confirm ongoing upside momentum, with potential targets at:
9185 – initial resistance
9232 – psychological and structural level
9270 – extended resistance on the longer-term chart
Bearish Scenario:
A confirmed break and daily close below 9066 would weaken the bullish outlook and suggest deeper downside risk toward:
9023 – minor support
9000 – stronger support and potential demand zone
Outlook:
Bullish bias remains intact while the FTSE holds above 9066. A sustained break below this level could shift momentum to the downside in the short term.
This communication is for informational purposes only and should not be viewed as any form of recommendation as to a particular course of action or as investment advice. It is not intended as an offer or solicitation for the purchase or sale of any financial instrument or as an official confirmation of any transaction. Opinions, estimates and assumptions expressed herein are made as of the date of this communication and are subject to change without notice. This communication has been prepared based upon information, including market prices, data and other information, believed to be reliable; however, Trade Nation does not warrant its completeness or accuracy. All market prices and market data contained in or attached to this communication are indicative and subject to change without notice.

FTSE bullish sideways consolidation capped at 9185The FTSE remains in a bullish trend, with recent price action showing signs of a corrective sideways consolidation within the broader uptrend.
Support Zone: 9066 – a key level from previous consolidation. Price is currently testing or approaching this level.
A bullish rebound from would confirm ongoing upside momentum, with potential targets at:
9185 – initial resistance
9232 – psychological and structural level
9270 – extended resistance on the longer-term chart
Bearish Scenario:
A confirmed break and daily close below 9066 would weaken the bullish outlook and suggest deeper downside risk toward:
9023 – minor support
9000 – stronger support and potential demand zone
Outlook:
Bullish bias remains intact while the FTSE holds above 9066. A sustained break below this level could shift momentum to the downside in the short term.
This communication is for informational purposes only and should not be viewed as any form of recommendation as to a particular course of action or as investment advice. It is not intended as an offer or solicitation for the purchase or sale of any financial instrument or as an official confirmation of any transaction. Opinions, estimates and assumptions expressed herein are made as of the date of this communication and are subject to change without notice. This communication has been prepared based upon information, including market prices, data and other information, believed to be reliable; however, Trade Nation does not warrant its completeness or accuracy. All market prices and market data contained in or attached to this communication are indicative and subject to change without notice.

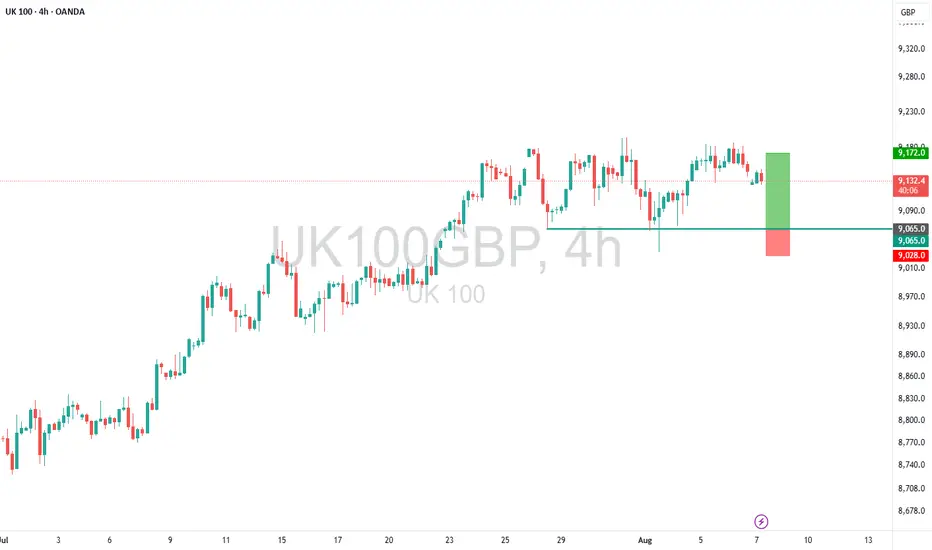
UK100 – Buy into Dip Ahead of BoE VolatilityTrade Idea
Type: Buy Limit
Entry: 9065
Target: 9172
Stop Loss: 9028
Duration: Intraday
Expires: 08/08/2025 06:00
Technical Overview
Price action appears to be forming a top, but short-term bias remains mildly bullish.
Lower correction is expected, presenting an opportunity to buy near bespoke support.
We prefer to fade into the dip with a tight stop, anticipating a resumption of the uptrend.
Bespoke support: 9065.
Key Technical Levels
Resistance: 9290 / 9485 / 9770
Support: 8915 / 8620 / 8390
Next Volatile Events (GBP)
12:00 – BoE Interest Rate Decision
12:00 – BoE Minutes / MPC Votes / Policy Summary & Report
12:30 – BoE's Governor Bailey Speech
Disclosure: I am part of Trade Nation's Influencer program and receive a monthly fee for using their TradingView charts in my analysis.
FTSE uptrend continuation rally resistance at 9185The FTSE remains in a bullish trend, with recent price action showing signs of a corrective sideways consolidation within the broader uptrend.
Support Zone: 9066 – a key level from previous consolidation. Price is currently testing or approaching this level.
A bullish rebound from would confirm ongoing upside momentum, with potential targets at:
9185 – initial resistance
9232 – psychological and structural level
9270 – extended resistance on the longer-term chart
Bearish Scenario:
A confirmed break and daily close below 9066 would weaken the bullish outlook and suggest deeper downside risk toward:
9023 – minor support
9000 – stronger support and potential demand zone
Outlook:
Bullish bias remains intact while the FTSE holds above 9066. A sustained break below this level could shift momentum to the downside in the short term.
This communication is for informational purposes only and should not be viewed as any form of recommendation as to a particular course of action or as investment advice. It is not intended as an offer or solicitation for the purchase or sale of any financial instrument or as an official confirmation of any transaction. Opinions, estimates and assumptions expressed herein are made as of the date of this communication and are subject to change without notice. This communication has been prepared based upon information, including market prices, data and other information, believed to be reliable; however, Trade Nation does not warrant its completeness or accuracy. All market prices and market data contained in or attached to this communication are indicative and subject to change without notice.

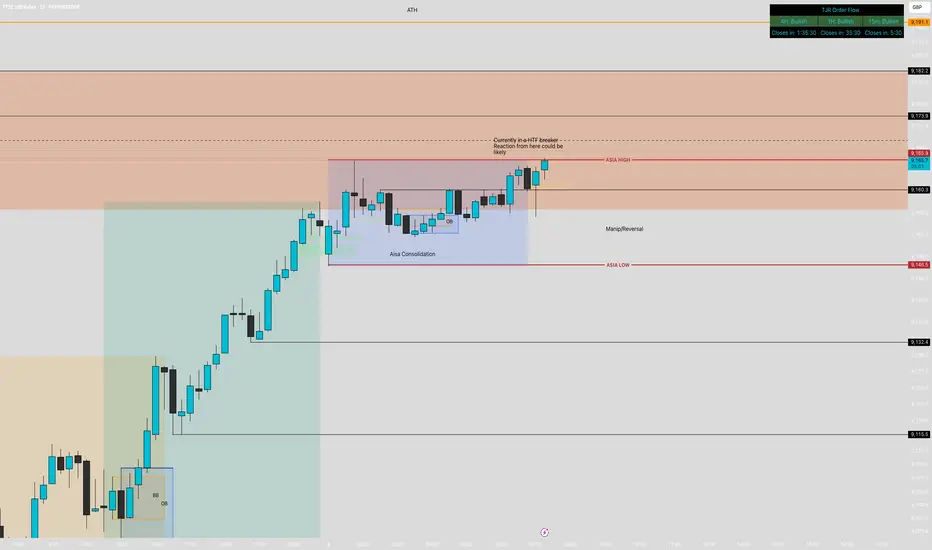
UK100 potential bearishCurrently in a HTF breaker and Order block.
Asia has consolidated for the whole session but seems to be sweeping the liquidity to the upside.
Waiting on a sweep to the upside with a break of structure to the down side. Plenty of liquidity to the downside to collect before we could see new ATH formed.
FTSE SHORTThere is an ABCD pattern on M30
All timeframes are overbought on RSI
There are multiple tops on all timeframes with divergence
Great resistance at this level
Stoploss above 9200

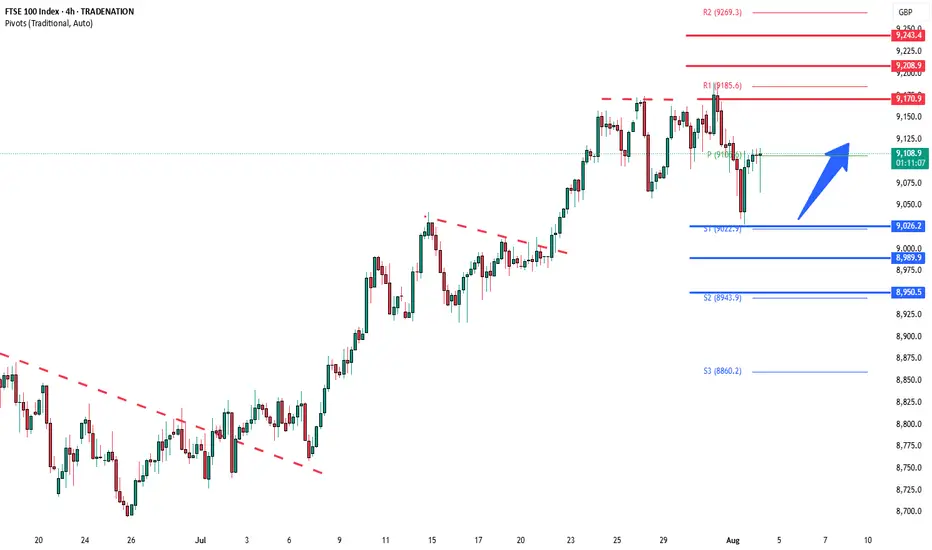
FTSE uptrend pause supported at 9026The FTSE remains in a bullish trend, with recent price action showing signs of a corrective pullback within the broader uptrend.
Support Zone: 9026 – a key level from previous consolidation. Price is currently testing or approaching this level.
A bullish rebound from 9026 would confirm ongoing upside momentum, with potential targets at:
9170 – initial resistance
9208 – psychological and structural level
9245 – extended resistance on the longer-term chart
Bearish Scenario:
A confirmed break and daily close below 9026 would weaken the bullish outlook and suggest deeper downside risk toward:
8990 – minor support
8950 – stronger support and potential demand zone
Outlook:
Bullish bias remains intact while the FTSE holds above 9026. A sustained break below this level could shift momentum to the downside in the short term.
This communication is for informational purposes only and should not be viewed as any form of recommendation as to a particular course of action or as investment advice. It is not intended as an offer or solicitation for the purchase or sale of any financial instrument or as an official confirmation of any transaction. Opinions, estimates and assumptions expressed herein are made as of the date of this communication and are subject to change without notice. This communication has been prepared based upon information, including market prices, data and other information, believed to be reliable; however, Trade Nation does not warrant its completeness or accuracy. All market prices and market data contained in or attached to this communication are indicative and subject to change without notice.
FTSE oversold bounce backThe FTSE remains in a bullish trend, with recent price action showing signs of a corrective pullback within the broader uptrend.
Support Zone: 9026 – a key level from previous consolidation. Price is currently testing or approaching this level.
A bullish rebound from 9026 would confirm ongoing upside momentum, with potential targets at:
9170 – initial resistance
9208 – psychological and structural level
9245 – extended resistance on the longer-term chart
Bearish Scenario:
A confirmed break and daily close below 9026 would weaken the bullish outlook and suggest deeper downside risk toward:
8990 – minor support
8950 – stronger support and potential demand zone
Outlook:
Bullish bias remains intact while the FTSE holds above 9026. A sustained break below this level could shift momentum to the downside in the short term.
This communication is for informational purposes only and should not be viewed as any form of recommendation as to a particular course of action or as investment advice. It is not intended as an offer or solicitation for the purchase or sale of any financial instrument or as an official confirmation of any transaction. Opinions, estimates and assumptions expressed herein are made as of the date of this communication and are subject to change without notice. This communication has been prepared based upon information, including market prices, data and other information, believed to be reliable; however, Trade Nation does not warrant its completeness or accuracy. All market prices and market data contained in or attached to this communication are indicative and subject to change without notice.
