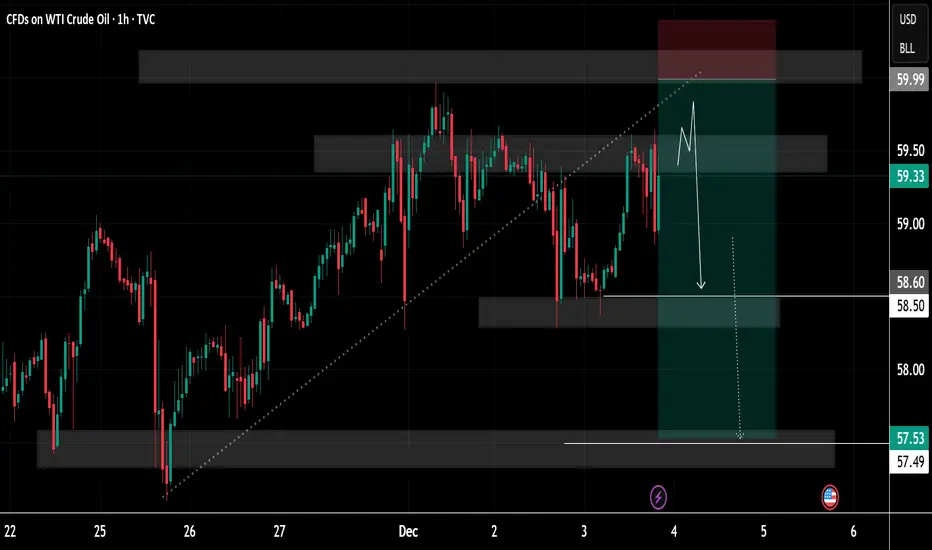
Oil Price Update – Clean & Clear ExplanationOil (1-hour timeframe) analysis focused on a potential sell (short) opportunity. Price is currently trading around 59.40, inside a marked supply zone where previous selling pressure has appeared.
A possible scenario is illustrated:
• Price may push slightly higher into the upper part of the suppl
About CFDs on WTI Crude Oil
Crude Oil is a naturally occurring liquid fossil fuel resulting from plants and animals buried underground and exposed to extreme heat and pressure. Crude oil is one of the most demanded commodities and prices have significantly increased in recent times. Two major benchmarks for pricing crude oil are the United States' WTI (West Texas Intermediate) and United Kingdom's Brent. The differences between WTI and Brent include not only price but oil type as well, with WTI producing crude oil with a different density and sulfur content. The demand for crude oil is dependent on global economic conditions as well as market speculation. Crude oil prices are commonly measured in USD. Although there have been discussions of replacing the USD with another trade currency for crude oil, no definitive actions have been taken.
OIL: The Bearish Movement Could Resume AgainOIL: The Bearish Movement Could Resume Again
OIL tested a strong resistance zone near 60. This area corresponds also with a strong structure zone and also a psychological price that pushed the price down several times.
OPEC continues to increase the OIL production so the odds are to go down again

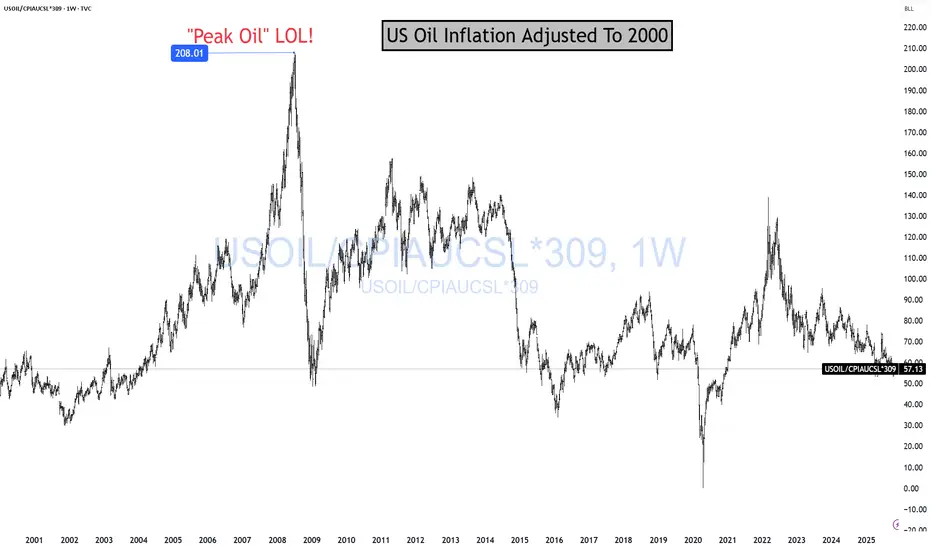
OIL Is Cheap For A ReasonOil is cheap because the global economy sucks! And it is "sucking" more and more every day. That's why Oil is on sale! Cheap! Cheap! And likely going to get more "cheap! cheap!" Me love you long time! Before I continue, story time.
In 2008, I could not convince anyone for the life of me that "PEAK
BIG Clue: USOIL Price Compressing Above ResistancePrice is currently compressing, and suggests that a strong impulsive move is likely once price strongly escapes the structure.
See how price has been pressing directly against the upper trendline. This is an area to pay close attention to because repeated tests of this descending resistance can wea
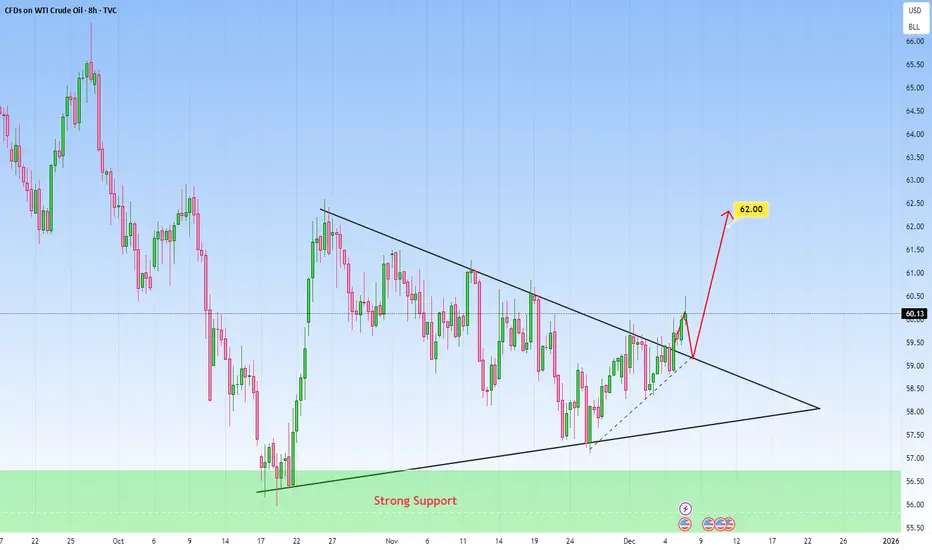
WTI Oil - Price Squeeze
Fundamental backdrop
Global supply continues to outpace demand: new data shows world oil output rising sharply while demand growth remains modest, pushing inventories up toward multi-year highs.
Still, recent geopolitical tensions — including strikes on Russian infrastructure — have kept a ris

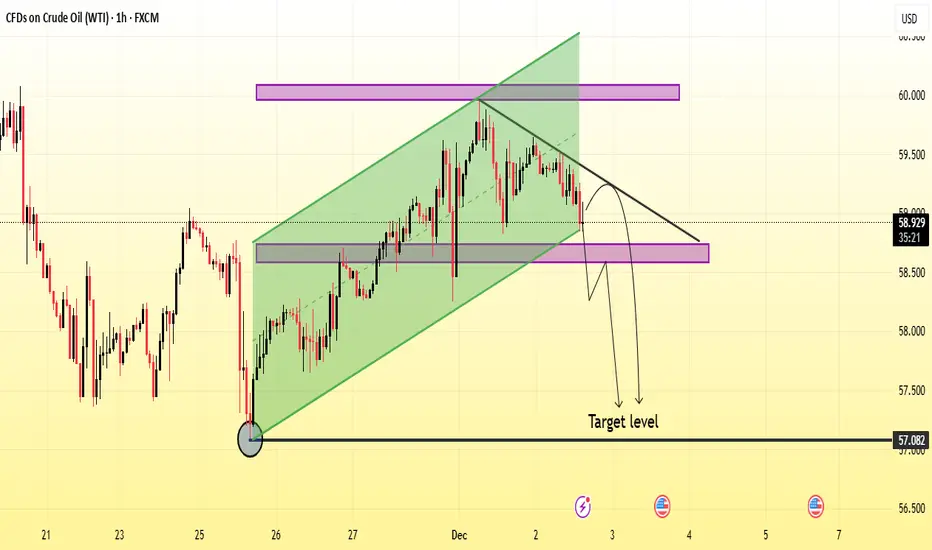
Usoil Next Selling Move Analysis Read the DescrpitionUSOIL with technical analysis drawn on it. A green rising channel highlights a previous uptrend, which has been broken downward. Pink horizontal zones mark resistance and support areas. A downward arrow points toward a labeled “Target level,” suggesting a bearish expectation after price breaks below
Bullish on USOILPrice broke consolidation, and retested marked arear now I'm in the buys back to supply, risk management at play (always) Lets see if this plays out
NB: Documenting my trades and learning in the process, this is not financial advise just another trader making her way to profitability

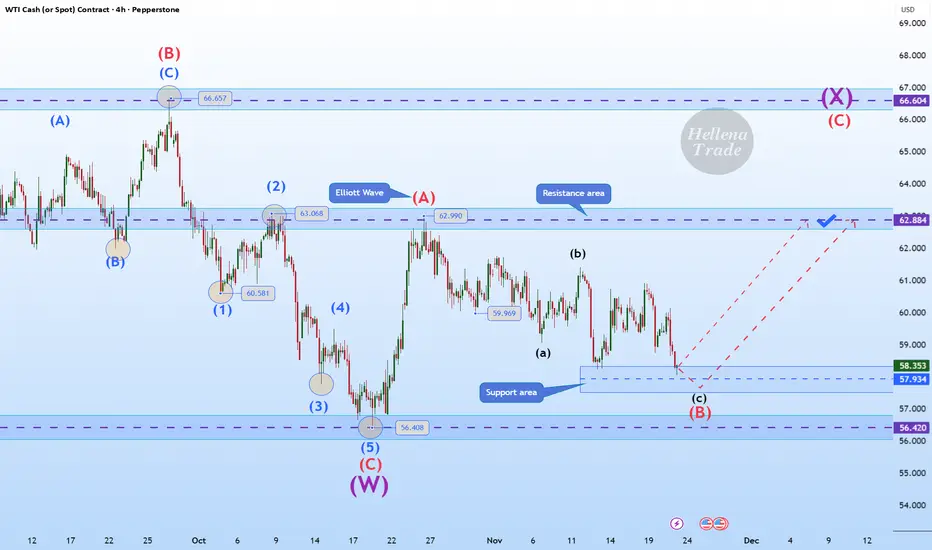
Hellena | Oil (4H): LONG to the area of the maximum of wave “A”.Colleagues, the past forecast has not been canceled, but I see some changes and therefore feel it is necessary to make a fresh forecast.
Apparently, the corrective wave “B” has extended to the area of 57.930. This is quite close to the low of wave “C” at 56.408 and the price should not update it, o
WTI OIL targeting at least $56.00 on the short-term.WTI Oil (USOIL) continues to expand its 4-month Channel Down and has repeatedly been rejected on its 1D MA50 (blue trend-line) in the past 40 days.
As mentioned before, this is similar to September's price action, which eventually tested the previous Support before breaking it and move to a new Low

Oil Market Outlook: Range-Bottom Reaction AheadHello traders,
Today I’m here with an analysis of Crude Oil.
Based on the chart, as you can see, the price is currently sitting on a support level.
Considering the global geopolitical situation and ongoing conflict news, we may see a potential rise in price.
Overall, we are looking at a sideways (r

See all ideas
Displays a symbol's price movements over previous years to identify recurring trends.