UKOIL H4 | Based on the H4 chart analysis, we could see the price fall to the buy entry which is a pullback support that aligns with the 50% Fibonacci retracement and could bounce from this levle to the upside.
Buy entry is at 68.47, which is a pullback support that aligns with the 50% Fibonacci retracement.
Stop loss is at 67.17, which is a pullback support that is slightly above the 78.6% Fibonacci retracement.
Take profit is at 70.53, which is a swing high resistance.
High Risk Investment Warning
Trading Forex/CFDs on margin carries a high level of risk and may not be suitable for all investors. Leverage can work against you.
Stratos Markets Limited (tradu.com ):
CFDs are complex instruments and come with a high risk of losing money rapidly due to leverage. 65% of retail investor accounts lose money when trading CFDs with this provider. You should consider whether you understand how CFDs work and whether you can afford to take the high risk of losing your money.
Stratos Europe Ltd (tradu.com ):
CFDs are complex instruments and come with a high risk of losing money rapidly due to leverage. 66% of retail investor accounts lose money when trading CFDs with this provider. You should consider whether you understand how CFDs work and whether you can afford to take the high risk of losing your money.
Stratos Global LLC (tradu.com ):
Losses can exceed deposits.
Please be advised that the information presented on TradingView is provided to Tradu (‘Company’, ‘we’) by a third-party provider (‘TFA Global Pte Ltd’). Please be reminded that you are solely responsible for the trading decisions on your account. There is a very high degree of risk involved in trading. Any information and/or content is intended entirely for research, educational and informational purposes only and does not constitute investment or consultation advice or investment strategy. The information is not tailored to the investment needs of any specific person and therefore does not involve a consideration of any of the investment objectives, financial situation or needs of any viewer that may receive it. Kindly also note that past performance is not a reliable indicator of future results. Actual results may differ materially from those anticipated in forward-looking or past performance statements. We assume no liability as to the accuracy or completeness of any of the information and/or content provided herein and the Company cannot be held responsible for any omission, mistake nor for any loss or damage including without limitation to any loss of profit which may arise from reliance on any information supplied by TFA Global Pte Ltd.
The speaker(s) is neither an employee, agent nor representative of Tradu and is therefore acting independently. The opinions given are their own, constitute general market commentary, and do not constitute the opinion or advice of Tradu or any form of personal or investment advice. Tradu neither endorses nor guarantees offerings of third-party speakers, nor is Tradu responsible for the content, veracity or opinions of third-party speakers, presenters or participants.
UKOUSDFT trade ideas

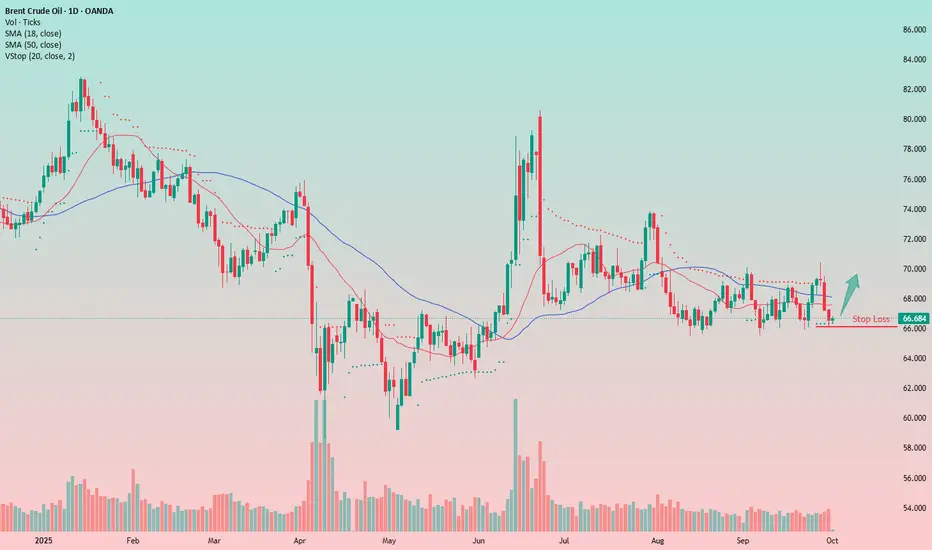
Oil Shows StrengthOil is trading fairly well.
There are chances for another move toward the $69.5–70 per barrel area.
Globally, the short-term trend is flat.
A tight stop-loss here allows entering with a solid position.
📝Trading Plan
🟢Entry: current level
🔴Stop: 66.10
🎯Target: 69.25 / 70

UKOILUkoil, in the short term, will be under bearish pressure from 63$ to 61$
65.5$ Breaks then retest and confirm
Now going to 62$

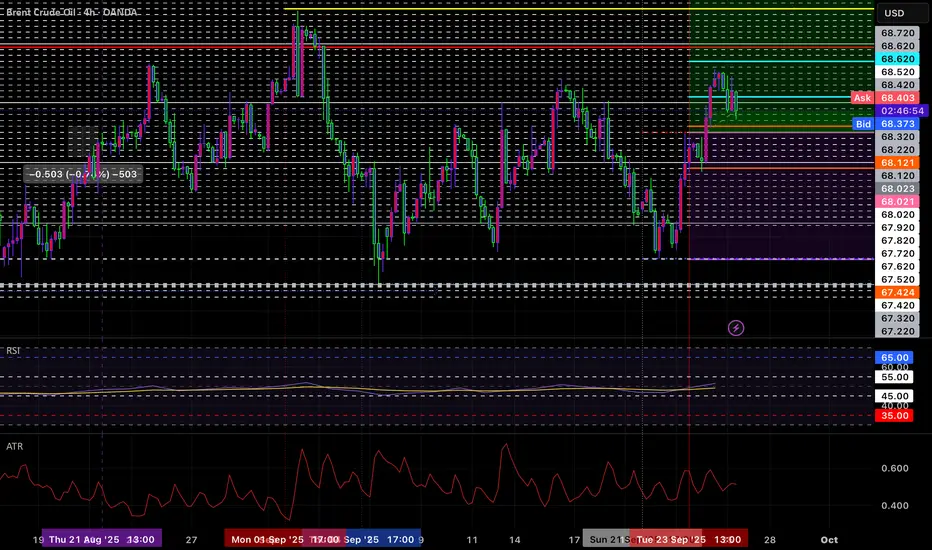
Just Beginning!Pending: Buy Limit
Entry: 67.424-68.121
SL: 65.930
TP: 70.124
TP: 73.816
FinalTP: 91.149
Please refer to my Trade Analysis Overbought NO where in sight for supporting reasoning.
Brent Crude Bearish sentiment continuation The Brent Crude Oil is currently trading with a bearish bias, aligned with the broader downward trend. Recent price action shows a retest of the resistance, suggesting a further selling pressure within the downtrend.
Key resistance is located at 6746, a prior consolidation zone. This level will be critical in determining the next directional move.
A bearish rejection from 6746 could confirm the resumption of the downtrend, targeting the next support levels at 6550, followed by 6500 and 6424 over a longer timeframe.
Conversely, a decisive breakout and daily close above 6746 would invalidate the current bearish setup, shifting sentiment to bullish and potentially triggering a move towards 6800, then 6874.
Conclusion:
The short-term outlook remains bearish unless the Brent Crude Oil breaks and holds above 6746. Traders should watch for price action signals around this key level to confirm direction. A rejection favours fresh downside continuation, while a breakout signals a potential trend reversal or deeper correction.
This communication is for informational purposes only and should not be viewed as any form of recommendation as to a particular course of action or as investment advice. It is not intended as an offer or solicitation for the purchase or sale of any financial instrument or as an official confirmation of any transaction. Opinions, estimates and assumptions expressed herein are made as of the date of this communication and are subject to change without notice. This communication has been prepared based upon information, including market prices, data and other information, believed to be reliable; however, Trade Nation does not warrant its completeness or accuracy. All market prices and market data contained in or attached to this communication are indicative and subject to change without notice.


UKOIL H4 | Bullish Reversal in PlayBased on the H4 chart analysis, we can see that the price has bounced off the entry, which is a pullback support that could potentially rise from this level to the upside.
Buy entry is at 65.58, which his a pullback support.
Stop loss is at 64.54, which aligns with the 127.2% Fibonacci extension.
Take profit is at 68.44, which his a pullback resistance that lines up with the 61.8% Fibonacci retracement.
High Risk Investment Warning
Trading Forex/CFDs on margin carries a high level of risk and may not be suitable for all investors. Leverage can work against you.
Stratos Markets Limited (tradu.com ):
CFDs are complex instruments and come with a high risk of losing money rapidly due to leverage. 65% of retail investor accounts lose money when trading CFDs with this provider. You should consider whether you understand how CFDs work and whether you can afford to take the high risk of losing your money.
Stratos Europe Ltd (tradu.com ):
CFDs are complex instruments and come with a high risk of losing money rapidly due to leverage. 66% of retail investor accounts lose money when trading CFDs with this provider. You should consider whether you understand how CFDs work and whether you can afford to take the high risk of losing your money.
Stratos Global LLC (tradu.com ):
Losses can exceed deposits.
Please be advised that the information presented on TradingView is provided to Tradu (‘Company’, ‘we’) by a third-party provider (‘TFA Global Pte Ltd’). Please be reminded that you are solely responsible for the trading decisions on your account. There is a very high degree of risk involved in trading. Any information and/or content is intended entirely for research, educational and informational purposes only and does not constitute investment or consultation advice or investment strategy. The information is not tailored to the investment needs of any specific person and therefore does not involve a consideration of any of the investment objectives, financial situation or needs of any viewer that may receive it. Kindly also note that past performance is not a reliable indicator of future results. Actual results may differ materially from those anticipated in forward-looking or past performance statements. We assume no liability as to the accuracy or completeness of any of the information and/or content provided herein and the Company cannot be held responsible for any omission, mistake nor for any loss or damage including without limitation to any loss of profit which may arise from reliance on any information supplied by TFA Global Pte Ltd.
The speaker(s) is neither an employee, agent nor representative of Tradu and is therefore acting independently. The opinions given are their own, constitute general market commentary, and do not constitute the opinion or advice of Tradu or any form of personal or investment advice. Tradu neither endorses nor guarantees offerings of third-party speakers, nor is Tradu responsible for the content, veracity or opinions of third-party speakers, presenters or participants.

Brent Crude another retest of resistance at 6900? The Brent Crude Oil is currently trading with a bearish bias, aligned with the broader downward trend. Recent price action shows a retest of the resistance, suggesting a further selling pressure within the downtrend.
Key resistance is located at 6900, a prior consolidation zone. This level will be critical in determining the next directional move.
A bearish rejection from 6900 could confirm the resumption of the downtrend, targeting the next support levels at 6720, followed by 6600 and 6480 over a longer timeframe.
Conversely, a decisive breakout and daily close above 6900 would invalidate the current bearish setup, shifting sentiment to bullish and potentially triggering a move towards 6975, then 7030.
Conclusion:
The short-term outlook remains bearish unless the Brent Crude Oil breaks and holds above 6900. Traders should watch for price action signals around this key level to confirm direction. A rejection favours fresh downside continuation, while a breakout signals a potential trend reversal or deeper correction.
This communication is for informational purposes only and should not be viewed as any form of recommendation as to a particular course of action or as investment advice. It is not intended as an offer or solicitation for the purchase or sale of any financial instrument or as an official confirmation of any transaction. Opinions, estimates and assumptions expressed herein are made as of the date of this communication and are subject to change without notice. This communication has been prepared based upon information, including market prices, data and other information, believed to be reliable; however, Trade Nation does not warrant its completeness or accuracy. All market prices and market data contained in or attached to this communication are indicative and subject to change without notice.

UKOIL H4 | Potential bearish dropUKOIL has rejected the sell entry which is a pullback resistance and could drop from this level to the downside.
Sell entry is at 66.770, which is a pullback resistance.
Stop loss is at 67.67, which is a pullback resistance.
Take profit is at 65.04, which is a multi swing low support.
High Risk Investment Warning
Trading Forex/CFDs on margin carries a high level of risk and may not be suitable for all investors. Leverage can work against you.
Stratos Markets Limited (tradu.com ):
CFDs are complex instruments and come with a high risk of losing money rapidly due to leverage. 65% of retail investor accounts lose money when trading CFDs with this provider. You should consider whether you understand how CFDs work and whether you can afford to take the high risk of losing your money.
Stratos Europe Ltd (tradu.com ):
CFDs are complex instruments and come with a high risk of losing money rapidly due to leverage. 66% of retail investor accounts lose money when trading CFDs with this provider. You should consider whether you understand how CFDs work and whether you can afford to take the high risk of losing your money.
Stratos Global LLC (tradu.com ):
Losses can exceed deposits.
Please be advised that the information presented on TradingView is provided to Tradu (‘Company’, ‘we’) by a third-party provider (‘TFA Global Pte Ltd’). Please be reminded that you are solely responsible for the trading decisions on your account. There is a very high degree of risk involved in trading. Any information and/or content is intended entirely for research, educational and informational purposes only and does not constitute investment or consultation advice or investment strategy. The information is not tailored to the investment needs of any specific person and therefore does not involve a consideration of any of the investment objectives, financial situation or needs of any viewer that may receive it. Kindly also note that past performance is not a reliable indicator of future results. Actual results may differ materially from those anticipated in forward-looking or past performance statements. We assume no liability as to the accuracy or completeness of any of the information and/or content provided herein and the Company cannot be held responsible for any omission, mistake nor for any loss or damage including without limitation to any loss of profit which may arise from reliance on any information supplied by TFA Global Pte Ltd.
The speaker(s) is neither an employee, agent nor representative of Tradu and is therefore acting independently. The opinions given are their own, constitute general market commentary, and do not constitute the opinion or advice of Tradu or any form of personal or investment advice. Tradu neither endorses nor guarantees offerings of third-party speakers, nor is Tradu responsible for the content, veracity or opinions of third-party speakers, presenters or participants.

Beyond the Chart - OIL Market Technical Analysis📉 Trade Idea CAPITALCOM:OIL_BRENT (Short Bias)
• Wait for price to retrace into the short FVG zone (around 66.60–66.70).
• Look for rejection signs (wick rejections / bearish engulfing / orderflow shift).
• Target the liquidity lows near 66.00 and possibly extend further if momentum stays bearish.
• Stop loss placement should be just above the FVG / recent high (~67.00).

Rising WedgeThe price has broken out of a rising wedge pattern, followed by a pullback and now the price looks to make a lower low, time to short
WE ONLY TRADE PULLBACKS
Comment your thoughts

UKOIL H1 | Potential Bearish Drop AheadBased on the H1 chart analysis, we could see the price rise to the sell entry, which is an overlap resistance that aligns with the 23.6% Fibonacci retracement and could reverse from his levle to the take profit.
Sell entry is at 65.70, which is an overlap resistance that aligns with the 23.6% Fibonacci retracement.
Stop loss is at 66.69, which is a pullback resistance that aligns with the 38.2% Fibonacci retracement.
Take profit is at 64.03, which is a pullback support.
High Risk Investment Warning
Trading Forex/CFDs on margin carries a high level of risk and may not be suitable for all investors. Leverage can work against you.
Stratos Markets Limited (tradu.com ):
CFDs are complex instruments and come with a high risk of losing money rapidly due to leverage. 65% of retail investor accounts lose money when trading CFDs with this provider. You should consider whether you understand how CFDs work and whether you can afford to take the high risk of losing your money.
Stratos Europe Ltd (tradu.com ):
CFDs are complex instruments and come with a high risk of losing money rapidly due to leverage. 66% of retail investor accounts lose money when trading CFDs with this provider. You should consider whether you understand how CFDs work and whether you can afford to take the high risk of losing your money.
Stratos Global LLC (tradu.com ):
Losses can exceed deposits.
Please be advised that the information presented on TradingView is provided to Tradu (‘Company’, ‘we’) by a third-party provider (‘TFA Global Pte Ltd’). Please be reminded that you are solely responsible for the trading decisions on your account. There is a very high degree of risk involved in trading. Any information and/or content is intended entirely for research, educational and informational purposes only and does not constitute investment or consultation advice or investment strategy. The information is not tailored to the investment needs of any specific person and therefore does not involve a consideration of any of the investment objectives, financial situation or needs of any viewer that may receive it. Kindly also note that past performance is not a reliable indicator of future results. Actual results may differ materially from those anticipated in forward-looking or past performance statements. We assume no liability as to the accuracy or completeness of any of the information and/or content provided herein and the Company cannot be held responsible for any omission, mistake nor for any loss or damage including without limitation to any loss of profit which may arise from reliance on any information supplied by TFA Global Pte Ltd.
The speaker(s) is neither an employee, agent nor representative of Tradu and is therefore acting independently. The opinions given are their own, constitute general market commentary, and do not constitute the opinion or advice of Tradu or any form of personal or investment advice. Tradu neither endorses nor guarantees offerings of third-party speakers, nor is Tradu responsible for the content, veracity or opinions of third-party speakers, presenters or participants.


XRBUSDThe Butterfly Harmonic pattern signals a strong bearish trend for XRBUSD,
starting at 70.3 USD.Eyes on potential targets: TP1 & TP2. 📉

What happens if oil prices rise?Brent Crude Oil 1W;
What happens if oil prices rise?
Inflation decreases.
What happens if inflation decreases?
All stock markets crash.
So when do oil prices rise in technical charts and fundamental analysis?
Let's take a look...
Developments in the Middle East become important when there is a supply shortage in oil. Although there are slight fluctuations at the moment, a permanent supply shortage is only possible if Iran permanently closes the Strait of Hormuz. Otherwise, the news only creates fluctuations as seen on the chart, but the trend direction is clear.
For now, the Saudis and OPEC members are filling the supply gaps in oil.
Technically speaking;
On the weekly chart, oil has maintained its downward trend since the summer of 2022. It retreated to the $60 level but is now in strong support zones. How much further it will fall from here depends entirely on political factors.
It appears to have found support at the 0.618 Fibonacci golden ratio level for now. If it breaks below this level, all the marked areas below will act as very strong support and could initially push the price upward.
If oil starts to show sustainability above $90, global inflation will begin to be felt deeply.
#oil #brent #petrol #technicalanalysis #fundamentalanalysis

BRENT BUYWe're interested in BUYING at the Demand Zone. We're targeting liquidity towards the upside.

WTI Crude support retest at 6200The WTI Crude Oil is currently trading with a bearish bias, aligned with the broader downward trend. Recent price action shows a retest of the resistance, suggesting a further selling pressure within the downtrend.
Key resistance is located at 6540, a prior consolidation zone. This level will be critical in determining the next directional move.
A bearish rejection from 6540 could confirm the resumption of the downtrend, targeting the next support levels at 6200, followed by 6070 and 6000 over a longer timeframe.
Conversely, a decisive breakout and daily close above 6540 would invalidate the current bearish setup, shifting sentiment to bullish and potentially triggering a move towards 6650, then 6830.
Conclusion:
The short-term outlook remains bearish unless WTI Crude breaks and holds above 6540. Traders should watch for price action signals around this key level to confirm direction. A rejection favours fresh downside continuation, while a breakout signals a potential trend reversal or deeper correction.
This communication is for informational purposes only and should not be viewed as any form of recommendation as to a particular course of action or as investment advice. It is not intended as an offer or solicitation for the purchase or sale of any financial instrument or as an official confirmation of any transaction. Opinions, estimates and assumptions expressed herein are made as of the date of this communication and are subject to change without notice. This communication has been prepared based upon information, including market prices, data and other information, believed to be reliable; however, Trade Nation does not warrant its completeness or accuracy. All market prices and market data contained in or attached to this communication are indicative and subject to change without notice.

UKOIL H4 | Bearish reversal off 50% Fibonacci resistanceBased on the H4 chart analysis, we could see the price rise to the sell entry, which is a pullback resistance that aligns with the 50% Fibonacci retracement and could reverse from this level to the downside.
Sell entry is at 67.65, which is a pullback resistance that aligns with the 50% Fibonacci retracement.
Stop loss is at 68.69, which is a swing high resistance level.
Take profit is at 65.78, which is a pullback support level.
High Risk Investment Warning
Trading Forex/CFDs on margin carries a high level of risk and may not be suitable for all investors. Leverage can work against you.
Stratos Markets Limited (tradu.com ):
CFDs are complex instruments and come with a high risk of losing money rapidly due to leverage. 65% of retail investor accounts lose money when trading CFDs with this provider. You should consider whether you understand how CFDs work and whether you can afford to take the high risk of losing your money.
Stratos Europe Ltd (tradu.com ):
CFDs are complex instruments and come with a high risk of losing money rapidly due to leverage. 66% of retail investor accounts lose money when trading CFDs with this provider. You should consider whether you understand how CFDs work and whether you can afford to take the high risk of losing your money.
Stratos Global LLC (tradu.com ):
Losses can exceed deposits.
Please be advised that the information presented on TradingView is provided to Tradu (‘Company’, ‘we’) by a third-party provider (‘TFA Global Pte Ltd’). Please be reminded that you are solely responsible for the trading decisions on your account. There is a very high degree of risk involved in trading. Any information and/or content is intended entirely for research, educational and informational purposes only and does not constitute investment or consultation advice or investment strategy. The information is not tailored to the investment needs of any specific person and therefore does not involve a consideration of any of the investment objectives, financial situation or needs of any viewer that may receive it. Kindly also note that past performance is not a reliable indicator of future results. Actual results may differ materially from those anticipated in forward-looking or past performance statements. We assume no liability as to the accuracy or completeness of any of the information and/or content provided herein and the Company cannot be held responsible for any omission, mistake nor for any loss or damage including without limitation to any loss of profit which may arise from reliance on any information supplied by TFA Global Pte Ltd.
The speaker(s) is neither an employee, agent nor representative of Tradu and is therefore acting independently. The opinions given are their own, constitute general market commentary, and do not constitute the opinion or advice of Tradu or any form of personal or investment advice. Tradu neither endorses nor guarantees offerings of third-party speakers, nor is Tradu responsible for the content, veracity or opinions of third-party speakers, presenters or participants.

Bren Crude upside resistance at 6900The Brent Crude Oil is currently trading with a bearish bias, aligned with the broader downward trend. Recent price action shows a retest of the resistance, suggesting a further selling pressure within the downtrend.
Key resistance is located at 6900, a prior consolidation zone. This level will be critical in determining the next directional move.
A bearish rejection from 6900 could confirm the resumption of the downtrend, targeting the next support levels at 6720, followed by 6600 and 6480 over a longer timeframe.
Conversely, a decisive breakout and daily close above 6900 would invalidate the current bearish setup, shifting sentiment to bullish and potentially triggering a move towards 6975, then 7030.
Conclusion:
The short-term outlook remains bearish unless the Brent Crude Oil breaks and holds above 6900. Traders should watch for price action signals around this key level to confirm direction. A rejection favours fresh downside continuation, while a breakout signals a potential trend reversal or deeper correction.
This communication is for informational purposes only and should not be viewed as any form of recommendation as to a particular course of action or as investment advice. It is not intended as an offer or solicitation for the purchase or sale of any financial instrument or as an official confirmation of any transaction. Opinions, estimates and assumptions expressed herein are made as of the date of this communication and are subject to change without notice. This communication has been prepared based upon information, including market prices, data and other information, believed to be reliable; however, Trade Nation does not warrant its completeness or accuracy. All market prices and market data contained in or attached to this communication are indicative and subject to change without notice.

Brent to FALL up to 62Key factors influencing the market:
Anticipation of the OPEC+ decision at this weekend’s meeting — a potential further increase in production could put additional pressure on prices.
Excess crude inventories in the U.S. — commercial stockpiles have grown, lowering demand expectations.
Weak economic backdrop — signs of cooling, especially in the U.S., are softening demand for energy
Demand/supply imbalance risks — despite the potential for lower prices, geopolitics and
demand from strategic reserves (e.g., China) could limit the downside

UKOIL H1 | Potential bearish dropBased on the H1 chart analysis, we can see that the price has reacted off the sell entry, which is a pullback resistance, and could drop from this level to the downside.
Sell entry is at 66.41, which is a pullback resistance.
Stop loss is at 67.10, which is a pullback resistance.
Take profit is at 65.09, which is a swing high support.
High Risk Investment Warning
Trading Forex/CFDs on margin carries a high level of risk and may not be suitable for all investors. Leverage can work against you.
Stratos Markets Limited (tradu.com ):
CFDs are complex instruments and come with a high risk of losing money rapidly due to leverage. 65% of retail investor accounts lose money when trading CFDs with this provider. You should consider whether you understand how CFDs work and whether you can afford to take the high risk of losing your money.
Stratos Europe Ltd (tradu.com ):
CFDs are complex instruments and come with a high risk of losing money rapidly due to leverage. 66% of retail investor accounts lose money when trading CFDs with this provider. You should consider whether you understand how CFDs work and whether you can afford to take the high risk of losing your money.
Stratos Global LLC (tradu.com ):
Losses can exceed deposits.
Please be advised that the information presented on TradingView is provided to Tradu (‘Company’, ‘we’) by a third-party provider (‘TFA Global Pte Ltd’). Please be reminded that you are solely responsible for the trading decisions on your account. There is a very high degree of risk involved in trading. Any information and/or content is intended entirely for research, educational and informational purposes only and does not constitute investment or consultation advice or investment strategy. The information is not tailored to the investment needs of any specific person and therefore does not involve a consideration of any of the investment objectives, financial situation or needs of any viewer that may receive it. Kindly also note that past performance is not a reliable indicator of future results. Actual results may differ materially from those anticipated in forward-looking or past performance statements. We assume no liability as to the accuracy or completeness of any of the information and/or content provided herein and the Company cannot be held responsible for any omission, mistake nor for any loss or damage including without limitation to any loss of profit which may arise from reliance on any information supplied by TFA Global Pte Ltd.
The speaker(s) is neither an employee, agent nor representative of Tradu and is therefore acting independently. The opinions given are their own, constitute general market commentary, and do not constitute the opinion or advice of Tradu or any form of personal or investment advice. Tradu neither endorses nor guarantees offerings of third-party speakers, nor is Tradu responsible for the content, veracity or opinions of third-party speakers, presenters or participants.

Oil Prices Rise on Geopolitical FactorsOil Prices Rise on Geopolitical Factors
As the XBR/USD chart shows, Brent crude opened this week’s trading around $65.70, but today the price is near $66.80 (around +1.7%).
Oil is being pushed higher by geopolitical factors, including:
→ Israel’s strike on Hamas leadership in Qatar;
→ Trump’s calls for Europe to impose tariffs on buyers of Russian oil.
It is also worth noting that over the weekend an OPEC+ meeting took place. Although the decision was made to increase production, the volumes were smaller than analysts had expected.
Technical Analysis of the XBR/USD Chart
After the surge of extreme volatility at the end of July, Brent crude price fluctuations have been forming a descending channel (shown in red), with the following developments:
→ in September the price tested the lines dividing the channel into quarters (2 September – QH test, 5 September – QL test);
→ this week’s rise in oil looks like a return to the median, where supply and demand tend to balance out (in other words, where market participants more often agree on a fair price).
From a bullish perspective:
→ the $65.00 level appears to be an important support, having already proved its strength in August and September;
→ the sequence of higher highs and lows A→B→C→D→E suggests that pullbacks have been roughly half the size of bullish impulses – a sign of strong demand.
From a bearish perspective:
→ August price action suggests that a bear flag has formed as an interim correction within the prevailing downtrend;
→ the $67.50 level may act as strong resistance, as supply forces there were able to trigger a bearish breakout of the pattern.
Taking the above into account, we could assume that Brent prices may stabilise around the median in the short term, before sliding along it downwards – unless the balance of supply and demand shifts sharply (for example, under the influence of new geopolitical factors or the release of major economic indicators).
This article represents the opinion of the Companies operating under the FXOpen brand only. It is not to be construed as an offer, solicitation, or recommendation with respect to products and services provided by the Companies operating under the FXOpen brand, nor is it to be considered financial advice.
