Trade ideas

SPX into Monday 17th NovemeberPrice rcoiling into resistance after a sell off that got a tad oversold.Lets see if the bulls have some power.?

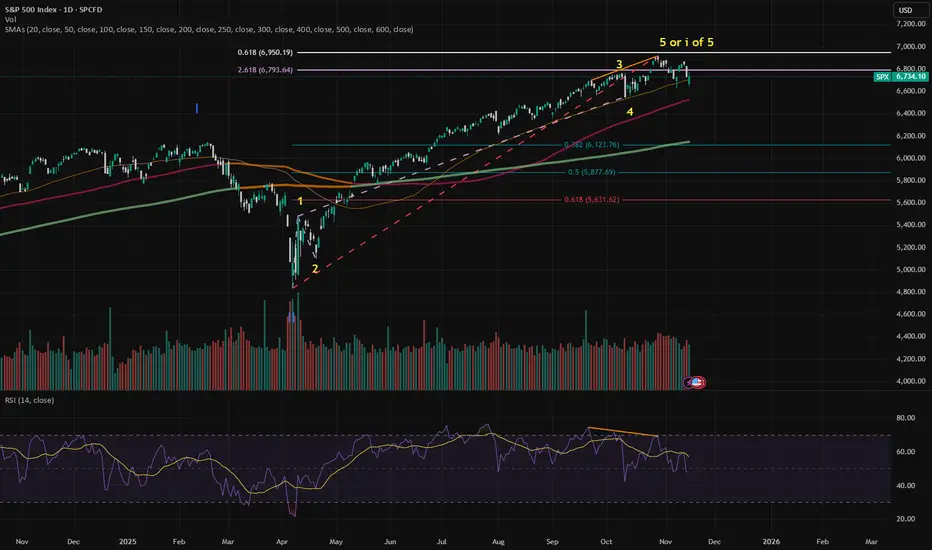
SPX: Makes equities affordable againThe previous week was quite an interesting one on equity markets. A lot of swing movements, but the general trend was toward the downside, or a general correction. The weekly peak of the S&P 500 was at the level of 6.870, but the next two days were traded with a huge market correction. Futures on Friday were traded with a significant discount, when the market opened at 6.648. The dip buyers immediately stepped on the market, and managed to push the index toward the higher grounds, where the index closed the week at 6.734. Many analysts are questioning whether this Friday's move was pointing to the reverse of investors sentiment, or was it just a short term correction to the upside?
The week started with an interesting news that the SoftBank Group has sold its entire stake in Nvidia Corporation for around $5,8B, with aim to transfer these funds in AI investments, including OpenAI. Amazon shares jumped after it struck a $38 billion deal with OpenAI to provide AWS capacity, signalling strong demand for AI infrastructure. Apple reported strong earnings, with its services business growing significantly, helping it stay resilient even amid broader market worries.
Based on the previous week's market movements, it could be noted that broad-based profit-taking hit big tech as investors expressed renewed valuation concerns on AI-focused companies, with Nvidia, Microsoft, AMD, and others seeing notable declines. Meanwhile, analysts are closely watching capital-expenditure plans from major companies as these will test whether the current AI-driven rally is sustainable.

S&P500 H1 | Bearish Reaction off Key ResistanceMomentum: Bearish
Price is currently below the ichimoku cloud.
Sell entry: 6,839.11
- Strong pullback resistance
- 78.6% Fib retracement
- 161.8% Fib extension
Stop Loss: 6,881.31
- Swing high resistance
Take Profit: 6,770.32
- Pullback support
High Risk Investment Warning
Stratos Markets Limited (tradu.com/uk ), Stratos Europe Ltd (tradu.com/eu ):
CFDs are complex instruments and come with a high risk of losing money rapidly due to leverage. 70% of retail investor accounts lose money when trading CFDs with this provider. You should consider whether you understand how CFDs work and whether you can afford to take the high risk of losing your money.
Stratos Global LLC (tradu.com/en ): Losses can exceed deposits.
Please be advised that the information presented on TradingView is provided to Tradu (‘Company’, ‘we’) by a third-party provider (‘TFA Global Pte Ltd’). Please be reminded that you are solely responsible for the trading decisions on your account. Any information and/or content is intended entirely for research, educational and informational purposes only and does not constitute investment or consultation advice or investment strategy. The information is not tailored to the investment needs of any specific person and therefore does not involve a consideration of any of the investment objectives, financial situation or needs of any viewer that may receive it. Past performance is not a reliable indicator of future results. Actual results may differ materially from those anticipated in forward-looking or past performance statements. We assume no liability as to the accuracy or completeness of any of the information and/or content provided herein and the Company cannot be held responsible for any omission, mistake nor for any loss or damage including without limitation to any loss of profit which may arise from reliance on any information supplied by TFA Global Pte Ltd.

US500 slipped on AI-bubble fears and the Hawkish Fed
Stocks weakened last week as the Fed’s revived hawkish tone and mounting concerns over stretched AI valuations outweighed strong earnings from major AI names.
Despite upbeat 3Q results, fears of an AI bubble continued to build. AMD CEO Su highlighted insatiable demand for AI chips, projecting the data-center market to reach 1tln USD by 2030 and forecasting an average annual growth rate of 35% for AMD over the next five years.
Morgan Stanley warned of an impending power shortage within a year as AI expansion accelerates. while Microsoft CEO Nadella pointed out that the biggest bottleneck is not compute capacity but power, noting that parts of the company’s GPU inventory lack sufficient power connectivity.
US500 briefly retested the support at 6650 before rebounding. EMA21 has death-crossed EMA78, indicating a potential shift toward a bearish structure.
If US500 fails to close above the support at 6700, the index could retreat toward 6650. Conversely, if US500 breaches above both EMAs and the resistance at 6800, the index may advance toward the following resistance at 6920.

The U.S.–China Trade War1. Background: Why the Trade War Started
a. Massive Trade Imbalance
For decades, the United States imported far more goods from China than it exported. By 2017, the U.S. trade deficit with China exceeded $375 billion, which American policymakers viewed as evidence of unfair trading practices.
b. Intellectual Property (IP) Theft and Technology Transfer
U.S. companies complained that China forced foreign firms to share technology in exchange for market access. Additionally, the U.S. accused China of:
Stealing intellectual property through cyber intrusions
Subsidizing state-owned enterprises with cheap credit
Dumping low-cost goods in global markets
These practices, according to the U.S., distorted global competition.
c. China’s Rise as a Technological Power
China’s “Made in China 2025” strategy aimed to dominate high-tech industries such as robotics, AI, aerospace, and semiconductors. The U.S. viewed this as a threat to its long-term technological leadership.
d. National Security Concerns
American officials argued that Chinese tech companies like Huawei could pose espionage threats. The trade war soon blended with a tech war and a strategic rivalry.
2. The Escalation Phase: Tariffs and Counter-Tariffs
a. Initial U.S. Tariffs (2018)
The U.S. imposed tariffs on $50 billion worth of Chinese goods, targeting machinery, electronics, and industrial components. China responded with tariffs on American agricultural products like soybeans, pork, and dairy.
b. Expansion to Consumer Goods
As tensions escalated, the U.S. placed tariffs on an additional $200 billion worth of Chinese goods, including consumer items such as:
Furniture
Electronics
Clothing
Household items
China retaliated with tariffs on $60 billion of U.S. goods.
c. Final Wave and “Phase One Deal”
By late 2019, almost two-thirds of U.S.–China trade was under tariffs. In January 2020, both countries signed the Phase One Agreement, where China agreed to purchase more American goods and strengthen intellectual property protection. However, the deal did not address deeper structural issues.
3. Beyond Tariffs: The Technology and Investment War
a. Restrictions on Chinese Tech Firms
The U.S. restricted Huawei, ZTE, and other Chinese companies from accessing:
U.S. semiconductor technology
5G infrastructure equipment
Key software like Google services for Android
Huawei was placed on the “Entity List,” preventing American firms from supplying critical components.
b. Semiconductor War
Semiconductor technology became the center of conflict. The U.S. banned China from acquiring advanced chips and restricted chip manufacturing equipment from being exported to Chinese firms. This was aimed at slowing China’s progress in AI, quantum computing, and advanced communications.
c. Investment Restrictions
Both countries tightened rules on foreign investment:
The U.S. restricted Chinese investments in critical technologies.
China increased control over foreign companies through cybersecurity and data-security laws.
This created a decoupling of financial and technological systems.
4. Impact on China
a. Economic Slowdown
China’s export-led growth model faced challenges. Although China remained a major global exporter, companies diversified supply chains away from China toward countries like:
Vietnam
India
Bangladesh
Mexico
b. Pressure on Manufacturing and Technology
Restrictions on semiconductors severely affected high-tech sectors. China accelerated self-reliance strategies by investing heavily in domestic chip production and R&D.
c. Weakening Consumer Confidence and Capital Outflows
Uncertainty caused foreign investors to move capital out of China, affecting markets, real estate, and currency stability.
5. Impact on the United States
a. Higher Costs for Consumers
Tariffs on Chinese goods raised prices for U.S. households. Since many consumer electronics, clothing items, and household goods came from China, Americans faced higher inflationary pressure.
b. Pain for U.S. Farmers
China’s tariffs on American soybeans and agricultural products hit U.S. farmers hard. The U.S. government provided billions of dollars in subsidies to offset losses.
c. Supply Chain Disruptions
U.S. companies relying on Chinese manufacturing—such as Apple, automakers, and retail brands—faced rising production costs and logistical complexities.
d. Push for Manufacturing Reshoring
The U.S. government increased incentives to bring manufacturing back home or shift it to allied countries like Mexico, India, and Vietnam.
6. Global Impact: Redefining Global Supply Chains
a. Rise of “China+1” Strategy
Companies worldwide began reducing dependence on China by diversifying production. India, Vietnam, and Southeast Asia gained momentum as alternatives.
b. Fragmentation of Global Trade
The world economy became more regionalized:
U.S.-led trade blocs (USMCA, Indo-Pacific Economic Framework)
China-led initiatives (RCEP, Belt and Road Initiative)
c. Impact on Emerging Markets
Some countries benefited from shifting supply chains, while others faced instability due to global uncertainty.
d. Inflation and Global Slowdown
Tariffs increased global costs, contributing to inflation across multiple sectors such as electronics, textiles, and consumer goods.
7. Strategic Competition: Trade War → Tech War → Cold War 2.0
The conflict has transformed into a broader geopolitical rivalry. It now includes:
AI competition
Military modernization
Spy balloon and cyber espionage disputes
Competing global standards
Tech alliances and sanctions
Both nations are preparing for long-term strategic competition.
8. Current Status and Future Outlook
a. Tariffs Largely Remain
Despite leadership changes in the U.S., most tariffs are still in place.
b. De-risking, Not Full Decoupling
The world is moving toward reducing reliance on China without a complete separation.
c. Semiconductor restrictions will intensify
The chip war is expected to become the central battlefield for technological dominance.
d. Global trade order is shifting
The WTO’s influence is weakening as bilateral trade battles rise.
e. Possibility of Future Negotiations
Although tensions are high, economic interdependence means negotiations remain possible.
Conclusion
The U.S.–China trade war is far more than a dispute over tariffs. It is a historic economic and geopolitical struggle that reflects a deeper rivalry between the world’s two largest powers. What began as a disagreement over trade imbalances and intellectual property has expanded into technology, security, and global influence. Its ripple effects have transformed global supply chains, increased geopolitical divisions, and ushered in a new era of strategic competition. As both countries continue to assert their economic and technological ambitions, the trade war is likely to remain a defining feature of international relations for years to come.

S&P 500 Technical & Fundamental Outlook — Week of Nov 17–21 2025S&P 500 – 1H Technical Breakdown
Price is sitting inside a well-defined symmetrical wedge, created by a series of lower highs pressing down from above and higher lows building from below. The market has been tightening for several sessions, and it’s now approaching the point where volatility usually picks up.
Immediate resistance:
6,793 (intraday pivot)
6,845–6,860 (previous supply zone)
6,922 (major level above the wedge)
Key support:
6,705–6,675 (rising trendline support)
6,600
6,550 (broad structural support below)
The recent rejection off the upper trendline shows sellers are still defending that zone, but buyers continue to step in at higher lows. The structure is neutral overall, but it’s clearly coiling for a directional move.
Upside needs:
A clean break above the descending trendline and a push over 6,793 would open the door toward 6,845, with room toward 6,922 if momentum follows through.
Downside needs:
A breakdown under the rising support and a close below 6,675 exposes 6,600, with 6,550 as the next major area below.
Until one of those levels gives way, it’s just tightening inside the wedge.
S&P 500 – Fundamental Summary
The market spent most of the week stuck between mixed macro signals, Fed uncertainty, and a sharp rotation out of the AI/tech trade. Stocks initially bounced early in the week, but momentum faded after several Fed officials pushed back against expectations for a December rate cut. The government shutdown ending helped sentiment, but the delay in economic data releases kept visibility low and added to the hesitation.
Tech was the clear weak spot. A post from Michael Burry questioning hyperscaler spending, depreciation assumptions, and AI valuations triggered more profit-taking in the sector. His criticism—paired with his Palantir short—sparked debate and pulled money out of AI names for a second straight week. As tech cooled, leadership shifted toward defensive and value sectors like healthcare, staples, materials, and energy.
Looking ahead, Nvidia’s earnings on Wednesday are the biggest single catalyst. The market is treating it as a referendum on the entire AI theme: a strong report could reignite the trade, while weak guidance could deepen the recent rotation.
Outlook for Next Week
Major indices (SPX, COMP, NDX, SOX) are all testing their 50-day moving averages, and so far those levels are holding. That puts the market in position for a potential rebound early next week, especially given positive seasonality into late November and year-end performance chasing from fund managers.
One red flag: the VIX is elevated near 20 and not responding to Friday’s rebound. That kind of volatility behavior sometimes precedes another leg down.
House view:
Moderately bullish into the first half of next week as long as the indices hold above their 50-day moving averages. Nvidia’s results remain the wild card. A strong NVDA print likely sparks an AI rebound; a weak one likely drags the entire market lower.
Key Catalysts to Watch
1. Economic Data (finally resuming after shutdown delays)
Empire State Manufacturing
Industrial Production, Capacity Utilization
Housing Starts, Building Permits
Philly Fed Index
Jobless Claims
Michigan Consumer Sentiment
Delayed CPI and PPI reports should hit in early/mid-December.
2. Earnings
Major reports:
Nvidia (NVDA) – biggest market driver of the week
Home Depot (HD), Target (TGT), Walmart (WMT) – consumer spending
Palo Alto (PANW), Baidu (BIDU), PDD, NIO, TJX, XPeng, Intuit, Ross Stores
Retail earnings will give deeper insight into demand and holiday spending.
3. The Fed & Rates
Fed speakers turned notably more hawkish:
Mary Daly called a December cut “premature”
Raphael Bostic stressed inflation risk over labor softness
Susan Collins expects rates to stay steady “for some time”
As a result:
December rate-cut odds fell from 66% → 41%
Treasury yields ticked higher
The bond market is reassessing how much easing is realistic in 2025–2026
GDPNow remains strong at 4.0%, but the shutdown likely dents Q4 numbers.
Market Themes to Watch
Tech Rotation
High valuations + Burry commentary + earnings uncertainty = cooling off in tech and AI names.
AI Inflection Point
Nvidia will likely determine whether the recent pullback becomes:
A buying opportunity
or
The start of a deeper correction in the AI trade
Breadth Concerns
Fewer stocks are trading above their 50-day average—classic sign of a tiring rally.
Seasonality
Late November into December is historically strong, and funds that are underperforming may chase performance if NVDA reignites momentum.
Bottom Line
The market is at a pivotal spot:
Technical support is holding (50-day MAs).
Fundamentals are mixed but leaning positive if Nvidia delivers.
VIX is a risk factor that can’t be ignored.
If NVDA beats → risk-on, AI rebound, SPX likely pushes higher.
If NVDA disappoints → tech drags lower, SPX likely breaks support levels.

SPX: Channel Break Failure? Eyeing ShortsSPX briefly tagged above the upper channel but closed back inside the broader monthly structure. Watching for the channel to hold, a possible minor retest higher, and then downside continuation if the levels and trendlines confirm.

S&P Comparison With October 2021 PeakThe yellow bars are cloned from S&P’s move starting from October 2021 which ended with a peak followed by a long downtrend. The patter seems almost identical. Let’s see if it will make the same move that I’ve also added. Rsi and Macd show negative divergences. Don’t forget to look at the weekly and monthly charts as well to see a better vision forward.

$SPX and QQQ have completed 5 wavesSP:SPX and NASDAQ:QQQ charts concern me. They have completed 5 waves. The question is if the 5th is extending. If it is extending, then we've completed i of 5 and in ii of 5.
ii of 5 right now is a flat.
Wave 3 is just short of 2.681% of Wave 1 and Wave 5 (or i of 5) is just short of 0.618% of Wave 1, all acceptable ratios for those waves.
If Wave 5 is not extending, then we're in the early stage of a correction to at least 38.2% (6123 or 200 DMA retracement), possibly 50% retracement (5877) .
There is negative divergence on RSI -- lower highs while the index made higher highs.
If the indices enter into a 10-20% correction, BTC is probably going to $75K or lower.
$SPX The trend remain up, but it's crucial to stay alert!SPX: Analyzing the weekly chart, at first glance, it seems that everything is under control. However, since the formation of the doji three weeks ago, the SPX has lost upward momentum, despite Friday's attempt with a positive opening that failed to consolidate by the close of trading.
It's clear that the 10-week simple moving average is on the market's radar and is currently holding. We can also draw a blue oblique support line; however, last week's doji is signalling uncertainty in the market, in addition to having closed below the horizontal support level at 6754.
Meanwhile, the MACD is about to issue a sell signal. For now, the SPX remains fine, but it needs to hold firm; otherwise, it might need to test the strength of the next support level, located at 6550, where the 20-week simple moving average will also be found next week.
The stakes are high!

Topping Signal?To me this looks like Wave 5 of the Elliott Wave supercycle in the stock market. We had a monster rally since the liberation day dump, now we are coming up against some strong resistance.
Should we be concerned? So far I have taken a lot of chips of the table. I am still very much long, we don't fight the tape, but if you haven't already started booking profits; have a good hard think about how much higher we could go from here.
The government shutdown will start to filter through the earnings reports next earnings season, especially if it persists over a month. Consumer stocks are showing weakness, whilst the AI trade continue to go vertical, but it will not go on forever - something will eventually give.
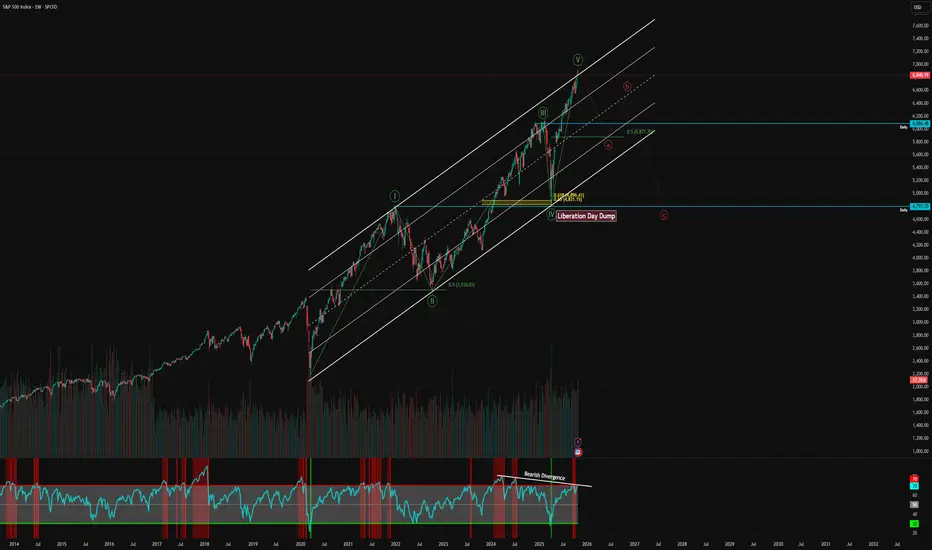
Larger Drop Incoming?The move up since the liberation day dump has been epic. I called the low on the markets at the time. I was long AppLovin, AMD, Reddit, Arm, Alab, REMX, amongst many other names that far outperformed the market. I warned you about the imminent dump before it happened, and then took positions on the long side as the market capitulated and we hit the golden ratio.
Now it's time to zoom out and remind you that this will not grind up forever. My interpretation of the chart is the move is nearing the end, the risk of strong downside move (7-12% drop) is increasing significantly and greed will catch many people out.
The inverse head and shoulders pattern is almost complete, we are grinding up in this channel and will start to come up against the resistance over these coming days/weeks. I had an upside target of 7000-7250 and we are almost there. The dips are getting brought up, so bulls may have more time to make gains but I am not convinced that the gains are worth the risk at this stage.
I will start taking some chips off the table here. Not financial advice, do what's best for you.

sp500🔹 Overall Outlook and Potential Price Movements
In the charts above, we have outlined the overall outlook and possible price movement paths.
As shown, each analysis highlights a key support or resistance zone near the current market price. The market’s reaction to these zones — whether a breakout or rejection — will likely determine the next direction of the price toward the specified levels.
⚠️ Important Note:
The purpose of these trading perspectives is to identify key upcoming price levels and assess potential market reactions. The provided analyses are not trading signals in any way.
✅ Recommendation for Use:
To make effective use of these analyses, it is advised to manually draw the marked zones on your chart. Then, on the 15-minute time frame, monitor the candlestick behavior and look for valid entry triggers before making any trading decisions.

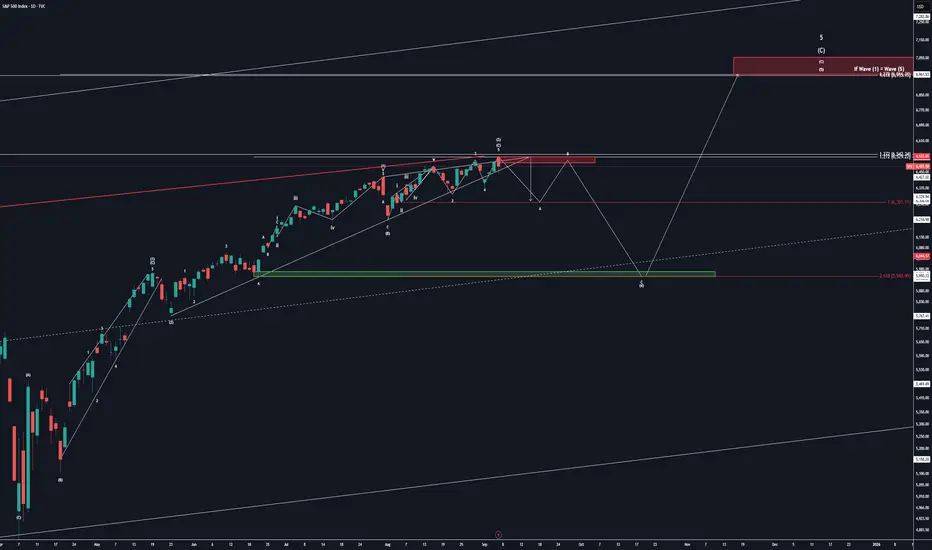
SPX 1D Close Up Corrective to (4) and finishing the year STRONG!Based on this count I believe that the markets will begin to go corrective starting this next week into October and finishing the year at higher highs. As always trade responsibly and wait for your confirmation bias (whatever that might be)...
SPXMaybe another bump.
Based on market sentiment, catastrophe is not yet...
Before a ledge, the market must be complacent...
As far as I can tell, right now, it's fear.

SPX500USD could still go upHi traders,
Last week SPX500USD went up and down and on Friday evening it started an impulsive move up again.
The pattern could be an ending diagonal (wave 5) or an (orange) wave 4 Triangle (both exist of internal three waves).
So next week we could see more (corrective or impulsive) upside for this pair.
Let's see what the market does and react.
Trade idea: Wait for a small correction down on a lower timeframe. After a change in orderflow to bullish you could trade longs.
This shared post is only my point of view on what could be the next move in this pair based on my technical analysis.
But I react and trade on what I see in the chart, not what I've predicted or expect.
Don't be emotional, just trade your plan!
Eduwave

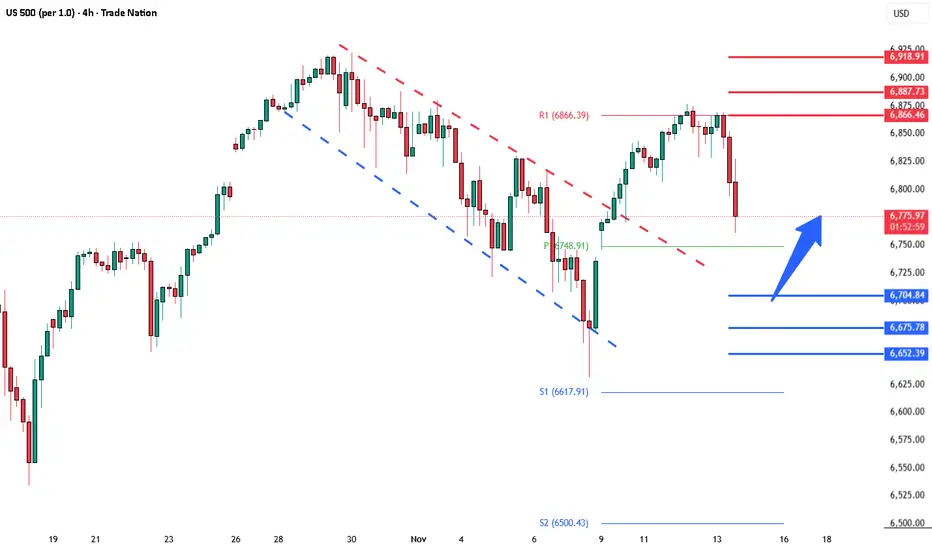
S&P Key Trading LevelsKey Support and Resistance Levels
Resistance Level 1: 6866
Resistance Level 2: 6890
Resistance Level 3: 6920
Support Level 1: 6704
Support Level 2: 6675
Support Level 3: 6650
This communication is for informational purposes only and should not be viewed as any form of recommendation as to a particular course of action or as investment advice. It is not intended as an offer or solicitation for the purchase or sale of any financial instrument or as an official confirmation of any transaction. Opinions, estimates and assumptions expressed herein are made as of the date of this communication and are subject to change without notice. This communication has been prepared based upon information, including market prices, data and other information, believed to be reliable; however, Trade Nation does not warrant its completeness or accuracy. All market prices and market data contained in or attached to this communication are indicative and subject to change without notice.
SPX NOV 2025SPX rejects 6900 supply, holding 6700.
Distribution 6900/6150.
Up tgt 6955-7000, down tgt 6500-6400.
#SPX #globaltrade #investment #investing #stockmarket #wealth #realestate #markets #economy #finance #money #forex #trading #price #business #currency #blockchain #crypto #cryptocurrency #airdrop #btc #ethereum #ico #altcoin #cryptonews #Bitcoin #ipo

S&P500 The Week Ahead Key Trading Levels Key Support and Resistance Levels
Resistance Level 1: 6866
Resistance Level 2: 6890
Resistance Level 3: 6920
Support Level 1: 6704
Support Level 2: 6675
Support Level 3: 6650
This communication is for informational purposes only and should not be viewed as any form of recommendation as to a particular course of action or as investment advice. It is not intended as an offer or solicitation for the purchase or sale of any financial instrument or as an official confirmation of any transaction. Opinions, estimates and assumptions expressed herein are made as of the date of this communication and are subject to change without notice. This communication has been prepared based upon information, including market prices, data and other information, believed to be reliable; however, Trade Nation does not warrant its completeness or accuracy. All market prices and market data contained in or attached to this communication are indicative and subject to change without notice.

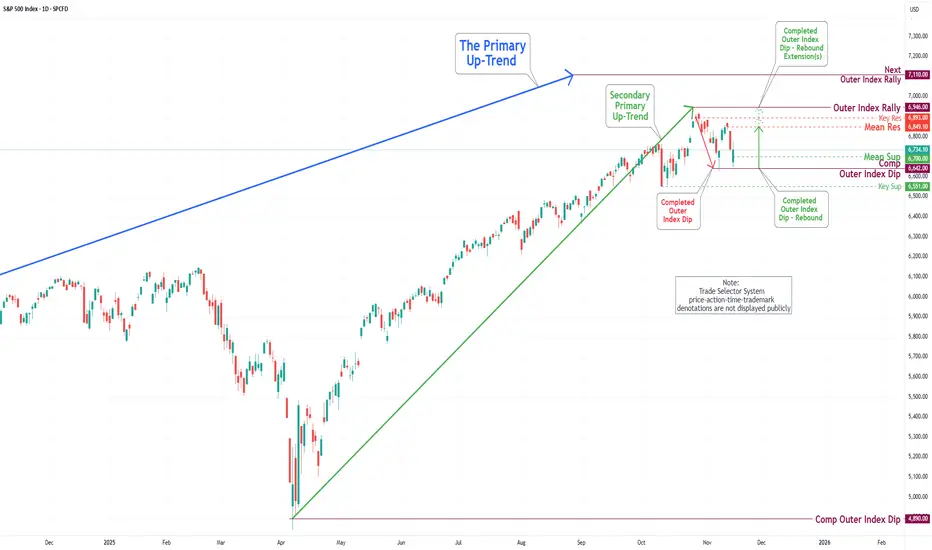
S&P 500 Daily Chart Analysis For Week of Nov 14, 2025Technical Analysis and Outlook:
The most recent trading session exhibited a significant decline in the S&P 500 Index, highlighting the significance of our Key Resistance target, marked as 6893, situated just below the Outer Index Rally 6,946. The index has now retested the Outer Index Dip at 6,642, and it tipped its hand that it wants to go higher. This current position indicates the potential for further upward movement, with the target established at the Mean Resistance level of 6,849 and a well-structured extension towards the Key Resistance level of 6,893, with an ultimate target for the Outer Index Rally set at 6,946.
Nevertheless, it is crucial to acknowledge the possibility of a drawdown in the forthcoming week's trading session, which could nibble at the Mean Support of 6,700, possibly resulting in a further decline to the "Do That to Me One More Time" Outer Index Dip at 6,642 before ultimately resuming an upward trajectory.
Master Correlation Strategies: Types, Tools and Strategies1. What is Correlation and Why It Matters?
Correlation measures how two instruments move relative to each other.
It ranges from –1 to +1:
+1 (Perfect Positive Correlation): Both move in the same direction consistently.
–1 (Perfect Negative Correlation): They move in opposite directions consistently.
0 (No Correlation): Movements are unrelated.
Traders use correlation for:
Predicting asset behavior
Avoiding overexposure
Finding intermarket confirmation
Enhancing risk-reward
Detecting market sentiment shifts
Building multi-asset strategies
If you’re a short-term, positional, or intraday trader, correlation can help filter false signals and improve decision accuracy.
2. Types of Correlation Used in Trading
A) Direct Correlation
Two assets move together.
Example: Nifty and Bank Nifty, Crude Oil and Oil & Gas stocks, US Dollar vs USDINR.
This helps in confirmation:
If Nifty is bullish but Bank Nifty lags, the market may be weak.
B) Inverse Correlation
Assets move opposite.
Example:
Gold vs Equity markets
Bond yields vs Stock indices
VIX vs Nifty
Useful for hedging and identifying risk-off sentiments.
C) Rolling Correlation
Correlation changes over time.
Markets evolve, so a dynamic (rolling) view helps traders understand whether relationships are strengthening or weakening.
D) Lead-Lag Correlation
One asset moves first, another follows.
Example:
US markets lead Indian markets
Dollar Index moves before major commodities
US 10-year bond yields lead global risk sentiment
This helps predict future price behavior.
3. Tools to Measure and Apply Correlation
1. Correlation Matrix
Used to check correlations among multiple instruments.
Especially handy for portfolio traders and sector-based strategies.
2. Scatter Plots
Used to visualize relationships and identify the strength and slope of correlation.
3. Rolling Correlation Charts
Shows how correlation changes over time.
4. Heat Maps
Popular in institutional trading to track multi-asset relationships quickly.
5. Market Internals Data
Such as advance-decline ratio, VIX, bond yields, and sector performance.
4. Master Correlation Strategies for Traders
Strategy 1: Multi-Index Confirmation Strategy
Before entering a trade on Nifty, check:
Bank Nifty
FINNIFTY
India VIX
USDINR
If Nifty gives a breakout but Bank Nifty and FINNIFTY remain weak, avoid the trade.
This reduces false breakouts dramatically.
How it works:
Strong correlation improves accuracy
Weak/negative correlation signals uncertainty
VIX acts as a sentiment filter
Great for positional and intraday index traders.
Strategy 2: Sector-Based Correlation Mapping
Most big moves in indices come from sector rotation.
Check:
IT Sector correlation with NASDAQ
Bank Nifty correlation with bond yields
Energy stocks with global crude oil
Pharma with USDINR
Example:
If crude oil falls, OMC stocks like IOC/HPCL/BPCL tend to rise.
If NASDAQ is weak, Indian IT stocks generally face pressure.
Sector correlation helps traders anticipate moves before they appear on charts.
Strategy 3: Risk-On vs Risk-Off Correlation Strategy
Use inverse correlations to identify sentiment shifts.
Risk-On Indicators:
Nifty up
USDINR down
VIX down
Crude oil stable
Bond yields stable
Risk-Off Indicators:
Gold up
Dollar index up
Bond yields up
Equities fall
VIX spikes
When 3–4 indicators align, the market enters a clear sentiment phase.
Traders use this to:
Avoid contra-trend trades
Catch early reversal signals
Manage position sizing
Strategy 4: Pair Trading with Correlated Assets
Pairs trading works best when you find strongly correlated instruments.
Example:
HDFC Bank vs ICICI Bank
TCS vs Infosys
SBI vs Bank Baroda
If correlation is 0.85+, and one stock rises while the other lags, traders take:
Long position in the undervalued one
Short position in the overvalued one
Profit comes when correlation returns to normal.
This is a favorite hedge-fund strategy because:
Low risk
Market-neutral
Works in all market conditions
Strategy 5: Currency-Commodity Correlation Strategy
Many commodities move based on currency trends.
Key correlations:
USDINR vs Gold
DXY vs Crude Oil
DXY vs Metals (Copper, Silver, Aluminium)
If DXY rises sharply, commodities generally fall.
Traders use this to create multi-market confirmation:
If DXY is bullish → Crude sells off → OMC stocks rise
If USDINR spikes → IT stocks gain strength
This strategy links currency, commodities, and equities in one structure.
Strategy 6: Global Market Correlation Strategy
Indian markets follow global cues.
Check:
US Futures (Dow, S&P, Nasdaq)
Asian Markets (Nikkei, HSI, Shanghai)
European Futures (DAX, FTSE)
US Bond Yields
Dollar Index
If global sentiment is aligned (e.g., all red), avoid long trades even if Nifty supports.
This strategy prevents trading against the global flow, reducing risk significantly.
Strategy 7: Time-Frame Correlation Strategy
Correlations differ across timeframes.
For example:
Intraday correlation between Nifty and Bank Nifty is strong
Weekly/monthly correlation may differ
Traders use multi-timeframe correlation to confirm:
Trend
Volume flow
Breakout strength
Retracement quality
If daily correlation is strong but intraday weak, market may be choppy.
5. Advantages of Master Correlation Strategies
✔ Improved accuracy in signals
✔ Prevents overexposure
✔ Filters out false breakouts
✔ Better understanding of market sentiment
✔ Identifies leading indicators early
✔ Helps in constructing diversified portfolios
✔ Offers hedge-based safety during volatile times
6. Common Mistakes Traders Make
Relying on static correlation values
Ignoring rolling correlation changes
Overtrading based on correlation alone
Assuming correlation means causation
Ignoring news events that break correlations temporarily
Always combine correlation with price action, volume profile, and market structure.
7. Final Conclusion
Master correlation strategies allow traders to see the market as a connected ecosystem instead of isolated assets. By studying how indices, sectors, currencies, commodities, and global markets move together, you gain a powerful advantage. Correlation is not about predicting the future but understanding context, filtering noise, and increasing conviction. When correlation aligns with market structure analysis and volume behavior, you unlock the highest probability trades with lower emotional stress.
S&P 500 instant pullback to 6100 index points/SPX strong drop Recent market dynamics suggest that the S&P 500 is entering a structurally vulnerable phase, in which valuation extension, momentum fatigue, and deteriorating breadth are becoming increasingly evident. The index’s move toward the 6,920 level represents a meaningful dislocation from its prior equilibrium near 6,245, following an unusually rapid ~35% appreciation from May to November — such acceleration is historically difficult to sustain without a subsequent period of normalization.
From a longer-term vantage point, the S&P 500’s rise from the depths of the 2008 crisis (~800–1,000 index points) to present levels underscores the magnitude of the rally and the extent of multiple expansion embedded in the current valuation base.
From a technical and quantitative perspective, the 1-month StochRSI is beginning to turn lower, signalling a loss of trend durability at a time when price is exhibiting characteristics typically associated with late-cycle exhaustion. When momentum decelerates while price continues to extend, markets often transition into fast, liquidity-driven retracements rather than orderly consolidations.
Against this backdrop, a corrective phase in the magnitude of 7–10%*appears increasingly plausible. Should this materialise, the probability rises for the index shifting into a sequence of lower highs, effectively re-introducing two-way risk after months of one-directional flow dominance.
From a longer-term risk view, a more extended decline toward the 4,200index-point region cannot be ruled out, given how stretched valuations and momentum have become.
For institutional participants, this environment warrants a disciplined reassessment of exposure, with selective hedging or tactical downside positioning considered within a well-defined risk-management framework.
apolloacademy.com
darinnewsom.com
tradethatswing.com
#SP500 #Equities #GlobalMarkets #MarketOutlook #RiskManagement
#Volatility #MacroStrategy #AssetAllocation #MarketStructure
#QuantResearch #TechnicalAnalysis #InvestmentStrategy
#GoldmanSachs #JPMorgan #MorganStanley #BankofAmerica
#Citi #UBS #DeutscheBank #HSBC #Barclays #BNPP #SocGen
#ING #RBC #Nomura #Mizuho #WellsFargo #Jefferies #Macquarie
#BlackRock #Bridgewater #Citadel #TwoSigma #Point72
#Millennium #AQR #Fidelity #Vanguard #StateStreet #PIMCO
#HedgeFunds #InstitutionalInvesting #PortfolioManagement
