S&P500 Final rally to 6925, then sell-off to 1D MA200?The S&P500 index (SPX) had a massive Friday rebound on its 1D MA100 (green trend-line) and yesterday touched again its 1D MA50 (blue trend-line), this time as a Resistance.
If it manages to break and close a 1D candle above it, we expect the current rebound to continue and evolve into the end-of-year rally and test at least the ATH Resistance at 6925.
The 1D RSI sequence suggests that we may be currently inside a same pattern as the December 2024 - January 2025 fractal, which after a 1D MA100 rebound it hit the ATH Resistance again and then got heavily rejected back to the 1D MA200 (orange trend-line) and beyond.
As a result, after the rally, our medium-term Target is 6300 (expected contact with the 1D MA200).
---
** Please LIKE 👍, FOLLOW ✅, SHARE 🙌 and COMMENT ✍ if you enjoy this idea! Also share your ideas and charts in the comments section below! This is best way to keep it relevant, support us, keep the content here free and allow the idea to reach as many people as possible. **
---
💸💸💸💸💸💸
👇 👇 👇 👇 👇 👇
Trade ideas

Week 48 Market Update — $SPXStrong week for the SP:SPX index. After two weeks of hesitation candles, price finally shifted back into strength and pushed decisively higher. This week’s candle not only reclaimed momentum but fully erased last week’s cooling-off behavior.
Price also moved well above the key mid-range levels that traders usually watch to define trend health. It’s now sitting firmly above the major risk zone and continues building distance away from it — a clear sign of strength. From the moment this week’s upside break triggered, the index has gained roughly 1.9%, and that kind of move typically translates into solid returns for options traders playing directional setups.
Major support zones sit lower around 5900, 5100, and the deeper structural support near 4000. As long as price holds above the upper layers of support, momentum remains intact.
On the higher-timeframe monthly chart, the trend has been active for eight straight months with no signs of exhaustion. Price is still far above the level where the monthly trend began, and even further above the long-term midline — showing how dominant the larger trend still is.
The 2-day chart continues to support the overall bullish structure, breaking above short-term levels and maintaining strength after multiple confirmations earlier in the week.
This week was a clean continuation of the broader uptrend — strong candle, strong momentum, and strong positioning above every major structural region.
Elite clarity. Elite precision. More coming soon.

S&P500 H1 | Bearish Reaction Off Key ResistanceMomentum: Bearish
Price is currently below the ichimoku cloud.
Sell entry: 6,711.35
- Strong pullback resistance
- 78.6% Fib retracement
- 100% Fib projection
Stop Loss: 6,785.20
- Overlap resistance
Take Profit: 6,641.93
- Overlap support
High Risk Investment Warning
Stratos Markets Limited (tradu.com/uk ), Stratos Europe Ltd (tradu.com/eu ):
CFDs are complex instruments and come with a high risk of losing money rapidly due to leverage. 70% of retail investor accounts lose money when trading CFDs with this provider. You should consider whether you understand how CFDs work and whether you can afford to take the high risk of losing your money.
Stratos Global LLC (tradu.com/en ): Losses can exceed deposits.
Please be advised that the information presented on TradingView is provided to Tradu (‘Company’, ‘we’) by a third-party provider (‘TFA Global Pte Ltd’). Please be reminded that you are solely responsible for the trading decisions on your account. Any information and/or content is intended entirely for research, educational and informational purposes only and does not constitute investment or consultation advice or investment strategy. The information is not tailored to the investment needs of any specific person and therefore does not involve a consideration of any of the investment objectives, financial situation or needs of any viewer that may receive it. Past performance is not a reliable indicator of future results. Actual results may differ materially from those anticipated in forward-looking or past performance statements. We assume no liability as to the accuracy or completeness of any of the information and/or content provided herein and the Company cannot be held responsible for any omission, mistake nor for any loss or damage including without limitation to any loss of profit which may arise from reliance on any information supplied by TFA Global Pte Ltd.

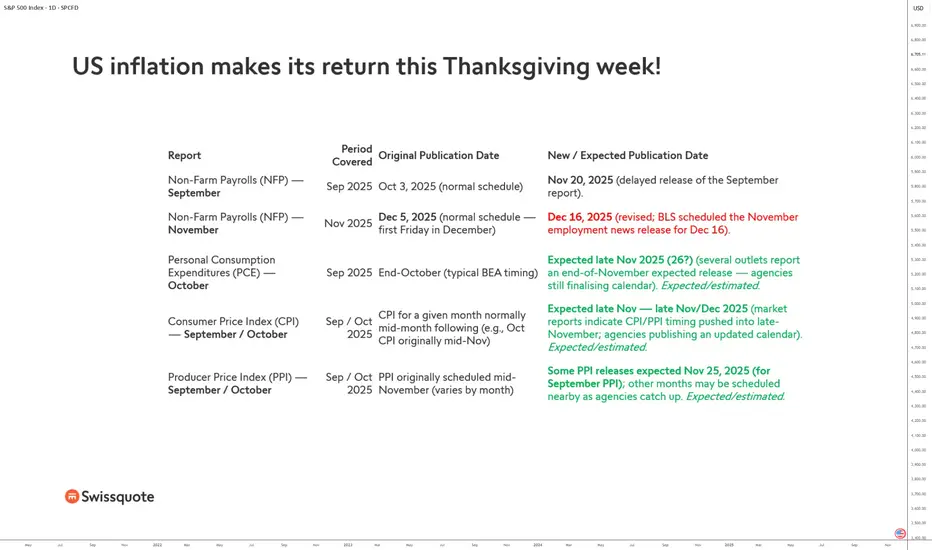
US inflation makes its return this Thanksgiving week!For several weeks, financial markets have been operating with reduced visibility. The reason: the latest U.S. shutdown, which paralyzed part of the federal administration and caused an exceptional delay in the publication of numerous major macroeconomic statistics. Yet these figures, usually released according to a precise schedule, form the analytical backbone for investors and for the Federal Reserve (Fed). The situation should finally normalize during this Thanksgiving week, with a long-awaited catch-up, particularly regarding PCE inflation, the Fed’s preferred inflation indicator.
One of the most notable delays concerns the Non-Farm Payrolls (NFP) series. The September report, originally scheduled for October 3, was only released last Thursday. The November report, normally published in early December, will not appear until December 16—after the Fed’s December 10 meeting. These delays are due to the need for U.S. statistical agencies to rebuild their data and validation processes after several weeks of forced shutdown.
But the central focus of market attention remains the PCE (Personal Consumption Expenditures) index for October, a key figure for anticipating the Fed’s monetary stance at its December 10 meeting. This report was expected at the end of October under the standard Bureau of Economic Analysis (BEA) timeline. Now, several converging sources indicate a release expected this week, likely on November 25 and 26, as agencies finalize their revised calendar. It is therefore during Thanksgiving week that investors will finally receive these crucial numbers.
The uncertainty does not end there. Consumer Price Index (CPI) and Producer Price Index (PPI) reports for September and October have also been delayed. Markets now anticipate publication “late November to early December,” giving agencies time to fully adjust their distribution processes.
Some components of the PPI, particularly for September, may be released as soon as November 25, with remaining figures following shortly after.
This major catch-up comes at a decisive moment. With the Fed set to decide on December 10 about a potential adjustment to its monetary policy, every inflation data point carries considerable weight. The PCE numbers, in particular, will provide a clearer snapshot of price dynamics during the autumn, and therefore of the central bank’s room for maneuver should it consider a 0.25% rate cut.
DISCLAIMER:
This content is intended for individuals who are familiar with financial markets and instruments and is for information purposes only. The presented idea (including market commentary, market data and observations) is not a work product of any research department of Swissquote or its affiliates. This material is intended to highlight market action and does not constitute investment, legal or tax advice. If you are a retail investor or lack experience in trading complex financial products, it is advisable to seek professional advice from licensed advisor before making any financial decisions.
This content is not intended to manipulate the market or encourage any specific financial behavior.
Swissquote makes no representation or warranty as to the quality, completeness, accuracy, comprehensiveness or non-infringement of such content. The views expressed are those of the consultant and are provided for educational purposes only. Any information provided relating to a product or market should not be construed as recommending an investment strategy or transaction. Past performance is not a guarantee of future results.
Swissquote and its employees and representatives shall in no event be held liable for any damages or losses arising directly or indirectly from decisions made on the basis of this content.
The use of any third-party brands or trademarks is for information only and does not imply endorsement by Swissquote, or that the trademark owner has authorised Swissquote to promote its products or services.
Swissquote is the marketing brand for the activities of Swissquote Bank Ltd (Switzerland) regulated by FINMA, Swissquote Capital Markets Limited regulated by CySEC (Cyprus), Swissquote Bank Europe SA (Luxembourg) regulated by the CSSF, Swissquote Ltd (UK) regulated by the FCA, Swissquote Financial Services (Malta) Ltd regulated by the Malta Financial Services Authority, Swissquote MEA Ltd. (UAE) regulated by the Dubai Financial Services Authority, Swissquote Pte Ltd (Singapore) regulated by the Monetary Authority of Singapore, Swissquote Asia Limited (Hong Kong) licensed by the Hong Kong Securities and Futures Commission (SFC) and Swissquote South Africa (Pty) Ltd supervised by the FSCA.
Products and services of Swissquote are only intended for those permitted to receive them under local law.
All investments carry a degree of risk. The risk of loss in trading or holding financial instruments can be substantial. The value of financial instruments, including but not limited to stocks, bonds, cryptocurrencies, and other assets, can fluctuate both upwards and downwards. There is a significant risk of financial loss when buying, selling, holding, staking, or investing in these instruments. SQBE makes no recommendations regarding any specific investment, transaction, or the use of any particular investment strategy.
CFDs are complex instruments and come with a high risk of losing money rapidly due to leverage. The vast majority of retail client accounts suffer capital losses when trading in CFDs. You should consider whether you understand how CFDs work and whether you can afford to take the high risk of losing your money.
Digital Assets are unregulated in most countries and consumer protection rules may not apply. As highly volatile speculative investments, Digital Assets are not suitable for investors without a high-risk tolerance. Make sure you understand each Digital Asset before you trade.
Cryptocurrencies are not considered legal tender in some jurisdictions and are subject to regulatory uncertainties.
The use of Internet-based systems can involve high risks, including, but not limited to, fraud, cyber-attacks, network and communication failures, as well as identity theft and phishing attacks related to crypto-assets.
S&P500 breakout retest? S&P 500 Trading Summary
Markets started December on weak footing, with risk assets and bonds under pressure. A global rates selloff, triggered by hawkish comments from BoJ Governor Ueda that pushed 10yr JGB yields to post-GFC highs, spilled into the US and Europe. Treasury yields jumped sharply, with the 10yr +7.2bps, its biggest rise in nearly a month.
At the same time, US data disappointed: the ISM manufacturing print took on a stagflationary tone, and higher oil prices amplified inflation concerns. This combination of higher yields + weaker data weighed on equities, leaving the S&P 500 down –0.53%.
Crypto-related volatility added to the risk-off sentiment, with Bitcoin down over 5% and major crypto-linked ETFs suffering steep year-to-date losses, though investor demand for such products remains surprisingly resilient.
On the consumer side, Cyber Monday spending grew more slowly in the US compared to Europe, partly reflecting tariff-driven pressures on US shoppers. While global online spending rose about 5%, the US lagged at 2.6%.
Overall: The session reflected renewed rate fears, stagflation worries, and softening US consumer data, all contributing to a softer tone for the S&P 500.
This communication is for informational purposes only and should not be viewed as any form of recommendation as to a particular course of action or as investment advice. It is not intended as an offer or solicitation for the purchase or sale of any financial instrument or as an official confirmation of any transaction. Opinions, estimates and assumptions expressed herein are made as of the date of this communication and are subject to change without notice. This communication has been prepared based upon information, including market prices, data and other information, believed to be reliable; however, Trade Nation does not warrant its completeness or accuracy. All market prices and market data contained in or attached to this communication are indicative and subject to change without notice.

$SPX — WEEK 49 TREND REPORTSPX — WEEK 49 TREND REPORT
Ticker: SP:SPX — 12/01/2025 @ 6812.63
Timeframe: WEEKLY
This is a reactive structural classification of SPX based on the weekly chart as of this timestamp. Price conditions are evaluated as they stand — nothing here is predictive or forward-assumptive.
⸻
1) Current Trend Condition
• Trend Duration: +2 weeks (bullish)
• Trend Reversal Level ( Origin ): 6,721
• Trend Reversal Level ( Confirmation ): 6,432
⸻
2) Structure Health
Retracement Phase:
• Uptrend (operating above 78.6%)
Position Status:
• Healthy (price above both structural layers)
⸻
3) Temperature: Warming Phase
⸻
4) Momentum: Bullish
⸻
5) Market Sentiment: Bullish
⸻
Author’s Note
This analysis is fully reactive, not predictive. Market conditions, trend structure, and behavior are classified as they appear in real time. The objective is to identify where directional shifts first occurred, where structural integrity remains intact, and where it would begin to weaken if key levels were breached.
Predictive analysis projects outcomes that do not exist yet. Without price confirmation, prediction is built on baseless assumptions. This framework avoids that entirely by responding only to verified structural changes and live conditions.
The levels shown simply identify where the current trend structure first shifted and where it would begin to lose integrity if breached. Recognizing these boundaries allows for clearer interpretation of market behavior without relying on forward guarantees, speculative projections, or unsupported assumptions.
⸻
Methodology Overview
This classification framework evaluates directional conditions using internal trend-interpretation logic that references price behavior relative to its structural layers. These relationships are used to identify when price movement aligns with the framework’s criteria for directional phases, transition points, or regime shifts. Visual elements or structural labels reflect these internal interpretations, rather than explicit trading signals or preset indicator crossovers. This framework is observational only and does not imply future outcomes.

SPX Gann BoxUpdated Gann BOX Fibonacchi Levels for upcoming SPX correction/wave down.
Horizontal levels mark possible price targets at fibonacchi numbers with a horizontal support. Vertical levels show time targets at fibonacchi numbers. Current move went up to .618 and .786 levsl, that indicates us a price target at 2.618 or 2.786 would be likely as well.

S&P 500 Technical & Fundamental Outlook — Week of De 1–5 2025Technical Analysis Summary – SPX Compression Structure
SPX is currently trading inside a contracting price formation, defined by a descending resistance trendline from recent highs and a rising support trendline from the early Q4 low. This structure represents a period of market indecision and volatility compression, where buyers and sellers are positioning before a larger directional move.
Key Observations
The upper trendline marks repeated rejection points — this is a clear overhead supply zone.
The lower trendline shows higher lows forming — underlying demand is still present.
Price is compressing toward an apex, and historically, these structures lead to strong expansion once resolved.
Because of this setup, entries inside the wedge are high-risk and low-reward, as price tends to chop and trap both sides until a breakout or breakdown is confirmed.
Bullish Scenario
A bullish continuation requires:
A clean breakout above the descending trendline
A successful pullback that holds as support (higher low)
Continuation momentum
This would indicate that buyers have absorbed supply and are in control. Upside levels then open toward the previous reaction highs, and momentum buyers may accelerate the move.
Bearish Scenario
A bearish continuation is confirmed by:
A breakdown below the rising trendline
A failed retest of that area from below (lower high)
Increase in downside momentum or volume
This would signal that buyers have lost control of the trend, and trapped long positions above could fuel a deeper correction toward prior support levels.
Conclusion
The SPX is coiling inside a clear compression pattern.
The proper approach is to wait for the market to choose direction, then position after confirmation, not before.
This is a breakout-or-breakdown environment — not a place to trade the middle.The Market Is Rallying — BUT The AI Trade Is Fragile
Stocks rebounded hard this past week after the biggest pullback since April, mainly because:
Markets believe the Fed will cut in December (rate-cut odds jumped to 80%+).
BUT:
Mega-cap AI names remain volatile.
AI profitability narrative is being challenged.
This is the key line in the sand for SPX right now:
AI spending is massive, but profits are not yet confirmed.
That’s the reason NVDA + GOOGL are whipping around so violently.
⚠️ 2. The Narrative Shift You Must Watch
The market is shifting from "AI growth" → "AI returns".
Matthew Maley (Miller Tabak):
“The narrative surrounding the profitability of AI is coming under question.”
Translation for traders:
No longer enough to say “AI spending”.
Now the market wants proof of revenue + margins.
If that narrative worsens → SPX pressure.
This week was a warning shot:
Alphabet mooning on Gemini 3 news → “AI winner” narrative
Meta possibly buying Google chips → hurts NVDA
Semis shook → volatility in the core leadership names
If NVDA becomes an AI CAPEX victim instead of the bottleneck supplier → the entire AI bull leg changes.
📉 3. Bitcoin’s Slide = Waning Risk Appetite
Bitcoin fell from $125k → under $90k.
King Lip (BakerAvenue):
“Bitcoin serves as a risk proxy for equities.”
This matters because:
SPX often peaks when BTC momentum dies.
Risk is shifting from growth/AI → defensives/small caps.
Crypto weakness = risk appetite fading.
📈 4. SPX Context — This Is NOT a Crash, It’s a “Narrative Test”
SPX is +16% YTD heading into a historically strong window.
December is the 3rd-best month since 1950 (avg +1.43%)
Market is still at the ceiling:
SPX is only ~1% below its October ATH
Nasdaq is ~3% off its high
This is not bearish selling.
This is positioning + narrative testing.
🧠 5. What Is Hurting Tech Right Now
Two forces:
A. Timing of monetization
Companies spent hundreds of billions on training + infra.
But when do earnings arrive?
Nobody knows.
Paul Nolte:
“Investors are rethinking how quickly this will hit bottom lines.”
This is the heart of the SPX risk.
B. Tech Debt Issuances
Big AI names issued heavy debt to fund expansion.
This scares valuation models.
When the “future promises” trade meets balance sheet reality → rotations begin.
💵 6. Fed Cuts: The Bullish Counterweight
Traders now price:
80%+ odds of a December rate cut
This is huge because:
Cuts expand breadth in the SPX
Small caps, cyclicals, value names get oxygen
This is the exact reason SMID outperformed this week.
Anthony Saglimbene:
“What I’m watching is if rate cuts bring momentum outside of tech.”
This is literally the rotation we’ve been waiting for.
🏭 7. Macro Ahead — SPX Sensitivity
Next week will hit:
Manufacturing ISM
Services ISM
Consumer sentiment
CRM, DLTR, KR earnings (consumer health)
Holiday retail performance (Black Friday / Cyber Monday)
👉 But note: many core economic releases were delayed or cancelled due to the 43-day government shutdown.
Saglimbene:
“Investors will have to deal with the fog.”
This creates high headline volatility on SPX going into January.
🔑 8. THE REAL TAKEAWAY FOR SPX & NDX TRADERS
This is no longer a hype-cycle AI rally.
You must trade:
Earnings
Margin guidance
Capex-to-revenue timing
🎯 AI → cost center (now)
🎯 AI → profit engine (unknown)
As long as that uncertainty persists,
➡️ volatility in NVDA, AAPL, GOOG, MSFT, META remains
➡️ SPX stays sensitive at the highs
🧨 Trader-Level Summary (no commentator BS)
Bullish forces
Fed rate cut probability exploding higher
Seasonality (December = historically strong)
Market breadth improving beyond megacaps
Bearish forces
Bitcoin risk proxy collapsing
AI spending profitability questioned
Mega-cap tech debt issuance
“Infra first, profits later” fear
🔥 HOW TO TRADE THIS (S&P Focused)
Watch these 3 things every day:
1️⃣ NVDA price action
If NVDA cracks ↓ → SPX loses leadership.
2️⃣ Alphabet’s Gemini 3 momentum
If Gemini models take market share:
→ NVDA supply chain narrative fractures
→ Rotation to CPUs/TPUs → hurting semis
3️⃣ Bitcoin risk proxy
BTC < $90k = risk appetite unwinding
🏁 ONE SENTENCE THAT MATTERS
SPX is still bullish, but leadership is no longer unquestioned — AI profitability and risk appetite are now the drivers, not AI hype.

Bearish Shark - Retest All time highs? Speculating on another run up to retest all time highs for OANDA:SPX500USD before capitulation or significant retracement event, depending on rate cuts and or QE news of course.

SP500 BULL TRAP?There is a giant bullish monthly candle . But if you check the previous one there is no new high and it's a inside candle which is bearish . I am very cautious here and taking profit for sp500 etfs. I would never short sp500 .

SPX500: Thanksgiving Range — 6815–6842 Controls the MarketOANDA:SPX500USD continued to push higher exactly as projected yesterday.
Market activity is expected to be quieter today due to the Thanksgiving holiday, which typically reduces volatility across U.S. indices.
Technical Outlook
For today, the price is likely to consolidate between 6815 and 6842 until a breakout occurs.
Bearish Scenario:
A 1H close below 6813 will open the path toward 6771, with 6797 acting as the first reaction zone.
Bullish Scenario:
While trading above 6813, the price may retest 6842, and a break above this level could extend toward 6870.
Pivot Line: 6813
Support: 6797 · 6771
Resistance: 6842 · 6870

FRIDAY SELL SIDE LIQUIDITY CLEARANCE!Sell side liquidity has been building since the beginning of this week, Monday, 1st December. My expectation is that the market shall end the week, firstly by moving higher, a Judas Swing, to sweep buy side liquidity at the Daily Level. Then reverse sharply and descend to take out the entire week's liquidity on the downside built up from Monday.
This would be such a beautiful execution. It makes so much sense to me for price to move this way. If not, hey, I am always happy to learn from any flawed analysis I make!
Good luck tomorrow!


Looking at SPX on a Large Timeframe Post the 08 market crash price has accelerated very fast away from the trend line I have drawn in white. Is it following another trend like the one drawn in dotted green, or will a retest of the white line come.
It is more likely in my opinion that it follows the green curve up as a drop like that would be a massive bubble pop.
See how it unfolds
Monthly timeframe

The Importance of Reserves in Trading1. Definition and Types of Reserves
Reserves generally refer to the assets that a country, financial institution, or corporation keeps aside to meet future obligations, emergencies, or to stabilize economic activities. In the context of trading, reserves are primarily associated with central banks, which maintain foreign exchange reserves, gold reserves, and other liquid assets.
Foreign Exchange Reserves (Forex Reserves): These are holdings of foreign currencies, usually in the form of government bonds or deposits, used to back a country’s currency, manage exchange rates, and intervene in the forex market.
Gold Reserves: Traditionally, gold has been a store of value and a hedge against currency volatility. It is part of a country’s overall reserve portfolio.
Special Drawing Rights (SDRs) and Reserve Assets: Allocated by the International Monetary Fund (IMF), these act as supplementary foreign exchange reserve assets to support international liquidity.
Corporate and Bank Reserves: On a smaller scale, businesses and banks maintain cash or liquid reserves to manage operational risks, meet obligations, and ensure stability in trading activities.
2. Stabilizing Currency and Exchange Rates
One of the primary reasons reserves are important in trading is their role in stabilizing a country’s currency. In international trade, goods and services are often priced in stable foreign currencies, particularly the US dollar, Euro, or Japanese Yen. If a country’s currency fluctuates excessively due to market pressures, trade becomes unpredictable and costly.
Reserves allow central banks to intervene in the forex market by buying or selling currencies to maintain exchange rate stability. For example, if the local currency is depreciating sharply, the central bank can sell foreign exchange reserves to support its currency, preventing sudden spikes in import costs and preserving the competitiveness of exports. This stabilization ensures smoother trade transactions, predictable pricing, and confidence among international trading partners.
3. Ensuring Liquidity and Meeting Payment Obligations
Trade often involves payments across borders, which requires liquidity in foreign currency. Countries and corporations holding sufficient reserves can easily settle import bills, service foreign debts, and maintain creditworthiness. For businesses, maintaining cash reserves ensures that operational transactions, supplier payments, and contractual obligations are met without delay.
In times of economic stress, such as a balance-of-payments crisis, reserves act as a crucial liquidity buffer. They allow a country to continue trading, importing essential goods, and servicing debts even when other sources of financing are constrained. Without adequate reserves, a country risks defaulting on payments, facing higher borrowing costs, or experiencing a freeze in trade flows, all of which can be catastrophic for the economy.
4. Building Market Confidence and Creditworthiness
Reserves are not only about liquidity—they are also a signal of financial strength. Large reserves indicate that a country or institution is well-prepared to handle external shocks, giving confidence to investors, traders, and international financial institutions. This confidence translates into lower borrowing costs, stronger credit ratings, and greater willingness of foreign partners to engage in trade.
For instance, countries with ample forex reserves are perceived as more stable and less risky, which encourages foreign trade and investment. Corporations with healthy cash reserves or liquid assets are considered reliable partners in trade agreements, leading to smoother transactions and more favorable credit terms.
5. Hedging Against Trade Risks
International trade is inherently risky due to fluctuating exchange rates, commodity price volatility, geopolitical tensions, and economic downturns. Reserves act as a hedge against these risks. For example:
If a country faces a sudden surge in import prices due to a weakening local currency, reserves can be used to stabilize the exchange rate.
In commodity trading, reserves of strategic goods or currency assets can prevent supply disruptions or price shocks.
During global financial crises, reserves provide a cushion to continue critical trade operations without resorting to excessive borrowing or austerity measures.
This risk mitigation ensures that trade continues even under adverse conditions, protecting both the domestic economy and international trade relationships.
6. Facilitating Monetary and Trade Policies
Reserves give governments and central banks the flexibility to implement monetary and trade policies. By managing reserves effectively, countries can influence interest rates, control inflation, and maintain competitive export pricing. For instance, a country seeking to boost exports might use its reserves to prevent excessive appreciation of its currency, keeping export goods affordable in the global market.
Reserves also enable governments to implement trade agreements, provide subsidies, or intervene in strategic sectors without destabilizing the economy. They act as a financial lever, giving policymakers tools to balance growth, trade, and economic stability.
7. Supporting Crisis Management
History has repeatedly shown that countries with insufficient reserves face severe consequences during economic crises. Examples include sudden capital outflows, currency collapses, or trade restrictions. Reserves act as a shock absorber, allowing countries to navigate crises with minimal disruption to trade. During the 1997 Asian financial crisis, nations with higher reserves were able to stabilize their currencies faster, maintain trade flows, and recover more quickly than those with depleted reserves.
8. Strategic and Geopolitical Importance
Reserves also carry strategic significance. Countries with substantial reserves can influence global trade dynamics, secure critical imports, and participate in international financial negotiations with greater leverage. In geopolitically tense situations, reserves ensure that trade and essential imports continue uninterrupted, supporting national security and economic sovereignty.
Conclusion
Reserves are much more than a financial metric—they are a critical tool that underpins trading activities at every level. They stabilize currency and exchange rates, ensure liquidity, signal creditworthiness, mitigate risks, and enable effective policy implementation. For businesses, sufficient reserves safeguard operational continuity and international trade reliability. For countries, reserves act as both a shield against economic shocks and a lever for strategic influence in global markets.
In an interconnected and unpredictable global economy, reserves are the silent guardian of trade. They enable economies to operate smoothly, sustain investor confidence, and maintain a competitive edge in international commerce. Countries or institutions that fail to maintain adequate reserves face heightened vulnerability to market volatility, trade disruptions, and financial crises. Therefore, managing reserves prudently is not just an accounting exercise—it is a vital component of sustainable economic growth and successful trading.
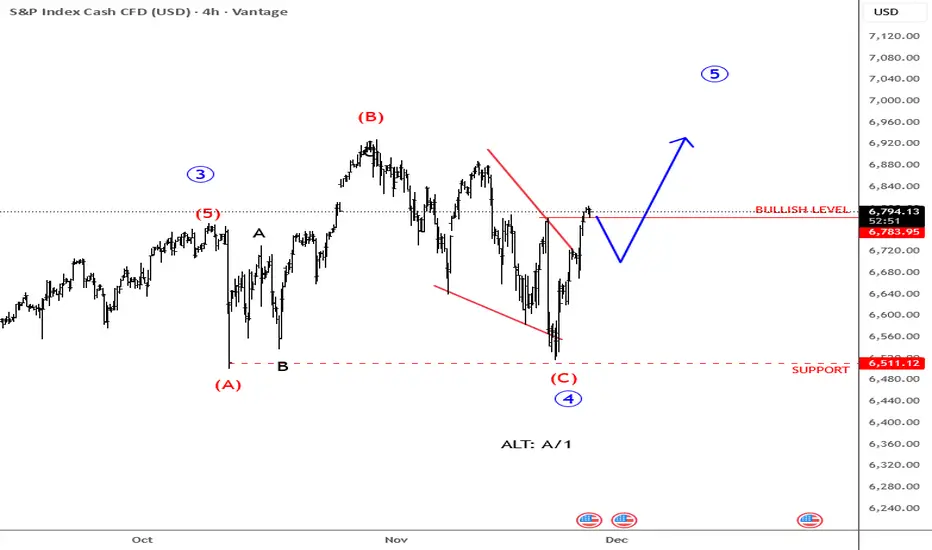
SP500 Resumes The Uptrend After Bears Stops At Key LevelUS stock market moved lower recently, and we’ve seen one of the biggest declines in the last few months, with lower highs and lower swing lows for the last couple of weeks, but there is still a chance that this is basically a diagonal formation on SP500, either in wave C or alternatively already in wave A or wave 1. But so far looks more like a completed C wave of a flat due to the current strong rebound, which can be the beginning of a new wave 5 headed towards new highs; What’s important in the near future, in our opinion, is that as long as the market trades above 6512 support, there is a real chance that there will be more upside in the near-term. At least three wave rally is what I would be looking for.
GH
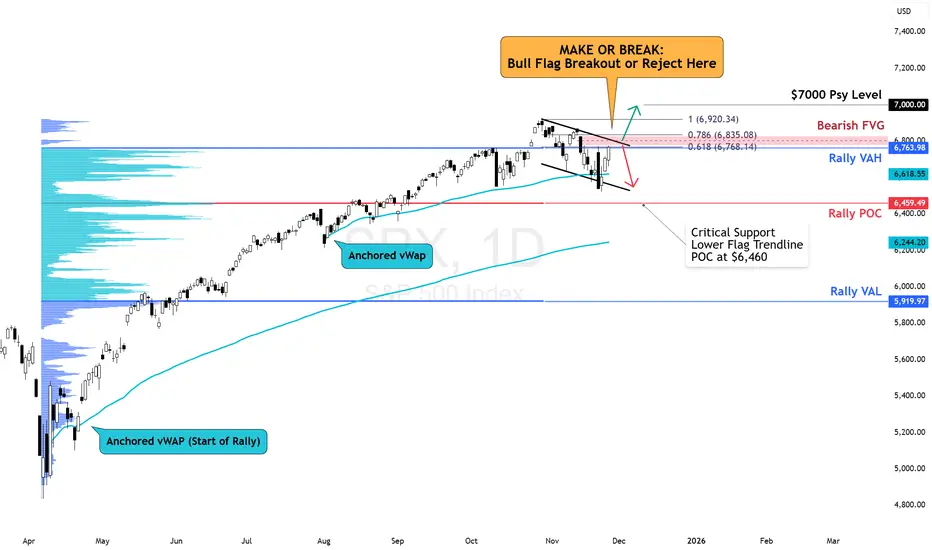
SPX Make or Break: Bull Flag or FVG RejectionSPX is in a make or break situation. Break this bull flag, and we could head header to touch the $7,000 psychological level. Reject here, and we could see lower at $6,500.
After reclaiming the anchored vWAP, SPX is pushing into a stacked zone of resistances:
Upper Bull Flag trendline
Bearish Fair Value Gap
0.618 Fib Retracement
Upside trigger:
– Break and hold above the FVG + 0.786 (≈ 6835–6920).
– Target = retest of highs / 7000.
Downside trigger:
– Failure at FVG
- Breakdown of bull flag
- Move towards Rally POC at 6459
The Bears last standThis level and slightly higher needs to hold otherwise we're going to test the highs and possibly go much further. If there is no reversal today, we will be closing over the 18ma for two days in a row and that is certainly bullish. The Vix needs to get over 20 for a reversal to start having legs. Gold is just sideways. Oil is coiling up for a larger move - possibly down. BTC looks like it can go lower.

The S&P 500: The Last Stand Into Year-EndThe 2025 bull market has culminated as presented in my previous post.
The major structure topped on October 28th, with a secondary, weaker high on November 12th. What remains now is the distribution phase into the final weeks of the year—where the market decides whether it will stabilize and potentially from a double top or begin its descent into 2026.
1. Location in Structure
Price is currently trading beneath the declining angle drawn from the October and November tops.
This angle declines at $4 per day, and has acted as the defining rhythm of the post-top decline.
Top of the year: October 28
Lower high: November 12
Current position: Beneath the angle → inside potential distribution
2. The Two Paths
The market has two paths from here:
A. Bullish Path — December Rally Trigger
To challenge the November 12th high, the S&P must close above the angle.
A confirmed break of the angle → opens the path to
📈 6,860 in the first week of December
This would represent a counter-trend rally back into the underside of the broader 2025 cycle structure.
B. Bearish Path — Rejection = Lower Prices
If price rejects at the angle, it signals:
distribution is underway
momentum remains weak
the November highs are secure as the final secondary top
In this case, lower prices into December follow naturally.
3. The Message of the Structure (And more Charts to keep up on)
The larger cycle has already ended.
We are now watching the small-scale geometry that governs how the year will close:
beneath the angle → distribution
above the angle → December rally
SUMMARY
What remains now is the micro-geometry that will determine how the year closes:
Beneath the declining angle → distribution continues
Above the angle → a December rally opens toward 6,860
While the market could attempt to press toward new highs, the probability is very low — and would be surprising given the current economic backdrop and the clear contraction emerging from a dominant sector of the market.
The structure, motion, and fundamentals all argue that the 2025 peak is already in.

S&P500 crashes! Due relief rally or further pain?Nvidia delivered impressive earnings, but the stock reversed and closed nearly 3% lower, triggering heavy selling across tech and risk assets as odds for a December rate cut have collapsed to just 34%, with policy uncertainty amplified by the cancelled October NFP report. Despite a strong market and rising unemployment in September's NFP report, traders remained defensive and fuelled the declines.
Key drivers:
Nvidia beat earnings, but post-report selling intensified sector losses.
The Fed’s odds for a December rate cut have dropped to 34%, amplifying caution.
The abrupt cancellation of the October NFP means the market lacks fresh labour data, fuelling defensive positioning.
S&P 500, Nasdaq, and Bitcoin broke major supports, confirming risk-off conditions.
Right now, the S&P 500 has broken below channel support near 6,600 and failed to climb back in. If prices stay below this threshold, expect another sharp move lower targeting 6,500 and possibly 6,350. There’s potential for upside, given momentum divergence on the RSI 4-hour chart. If we see a short-term bounce and a return to the channel, a move toward 6,682 is possible, which sets up a tactical short opportunity.
Trade idea:
Entry: Midpoint of 23.6/38.2 Fibonacci (6,655–6,682 area)
Stop-loss: Above 61.8% Fib (6,775)
Take Profits: TP1 6,500 (recent low/support), TP2 6,440 (major support), TP3 trail stop to 6,170 (long-term support)
Risk-off drivers are in control. Earnings reversals, Fed uncertainty, and cancelled NFP data are fuelling this price action. Technically, it comes down to whether we see a return inside the channel for a relief bounce or a sharp continuation downward.
Watch your levels, remain nimble, and let fundamentals and technicals, not emotions, guide your trade.
Let me know your setups in the comments, and follow for more high-action technical and macro trade ideas.
This content is not directed to residents of the EU or UK. Any opinions, news, research, analyses, prices or other information contained on this website is provided as general market commentary and does not constitute investment advice. ThinkMarkets will not accept liability for any loss or damage including, without limitation, to any loss of profit which may arise directly or indirectly from use of or reliance on such information.

US500 - Oversold at Triple Confluence… Bounce Incoming?US500 is approaching a major oversold zone, where three powerful elements intersect at the same point:
• The lower bound of the falling red channel
• The blue long-term trendline
• The orange structure zone acting as demand
⚔️This alignment creates a strong confluence area, a spot where buyers usually step in to absorb selling pressure and trigger corrective moves.
As long as the index holds above this zone, we can expect the possibility of a bullish correction toward the upper trendlines. But if this area fails, the structure would weaken and open the door for deeper downside.
Right now, all eyes are on this confluence… will the US500 bounce from the oversold zone, or break through it? 🤔
⚠️ Disclaimer: This is not financial advice. Always do your own research and manage risk properly.
📚 Stick to your trading plan regarding entries, risk, and management.
Good luck! 🍀
All Strategies Are Good; If Managed Properly!
~Richard Nasr.

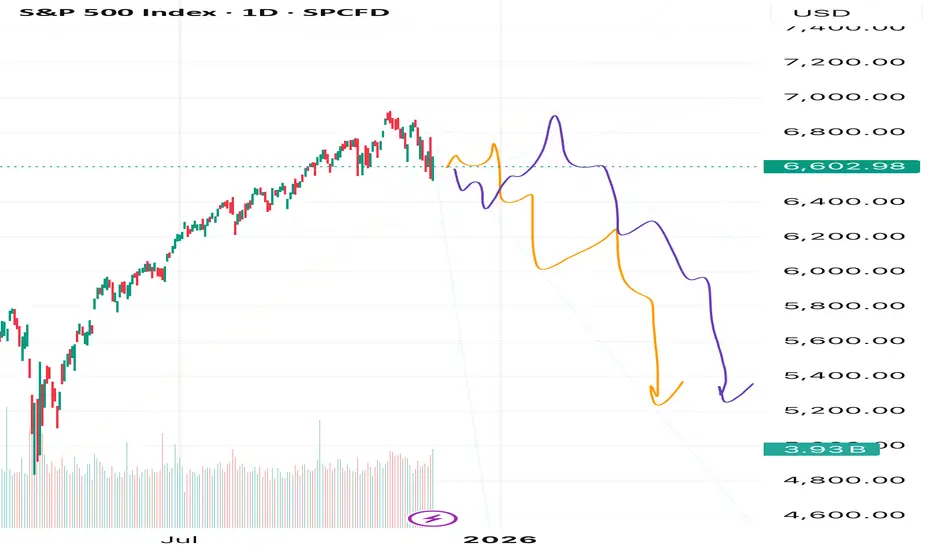
A Historic Shift in the S&P 500 Is BeginningFriends, in my view, the unstoppable rally in the S&P 500 has finally come to an end. The market has completed a massive five-wave structure with an extended fifth wave — and now we’re witnessing a historic moment as an exceptionally large correction begins.
As always, I’m watching two possible scenarios: the orange path and the purple path. But despite their differences, both point to the same outcome — my target at 5200. And that’s only the first target out of several.
Make sure to follow and subscribe, so you don’t miss the upcoming updates and deeper breakdowns.
This is just my personal market outlook — not financial advice. More updates coming soon.
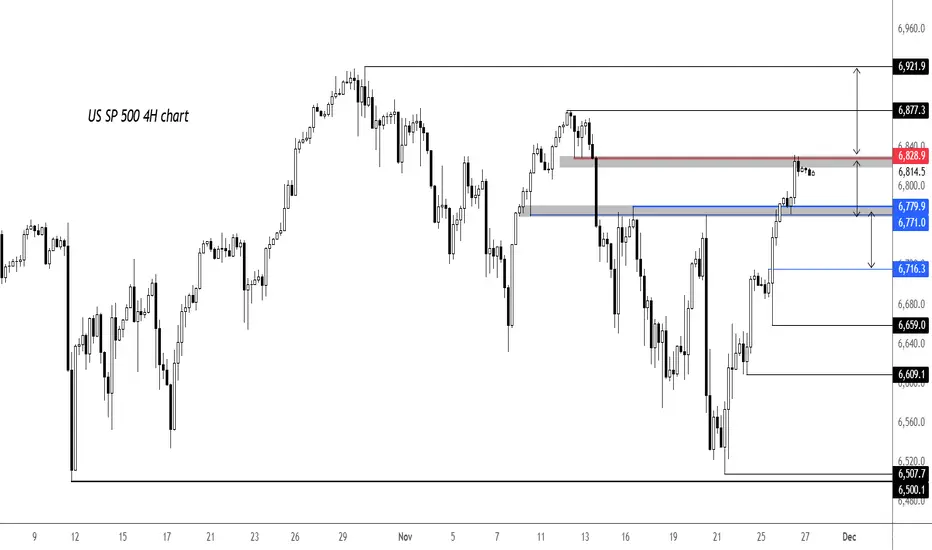
S&P 500 levels to watchFollowing the big recovery, lots of short-term levels have been reclaimed this week but with US markets closed today, index futures have been fairly quite and easing back down ever so slightly. Key support is now seen around 6771-6780 on our US SP 500 chart (derived from the underlying ES prices). Below that, 6716 is the next support. Bulls will get in trouble if 6659 - most recent low - breaks. On the upside, 6829 is first hurdle, marking the point of origin of the previous drop. Ideal location for the bears to step back in if they want to regain control of price action. Lose that, 6877 is next upside target then the all time high at 6922.
By Fawad Razaqzada, market analyst with FOREX.com