Startups Reshaping the Global Market1. Innovation as the Core Driver of Market Transformation
Startups thrive on innovation—not just in products, but in processes, platforms, and business models. Traditional firms often struggle with legacy systems, bureaucratic decision-making, and risk aversion. Startups, however, operate with flexibility and a problem-solving mindset, enabling them to test new ideas quickly.
Examples of Startup-Led Innovations
FinTech companies introduced digital banking, mobile wallets, micro-lending, and crypto-based financial services.
HealthTech startups pioneered telemedicine, AI diagnostics, and wearable health monitoring.
CleanTech innovators built new pathways for sustainable energy, including solar SaaS models and electric mobility.
AgriTech startups are transforming farming with precision agriculture, drone monitoring, and smart irrigation.
By challenging traditional norms, startups create entirely new markets and redefine customer expectations.
2. Digital Transformation and the Acceleration of Automation
Startups have significantly accelerated global digital transformation. They adopt technologies like AI, machine learning, blockchain, IoT, cloud computing, robotics, and automation as foundational elements of their products and services.
Key Impacts
AI-driven startups are powering forecasting, personalization, fraud detection, and workflow automation across industries.
IoT startups are reshaping manufacturing, logistics, and smart cities by enabling real-time data flow and predictive maintenance.
Blockchain startups introduced decentralization in finance, supply chain tracking, and digital identity.
The rapid adoption of digital tools by startups forced larger companies to modernize at unprecedented speed. Today, many enterprises partner with or acquire startups to remain competitive.
3. Disruption of Traditional Industries
Startups often succeed by simplifying complex, expensive, or inefficient processes within existing industries. They disrupt markets by offering:
Lower costs
Better customer experience
Faster delivery
Unique value propositions
Personalized solutions
Industry Disruptions
Transportation: Ride-hailing and mobility startups like Uber, Ola, Grab shaped the future of mobility.
Hospitality: Airbnb redefined accommodation by turning homes into global travel assets.
Retail: E-commerce startups forced traditional retail to shift online.
Media and Entertainment: Streaming startups revolutionized how people consume content.
Education: EdTech platforms made learning accessible to anyone, anywhere.
These disruptions create ripple effects, compelling traditional players to adapt or risk extinction.
4. Democratizing Access to Products and Services
Startups often focus on removing barriers—whether financial, geographical, or technological. Their solutions frequently make services accessible to people who previously could not reach them.
Examples
FinTech startups provide digital loans to small businesses lacking access to traditional banking.
EdTech platforms bring high-quality education to rural areas.
HealthTech solutions enable remote diagnostics for patients in underserved regions.
E-commerce startups allow small merchants to sell nationwide.
This democratization gradually levels the playing field and broadens economic participation.
5. Globalization and Cross-Border Expansion
Startups scale quickly due to digital infrastructure, venture capital funding, and cross-border partnerships. Cloud technology and digital marketing allow them to reach global audiences with minimal physical presence.
Global Expansion Strategies
Launching digital-first products
Partnering with global distributors
Leveraging borderless payment gateways
Operating through remote teams
Using international venture ecosystems
China, India, the US, Southeast Asia, and Europe have emerged as startup hotspots, each contributing to the global innovation landscape. Today, a startup founded in Bangalore or Singapore can compete directly with players in Silicon Valley or London.
6. Redefining Work Dynamics and the Future of Employment
Startups have also reshaped the global labor market. Their work culture emphasizes:
Flexibility
Remote work capabilities
Decentralized teams
Innovation-centric roles
Project-based employment
They push the boundaries of traditional corporate structures, preferring flat hierarchies and collaborative environments.
Impact on the Global Workforce
The rise of freelancing and gig economy platforms.
Increased demand for digital skills—coding, analytics, design, marketing.
Hybrid work becoming a global norm.
New roles emerging in AI, Data Science, UX, and Sustainable Tech.
This shift changes how workers engage with employers and how companies attract global talent.
7. India, Southeast Asia, and Africa: Emerging Powerhouses
While Silicon Valley retains its influence, emerging markets are becoming innovation hubs. They offer young populations, rising internet penetration, and business-friendly policies.
India
Thriving FinTech, EdTech, and SaaS sectors
Large talent pool
Increasing unicorn count
Southeast Asia
Digital commerce boom
Mobility and logistics innovations
Rapid adoption of mobile-first solutions
Africa
FinTech revolutionizing financial inclusion
Startups solving local issues like energy and agriculture
These regions contribute to diversifying global innovation beyond traditional Western markets.
8. Venture Capital and Funding Fuel Startup Growth
The global flow of venture capital has empowered startups to scale quickly. Investors provide not only capital but also mentorship, networks, and strategic guidance.
Funding Trends
Focus on AI, deep tech, sustainability, and biotech.
Rise of sovereign wealth funds investing in global startups.
Increase in corporate venture capital.
Growth of startup incubators and accelerators.
This financial ecosystem feeds global innovation and drives market evolution.
9. Sustainability and Impact-Driven Startups
With climate concerns and ESG policies gaining momentum, startups are building environmentally responsible solutions. Sustainability-focused ventures are transforming energy, mobility, packaging, food production, and recycling.
Areas of impact
Renewable energy
Electric mobility
Carbon capture
Biodegradable materials
Circular economy models
Impact startups are pushing both governments and corporations toward greener practices.
10. Challenges Startups Face in Redefining Global Markets
Despite their strengths, startups also encounter significant barriers:
Regulatory uncertainty
High failure rates
Scaling challenges
Funding shortages during downturns
Talent acquisition struggles
Competition from large established companies
However, their ability to adapt quickly helps many survive and flourish.
Conclusion
Startups are no longer just small experimental ventures—they are powerful forces reshaping the global market. By driving innovation, accelerating digital transformation, democratizing services, disrupting traditional industries, and fostering global competition, startups are setting new benchmarks for how businesses operate. Their influence extends across economies, technologies, and societal structures, making them central to the future of global commerce.
In the coming decade, startups will continue to redefine not just markets, but also how people work, collaborate, and consume. Their role in shaping a smarter, more inclusive, and more sustainable world will be one of the defining forces of the global economy.
Trade ideas
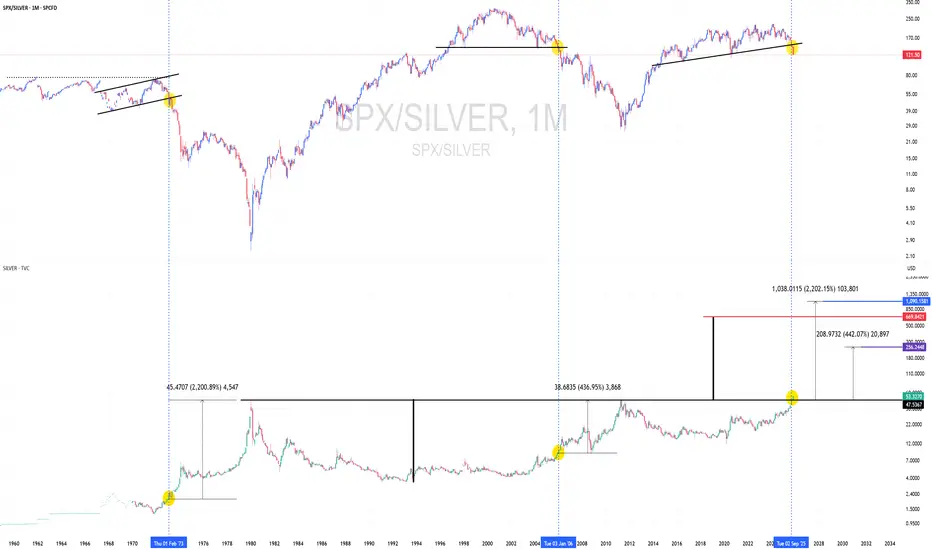
The bull market for silver is just getting started.Could be one of the most important charts out there right now.
The question is this: is this a 1970's bull market, or a 2000's one?
Silver targets: $250 or $1000? Cup and handle measured move is around $670.
US500 Remains BullishFundamental Analysis
US equities strengthened as the Fed rate-cut expectations solidified, which pushes bond yields lower and supports equity valuations. Markets now price in a high probability of a further cut in the coming Dec FOMC meeting. This sentiment reduces tightening fears and maintains the 'soft landing' narrative.
Corporate earnings remain broadly resilient. AI leaders and large-cap growth companies continue to underpin the US500 index despite recent volatility in some tech stocks. Meanwhile, macro data shows moderating growth and easing inflation. Investors are watching upcoming US data releases, including US PCE and US NFP, for confirmation of the disinflationary trend.
Technical Analysis
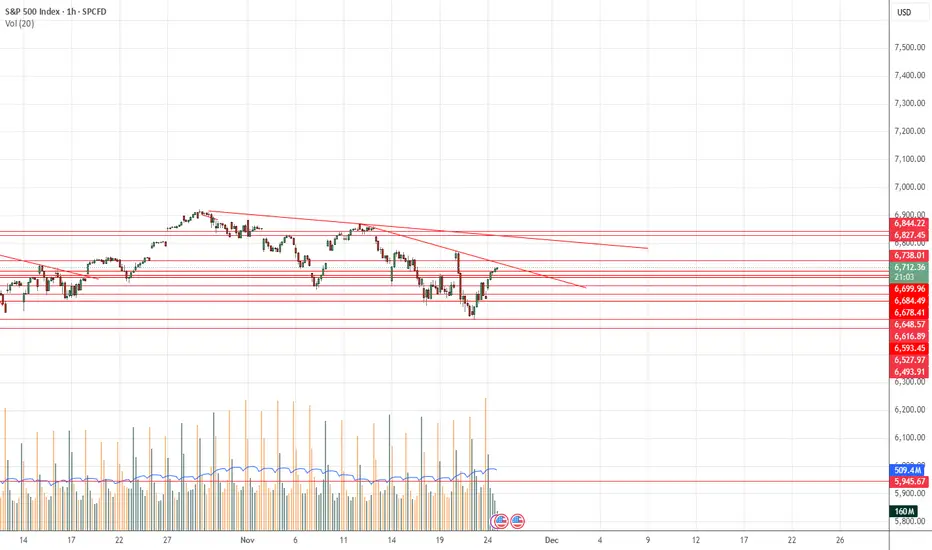
The US500 trades in a clear uptrend, with price holding above the recent resistance zone between 6,700 and 6,830. Price presses toward the old record high resistance at the 6,890–6,925 range. The index has strong support at approximately 6,515 points.
Dips toward the 6,700 area are currently viewed as 'buy-the-dip' zones. A decisive break above the prior record high would target the psychologically important 7,000 figure.
Sentiment Analysis and Outlook
Near term, the bias remains cautiously bullish: supportive the Fed expectations, solid earnings, and seasonal strength favor the upside. However, high valuations leave the index sensitive to any negative surprise in data or policy. A more hawkish tone from the Fed or unexpectedly strong inflation could trigger a pullback, but the base case assumes shallow corrections within the ongoing uptrend.
Analysis by Terence Hove, Senior Financial Markets Strategists at Exness

SPX/PA - SPX/Palladium ratio flashing a buy$SP:SPX/NYMEX:PA1!
Palladium is looking very good relative to equities currently, currently sitting at a ratio of over 4.50 : 1
I would be expecting to see this normalize around the 2.50-1.5 level, this would imply a significant period of outperformance of palladium relative to the SP500.
This coupled with the continued breakout of Silver and the strong performance of gold, comes together to form a very bullish outlook for palladium.

Double top!we see a double top broke mecline and descending to fill the gap. we migh see further down ward buyt since we have a demand there it may be imposible

Risks and Challenges of FII Dependence1. Market Volatility and Sensitivity
One of the primary risks of dependence on FIIs is the potential for heightened market volatility. FIIs are highly mobile investors who often chase short-term gains. Their investments can be withdrawn quickly in response to global economic changes, political events, or shifts in market sentiment. Such sudden inflows or outflows can cause sharp price fluctuations in equity and debt markets, leading to instability.
For instance, during global crises or periods of rising interest rates in developed markets like the U.S., FIIs may withdraw funds en masse from emerging markets, causing significant stock market crashes. In countries where domestic institutional investors and retail participation are relatively low, the volatility induced by FIIs can be particularly severe. This volatility not only affects investor confidence but can also have wider economic consequences, including reduced investment by domestic players and businesses.
2. Exchange Rate Risk
FIIs invest in local currency-denominated assets, but their base capital is often in foreign currency. This exposes countries to currency risk, as inflows and outflows of foreign capital influence exchange rates. When FIIs withdraw capital rapidly, it can lead to a depreciation of the local currency, raising the cost of imports and increasing inflationary pressures.
Moreover, currency depreciation can exacerbate the burden of external debt, as repayments become more expensive in local terms. Countries heavily reliant on FII inflows are therefore vulnerable to speculative attacks on their currency, especially during periods of global financial instability.
3. Short-Term Focus and Herd Behavior
FIIs often prioritize short-term returns over long-term investment. This short-term orientation can distort market functioning. During periods of market euphoria, FIIs tend to drive up stock prices, inflating asset bubbles. Conversely, during periods of uncertainty, they may withdraw investments abruptly, triggering sharp corrections.
The herd behavior of FIIs—where multiple institutional investors move in and out of markets simultaneously—can amplify market swings. For example, when FIIs collectively reduce exposure to emerging markets due to global risk aversion, it can result in panic selling, impacting domestic investors and businesses disproportionately. Such behavior makes financial markets more vulnerable to external shocks and reduces the effectiveness of domestic monetary policies aimed at stabilizing markets.
4. Dependency on Global Economic Conditions
Countries dependent on FII inflows are inherently exposed to global economic conditions beyond their control. Factors such as interest rate hikes in developed countries, geopolitical tensions, or changes in global liquidity conditions can influence FII behavior. For instance, if U.S. interest rates rise, FIIs might prefer to invest in U.S. assets, leading to capital outflows from emerging markets.
This dependence on global conditions creates a situation where domestic markets may experience booms and busts irrespective of local economic fundamentals. Policymakers may find it challenging to implement effective economic policies when capital flows are driven primarily by external factors.
5. Impact on Domestic Investment Patterns
Heavy reliance on FIIs can crowd out domestic institutional investors. When markets are dominated by FII activity, domestic investors may feel sidelined or discouraged from investing, leading to underdeveloped domestic capital markets. This can reduce the diversity of investment sources and create an over-reliance on foreign capital for market functioning.
Additionally, FIIs often prefer large-cap, highly liquid stocks, leaving mid-cap and small-cap companies underserved. This selective investment behavior can distort capital allocation in the economy, favoring sectors and companies that may not necessarily contribute most effectively to long-term economic growth.
6. Regulatory Challenges and Market Manipulation
FIIs, while generally regulated by both home and host countries, operate across multiple jurisdictions, making regulatory oversight complex. This cross-border nature can pose challenges for authorities in monitoring and managing sudden capital inflows or outflows.
Moreover, the influence of FIIs on market prices can sometimes enable market manipulation or speculative practices that disadvantage domestic investors. Regulatory authorities often have limited tools to manage or moderate such behavior, increasing systemic risk. Excessive dependence on FIIs without a robust regulatory framework can therefore undermine market integrity.
7. Macroeconomic Vulnerabilities
Beyond financial markets, FII dependence can create broader macroeconomic vulnerabilities. Sudden capital outflows can disrupt the balance of payments, weaken foreign exchange reserves, and trigger inflationary pressures. Countries that rely heavily on FII inflows to finance fiscal deficits or fund infrastructure projects are particularly exposed to these risks.
Additionally, overdependence on FIIs can reduce the incentive for countries to develop sustainable domestic savings and investment mechanisms. This structural weakness can hinder long-term economic stability and growth.
8. Political and Policy Risks
FIIs are sensitive not only to market conditions but also to political and policy developments in host countries. Changes in taxation, regulatory frameworks, or government policies can influence FII behavior. For example, increased capital gains taxes or stricter investment regulations may prompt FIIs to reduce exposure to a country, triggering capital outflows.
This interdependence can make domestic policy formulation challenging. Policymakers might feel constrained in pursuing reforms that are essential for long-term growth due to fear of scaring away foreign investors. Such a scenario can limit the sovereignty and flexibility of economic management.
9. Strategies to Mitigate FII Dependence
To reduce the risks associated with FII dependence, countries can adopt multiple strategies:
Diversification of Investors: Encouraging participation from domestic institutional investors, retail investors, and pension funds can reduce reliance on FIIs.
Strengthening Regulatory Frameworks: Improved oversight and regulation can mitigate the risks of speculative inflows and outflows.
Capital Flow Management: Tools such as prudential limits, taxes on short-term inflows, and macroprudential measures can moderate excessive volatility.
Developing Domestic Financial Markets: Building deeper and more liquid domestic markets attracts long-term investors and reduces vulnerability to FII behavior.
By balancing foreign capital with strong domestic investment participation, countries can enjoy the benefits of FIIs while minimizing the associated risks.
10. Conclusion
While Foreign Institutional Investors bring substantial benefits to emerging markets in terms of liquidity, capital inflows, and investment expertise, overdependence on their participation exposes economies to several risks. These include market volatility, exchange rate pressures, short-term investment biases, herd behavior, and macroeconomic vulnerabilities. Additionally, FIIs’ sensitivity to global and political conditions can constrain domestic policymaking and market stability.
Mitigating these challenges requires a multi-pronged approach, focusing on strengthening domestic investment, regulatory oversight, and financial market development. A well-balanced approach ensures that FIIs remain a source of growth rather than a potential source of instability. Ultimately, the goal is to harness foreign investment for sustainable economic development while safeguarding the domestic economy from external shocks and speculative risks.
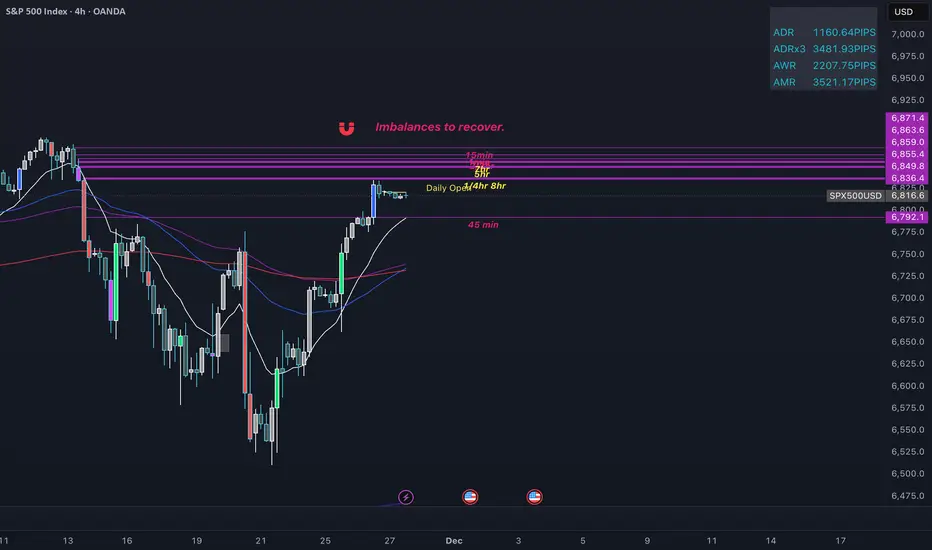
SPX500 Coiling Below Imbalance Cluster — Liquidity Buildup Befor🧠 Update:
SPX500 has pushed higher since the last update and is now consolidating just below a significant cluster of unfilled imbalances (vector candles) spanning multiple timeframes — 5min, 15min, 1hr, 2hr, 4hr, and 8hr.
This confluence of inefficiencies above is acting like a liquidity magnet. Price is currently hovering beneath this stack, potentially accumulating liquidity through sideways action. This type of coiling behavior often precedes a sharp expansion, especially when price respects support levels (e.g., Daily Open, 45min imbalance) without closing below.
Key Insight:
If price remains supported and continues ranging under this cluster, it's likely creating inducement (liquidity) above. Once enough buy-side liquidity is built up, a breakout targeting the imbalance zones becomes a high-probability scenario.
📍 Levels of Interest:
✅ Imbalance Zones:
5min / 15min / 1hr / 2hr / 4hr / 8hr vectors (magenta)
🟡 Daily Open Holding as Support
🔮 Projected Move: Coiling → Liquidity Grab → Imbalance Fill
Keep an eye on any sweep of local highs followed by bullish delta or volume confirmation — that could be the trigger.
Idea will be updated as structure develops further.
US500: Balancing Rate-Cut Optimism, AI Hype, and Growth RisksUS500: Balancing Rate-Cut Optimism, AI Hype, and Growth Risks
Technical Analysts
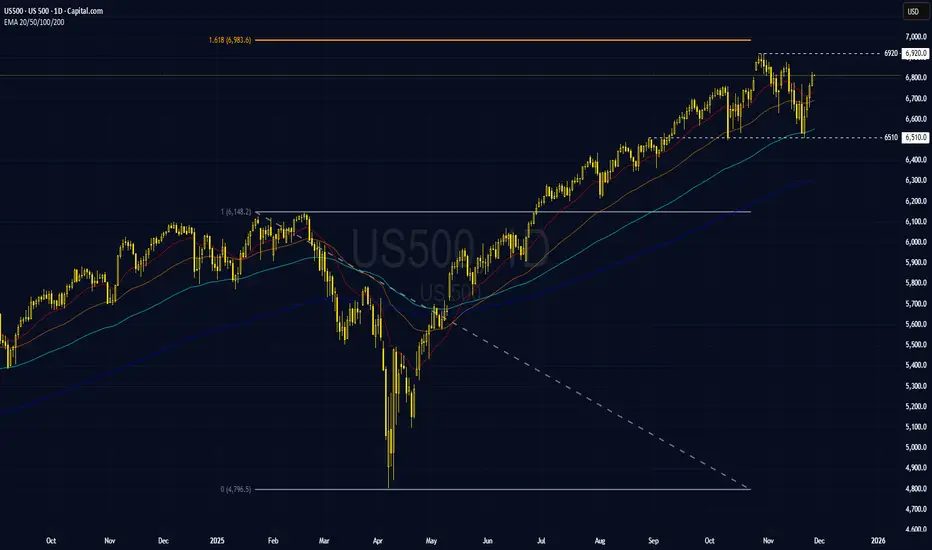
1. US500 bounced off EMA100 for the first time in six months, flagging a weak upside momentum and raising the potential of a corrective phase, with price likely to consolidate within the 6,510–6,920 range.
2. That said, the EMA stack remains positively aligned, keeping the broader bias to the upside.
3. A decisive break above the prior high near 6,920 would confirm uptrend continuation, opening the door to further gains.
4. Conversely, the 6,920–6,980 area is a key resistance zone; failure to clear this area would increase the odds of a pullback toward support around 6,510.
Fundamental analysis
The US500 is being driven by a mix of supportive and negative factors.
5. On the supportive side, expectations of a Fed rate cut in December help boost risky assets, while lower bond yields encourage investors to seek higher-yielding assets.
6. On the negative side, US economic data have shown signs of weakness, including labor market indicators and economic activities, alongside stretched valuations in tech stocks and concerns over AI-related spending.
7. All of these factors are likely to keep the US500 trading within a range and volatile, amid shifting fundamentals and an index that has already risen significantly since the start of the year. Any further rallies could be followed by profit-taking.
8. Key points to watch are major data releases such as labor market figures, inflation, and evolving expectations for a Fed rate cut in December.
Analysis by: Krisada Yoonaisil, Financial Markets Strategist at Exness
The World Economy’s Journey in the Trading Market1. Early Foundations: The Birth of Global Trade
Modern world trade began centuries ago with land routes, maritime exchanges, and colonial expansions. However, true economic globalization began after the Industrial Revolution.
Factories produced goods at scale, and countries required raw materials, capital, and new markets. This interdependence set the foundation for a global trading web.
Key Features of Early Global Trade
Simple Trading Infrastructure: Telegraphs, ships, and railways connected markets but at slow speeds by today’s standards.
Commodity Dominance: Coal, textiles, metals, and agricultural products drove trade volumes.
Gold Standard: Most countries pegged their currencies to gold, stabilizing international trade.
Though primitive compared to today, these early systems planted the seeds for a unified world economy.
2. Post-War Growth and the Era of Financial Globalization
After World War II, nations realized that economic cooperation was essential for peace and progress. This launched institutions like:
IMF (International Monetary Fund)
World Bank
GATT → WTO (World Trade Organization)
These bodies shaped trade rules, stabilized currencies, and opened markets.
The Bretton Woods System
The global economy operated under a fixed exchange-rate regime led by the U.S. dollar pegged to gold. This stable environment helped:
Facilitate international trade
Increase capital flows
Rebuild war-torn economies
When the system collapsed in 1971, floating exchange rates emerged, giving birth to modern currency trading.
3. Rise of Capital Markets: Stocks, Commodities, and Currencies Go Global
From the 1980s onward, deregulation and technology transformed world markets.
Key Milestones
Electronic trading platforms replaced floor trading.
Multinational corporations expanded production globally.
Derivatives markets (futures, options, swaps) exploded in size.
Hedge funds, investment banks, and pension funds became major market players.
Oil, gold, and commodity futures shaped inflation and energy policies.
This period marked a fundamental shift:
Trade was no longer limited to goods; money itself became the most traded commodity.
Foreign exchange (forex) grew into a $7-trillion-a-day market, making it the largest financial market in the world.
4. Digital Revolution: The 21st Century Trading Landscape
With the rise of the internet and high-speed computing, the early 2000s launched the digital trading era.
What changed?
Algorithmic trading (algo trading) began executing trades in milliseconds.
Online brokerages democratized market access.
Financial information became instant and global.
High-frequency trading (HFT) reshaped liquidity and market volatility.
Cryptocurrencies emerged as a parallel financial system.
Mobile trading apps made stock participation mainstream.
The world economy became deeply connected: A policy change in China or a tweet from a global leader could move markets worldwide.
Key Drivers of Modern Global Trade
Technology
Capital mobility
Global supply chains
Central bank policies
Cross-border investments
This phase also brought unprecedented speed—capital could fly across continents in seconds, impacting currencies, equities, commodities, and bond markets simultaneously.
5. The Shockwaves: Crises That Reshaped Global Markets
Major global events redefined the world economy’s trading journey:
2008 Global Financial Crisis
Triggered by U.S. mortgage collapse
Nearly crashed global banking
Led to quantitative easing (QE) era
Pushed interest rates to near zero
This event emphasized how interconnected global markets had become.
COVID-19 Pandemic (2020)
Disrupted supply chains
Crashed global demand initially
Fuelled the greatest monetary stimulus in history
Caused inflation waves across the world
Financial markets experienced extreme volatility, while digital and retail trading boomed.
Russia–Ukraine Conflict
Massive impact on energy, oil, natural gas, and wheat prices
Reshaped Europe’s energy landscape
Elevated geopolitical risk across global markets
Each crisis reshaped trading behavior, capital flows, risk perception, and investor psychology.
6. The Shift to Multipolar Trading: De-globalization Begins
From 2020 onwards, a new phase began: geoeconomic fragmentation.
The world is slowly drifting away from a U.S.-centric model into a multipolar system with major players like:
United States
China
India
European Union
Middle East (as energy and investment hubs)
Emerging Trends
Friend-shoring and reshoring of supply chains
Rise of regional trade blocs
Energy transition reshaping commodity markets
Local currency trade agreements (INR, yuan, ruble)
Digital currency experimentation by central banks (CBDCs)
Countries are building self-reliance while still operating within global markets—a hybrid model of globalization.
7. The Future: Where the World Economy and Trading Market Are Heading
The journey continues as new forces redefine global trade:
A. Rise of AI-Driven Markets
Artificial Intelligence is changing how markets function:
Real-time market prediction
Automated portfolio rebalancing
Sentiment analysis through big data
Algorithmic hedging strategies
Ultra-fast execution
Trading is becoming more data-driven, precise, and automated.
B. Green Energy and Commodity Supercycles
The global shift toward renewable energy is reshaping:
Lithium
Copper
Nickel
Rare earth metals
Natural gas
These commodities are becoming the new strategic assets of the 21st century.
C. Battle of Currencies: USD vs New Regional Powers
The U.S. dollar still dominates global trade, but new challenges are rising:
China promoting yuan settlement
India increasing INR trade agreements
Middle East exploring oil trade in non-USD currencies
Digital currencies becoming part of financial networks
While the dollar remains strong, the future will likely see multiple important currencies power trade.
D. Digital Assets and Blockchain
Crypto, tokenization, and blockchain-based systems are reshaping:
Settlement speed
Transparency
Cross-border payments
Decentralized finance (DeFi)
Tokenized commodities and real-world assets
This could become the next major phase of global trading.
Conclusion: A Journey That Never Stops
The world economy’s journey in the trading market is a story of continuous evolution—driven by technology, politics, crises, and the collective ambitions of nations and markets.
From simple trade routes to AI-based trading desks, from gold-backed currencies to digital assets, and from regional markets to global interdependence—the world of trade has expanded beyond imagination.
Today’s global economy is:
Faster
More interconnected
More competitive
More volatile
More data-driven
And the journey ahead promises even greater transformation as nations redefine alliances, technology reshapes markets, and investors navigate an increasingly complex global landscape.


SPX - Setups for both Long and Short SPX is approaching a trendline that will give us direction is which way to trade. A break above this line we can look for longs, any type of rejection such as bearish engulfings on the line, is a good risk short trade. Feel free to drop opinions!

US500 Outlook: Upside Bias Persists.Fundamental Analysis: Macro Drivers
Market participants are currently expressing renewed confidence in Federal Reserve rate cuts, driving a risk-on sentiment that is the primary support for US equity valuations and the US500. Lower interest rates decrease discount rates for future earnings, which benefits growth-oriented sectors like technology and consumer discretionary.
The US500’s rally benefits from the prevailing market view that the Fed will cut interest rates, a primary factor reducing the discount rate and lifting asset valuations. Additionally, earnings strength from mega-cap technology companies like Nvidia (NVDA), Meta Platforms (META), and others reinforces market optimism and risk appetite. Although US job growth softened, recent payrolls data exceeded expectations, and falling inflation supports the case for monetary easing. Focus turns to further US economic data to confirm growth risks
Technical Analysis: Breakout and Targets
US500 recently broke above the psychological resistance at 6,770, indicating strong upward momentum. The price is currently consolidating gains near this former resistance. Should the rally continue, the next major upside target for US500 is the resistance at 6,830.
Conversely, falling below the 6630-6700 range could lead US500 to retest the subsequent support at 6,515. US500 will likely find initial support near 6630 if a minor pullback occurs
Outlook: Upside Bias Persists
With dovish Fed expectations and continued strong performance from the technology sector, the US500 outlook maintains an upside bias. Closing above 6,830 could prompt US500 to retest the following resistance at 6,925. However, volatility may increase as investors watch for any major shift in the economic environment or a change in the Fed's guidance.
Analysis by Terence Hove, Senior Financial Markets Strategist at Exness.


US500How to become successful in forex and stock trading: 1.Master fundamentals and technical analysis. 2,Build and follow a solid trading plan. 3.Apply strict risk management (1–2% rule). 4.Stay disciplined—control fear and greed. 5.Record and analyze every trade. 6.Focus on high-quality setups only. 7.Diversify across assets and markets. 8.Keep evolving—study, adapt, and grow daily.

$SPY Bullish structure on lower time frames looks dangerousAMEX:SPY Bullish structure on lower time frames looks dangerous.
Expect to retrace most of it today or tomorrow.
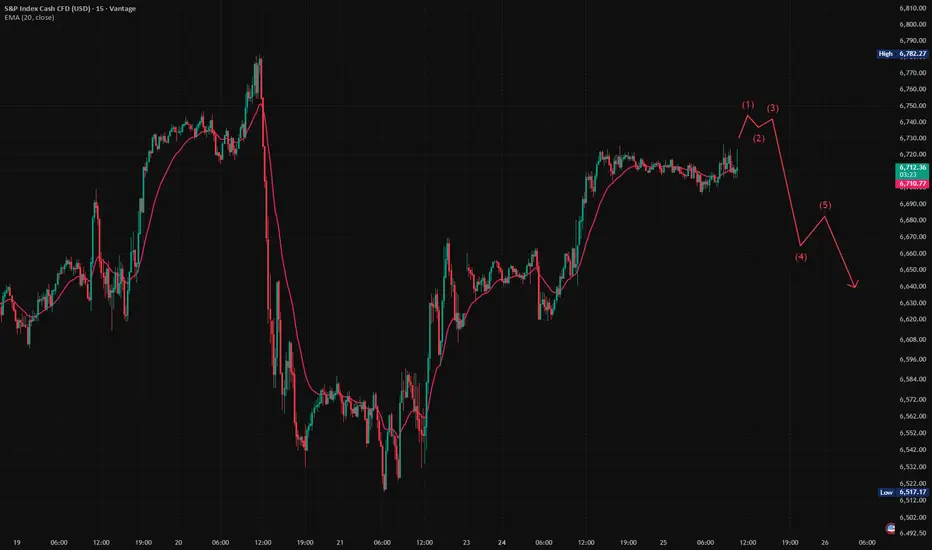
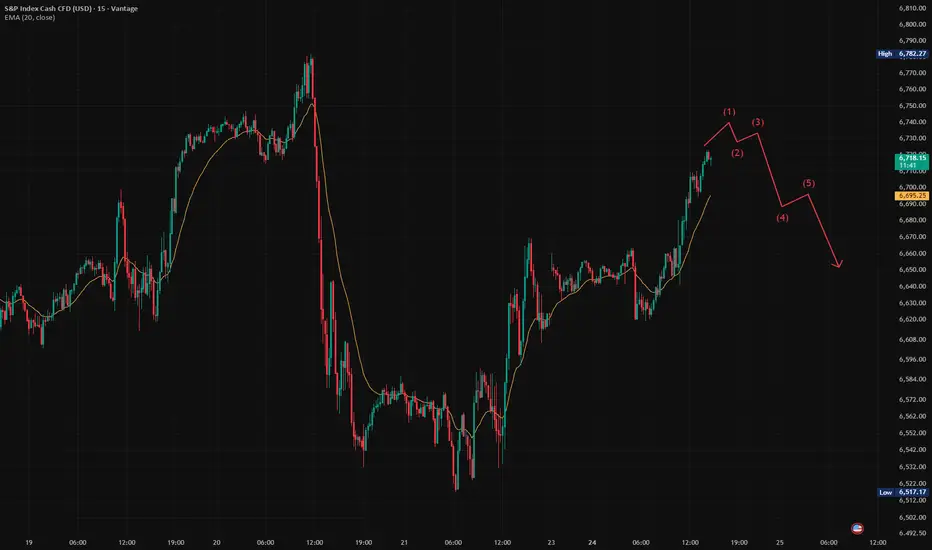
SPX500 Short
Deep crab pattern completes on M15, mapping a potential reversal zone.
Multiple tops formed on M15 and M30 at the same area, reinforcing overhead supply from the prior day’s high that price could not break.
RSI reached overbought on M15 and M30, indicating crowded long positioning.
Approximately 20 points of RSI bearish divergence across M15 and M30, consistent with a weakening advance.
H4 has turned down after last week’s rebound and now aligns with a downside continuation view.
Daily slope is flattening and price is trading beneath it, suggesting the early stages of a broader reversal can develop if sellers follow through.
Bias is short of the reversal zone identified by the deep crab and repeated tops.
Stop loss set at 50 pips to cap risk if resistance fails.
First target at 6,600, which is 100 pips from entry, with room to manage partials at nearby structure if momentum confirms.
Several US indices and other global indices are printing similar topping behavior and momentum fades, adding intermarket confluence to the short idea.

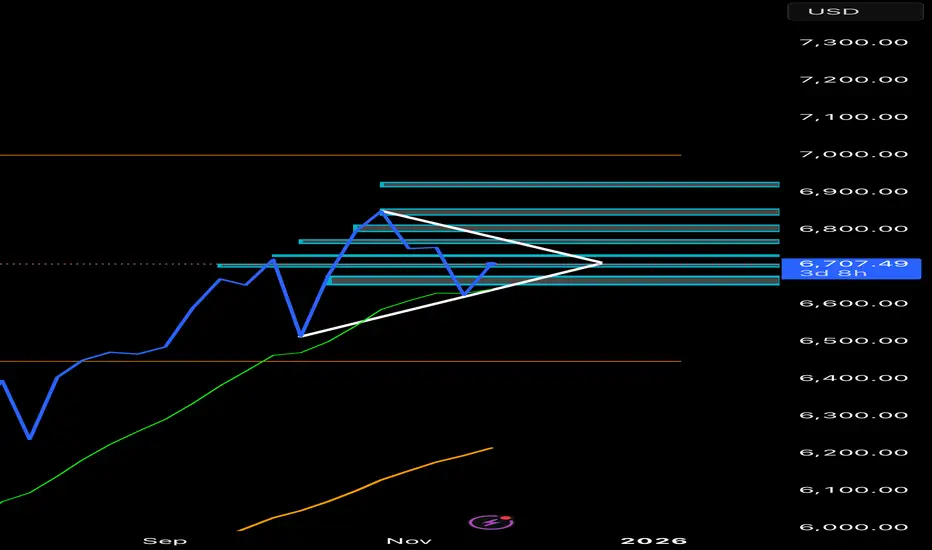
Weekly Bullish PennantPossible Bullish pennant forming on weekly.
Looking for price to keep forming pennant.
Could see a possible breakout December or January.
S&P500 rally to continue? The S&P 500 extended its rebound yesterday, rising +1.55% for its best session in six weeks and +2.54% over two days, helped by growing expectations of a Fed rate cut in two weeks. Sentiment was also lifted by renewed tech optimism and headlines suggesting progress in Ukraine ceasefire talks, which supported equities, credit, and bonds.
In tech, Nvidia fell on reports Meta may shift billions in AI-chip spending toward Google, while Alphabet gained on stronger AI momentum. Geopolitical risk remains elevated as Russia and Ukraine traded heavy fire despite diplomatic activity, but markets are focusing on the possibility of de-escalation.
Overall: Momentum remains constructive for the S&P today, with supportive macro drivers, but tech dispersion and geopolitics could create intraday volatility.
Key Support and Resistance Levels
Resistance Level 1: 6770
Resistance Level 2: 6800
Resistance Level 3: 6823
Support Level 1: 6660
Support Level 2: 6640
Support Level 3: 6613
This communication is for informational purposes only and should not be viewed as any form of recommendation as to a particular course of action or as investment advice. It is not intended as an offer or solicitation for the purchase or sale of any financial instrument or as an official confirmation of any transaction. Opinions, estimates and assumptions expressed herein are made as of the date of this communication and are subject to change without notice. This communication has been prepared based upon information, including market prices, data and other information, believed to be reliable; however, Trade Nation does not warrant its completeness or accuracy. All market prices and market data contained in or attached to this communication are indicative and subject to change without notice.

Currency Peg Rates and Their Role in the Global Market1. What Are Currency Pegs?
A currency peg is an agreement by a government or central bank to maintain its currency at a fixed exchange rate relative to another currency. Common anchors include:
US Dollar (USD) – most dominant
Euro (EUR) – used by countries in Europe or those influenced by EU trade
A basket of currencies – used by nations wanting diversified stability
Examples include:
Hong Kong dollar peg to USD
Saudi riyal peg to USD
Danish krone peg to Euro
In a pegged system, the central bank must intervene in the forex market—buying or selling foreign reserves—to maintain the peg.
2. Why Countries Use Currency Pegs
A. To Promote Trade Stability
Trade depends heavily on predictable currency values. When a country pegs its currency to that of a major trading partner, exporters and importers face fewer exchange-rate risks. This stability helps:
Boost long-term trade agreements
Encourage foreign direct investment (FDI)
Reduce transaction costs
For example, Gulf countries selling oil in USD benefit from a USD peg since their export revenues stay stable.
B. To Control Inflation
Countries with historically volatile monetary systems use pegs to “import stability” from stronger economies. Pegging to a disciplined currency forces domestic monetary policy to align with the anchor country’s stability. This helps:
Reduce hyperinflation
Maintain price stability
Build investor trust
Argentina, for instance, used a USD peg in the 1990s to curb runaway inflation.
C. To Attract Foreign Investment
Foreign investors prefer stable exchange rates. Pegs give clarity and reduce forex risk, which is appealing for:
Portfolio investors
Foreign companies setting up factories
Global banks
Stable currencies reduce uncertainty and encourage long-term investment.
D. To Protect Small or Open Economies
Small economies with limited export diversity or unstable political environments benefit greatly from a fixed currency. Pegs help maintain:
Financial order
Market confidence
Predictable business conditions
This is why many island nations and resource-dependent economies use fixed exchange rates.
3. How Currency Pegs Work in the Global Market
A. Central Bank Intervention
To maintain the peg, the central bank must buy or sell foreign reserves.
If the domestic currency weakens, the central bank sells foreign reserves to support it.
If it strengthens, the central bank buys foreign currency to prevent appreciation.
This mechanism keeps the domestic currency within a defined band.
B. The Role of Foreign Exchange Reserves
Countries with pegs must maintain large forex reserves. These reserves act as a buffer to defend the peg during market volatility.
China, Saudi Arabia, and Hong Kong maintain significant reserves for this reason.
C. Impact on Global Capital Flows
Pegs influence how money moves across borders. A stable peg can attract capital inflows, while a weak or unsustainable peg can trigger:
Speculative attacks
Rapid capital outflows
Market panic
The 1997 Asian Financial Crisis is a classic example where unsustainable fixed rates caused speculative attacks.
4. Advantages of Currency Pegs in the Global Market
A. Stability for Trade and Investment
Currency pegs reduce exchange-rate volatility, supporting international trade and long-term contracts.
B. Confidence Building
Investors and trading partners trust economies whose currencies behave predictably.
C. Lower Inflation
Pegs can anchor domestic prices to those of more stable economies.
D. Strategic Trade Advantages
Countries can peg at undervalued levels to maintain export competitiveness. China historically used a partially managed peg for this purpose.
5. Challenges and Risks Associated with Currency Pegs
A. Loss of Monetary Policy Independence
The biggest drawback is that a country cannot freely decide its interest rates. It must follow the monetary policy of the anchor country to maintain the peg.
This can be problematic during domestic recessions or inflationary pressures.
B. Requirement of Large Forex Reserves
Defending a peg requires massive reserves, which is costly. Without sufficient reserves, the peg becomes vulnerable.
C. Vulnerability to Speculative Attacks
If traders believe a peg is unsustainable, they can short the currency. This can collapse the peg, as seen in:
Thailand (1997)
Mexico (1994)
Argentina (2001)
D. Economic Distortions
A peg can create artificial stability. If the currency is pegged too high or too low, it can misrepresent true economic conditions, leading to:
Trade imbalances
Over-reliance on imports
Asset bubbles
6. Currency Pegs and Global Economic Events
A. During Oil Price Shocks
Oil-exporting countries with USD pegs remain stable because oil is traded globally in dollars. Pegs help smooth revenue fluctuations.
B. During Financial Crises
Some countries break their pegs during crises to regain monetary control, while others defend their pegs to maintain confidence.
C. During Global Inflation Waves
When the anchor currency experiences inflation (e.g., USD inflation cycles), countries pegged to it import inflation as well. This can create stress on domestic economies.
7. How Pegs Influence Global Trade Dynamics
Currency pegs can make countries more competitive in global markets. For example:
If a currency is pegged at a lower level, exports become cheaper.
If pegged too high, imports become cheaper but exports suffer.
This can trigger global reactions, including tariff threats or currency war accusations.
8. The Future of Currency Pegs
Even as digital currencies and floating rates dominate modern finance, currency pegs continue to play a vital role. Many countries rely on them for stability, while some use hybrid systems:
Managed float with a peg band
Basket-based pegging
Pegged but adjustable systems
With growing geopolitical tensions, shifts in trade alliances, and rising interest-rate cycles, pegs will remain influential tools in shaping global markets.
Conclusion
Currency peg rates are powerful tools that shape global economic behaviour. By tying a currency to a stable or strategically chosen anchor, countries can enhance trade stability, control inflation, and attract investment. However, they also face challenges such as loss of monetary independence, speculative risks, and heavy reliance on foreign reserves.
In the global market, currency pegs are both stabilizers and potential sources of volatility—depending on how well they are maintained. Their importance will continue as countries navigate an increasingly interconnected and uncertain economic environment.
spx levels for this weekright now it's making lower lows, break above 6771 level bulls will catch the run
$SPY bullishness today is not looking goodThis is a clear trading range. Trading ranges always have on thing in common and that is that they are usually keep going back to the middle.
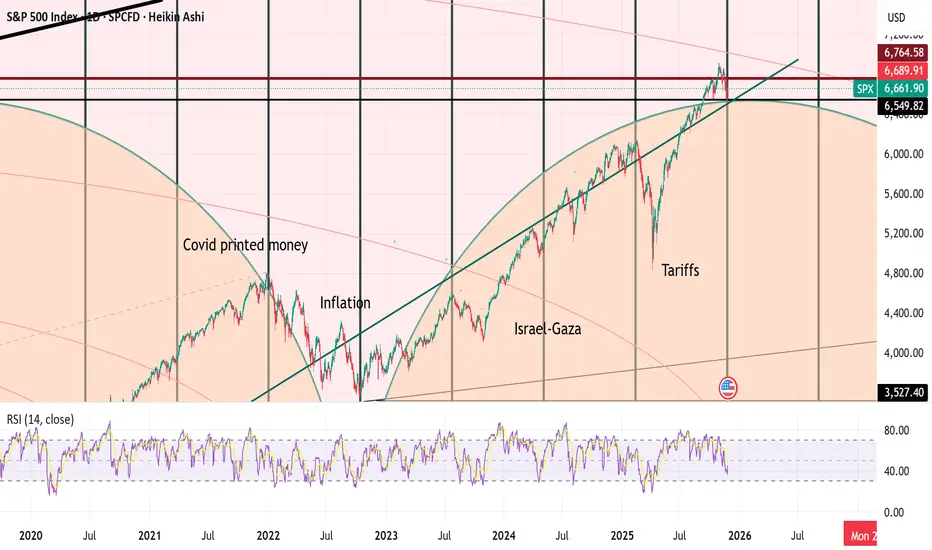
Forget the Crash Talk – SPX Is Ready to Climb
I have seen something really interesting: I have been observing the daily chart and I saw that every 198 bars Sp500 maks major turning points.
The S&P 500 just closed a 198-bar cycle on the daily chart—a pattern that has historically marked major turning points. Last Friday (Nov 21) was that moment.
While headlines scream recession and some see in the monthly a possible head-and-shoulders setup pointing to a 1929-style collapse, I see something different: a structural bottom and the start of a new bullish leg.
Cycles don’t lie. Every time this rhythm completes, SPX moves decisively—and this time, the setup favors the upside.
📈 My view: The market is gearing up for a rebound.