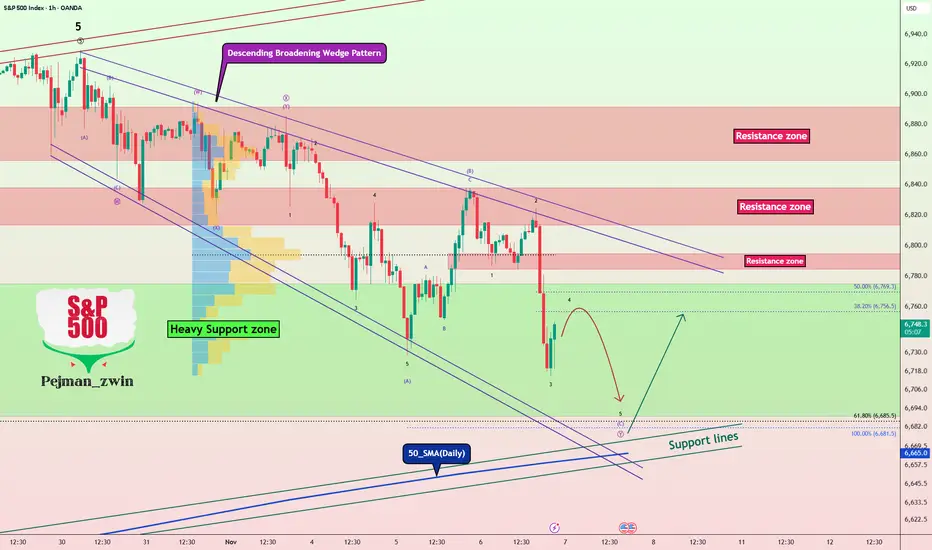
S&P 500 at Make-or-Break Level – Bulls’ Last Chance!As I expected in the previous idea , the S&P 500 index ( SP:SPX ) has reached its target.
Given that the S&P 500 index has a strong correlation with other financial markets, especially Bitcoin ( BINANCE:BTCUSDT )—sometimes even tracking them candle-by-candle—it's a good idea to pay extra attention to the S&P 500 index these days.
Currently, the S&P 500 index is moving in a Heavy Support zone($6,775_$6,689) , although it entered this zone with a lot of downside momentum.
From a classic technical analysis perspective, there's still a chance that the descending broadening wedge pattern will hold. As long as this pattern isn't invalidated, we can still hope for at least a short-term bullish move.
From an Elliott Wave perspective , it seems like the S&P 500 index is completing the microwave 4 of the microwave C of the main wave Y within the descending broadening wedge.
I expect that after the next small dip, the S&P 500 index will start rising again from near the lower boundary of the wedge, the 50_SMA(Daily) , and Support lines .
Note: If the S&P 500 index falls below about $6,650, we should expect further downside. So let's keep an eye on that level.
Please respect each other's ideas and express them politely if you agree or disagree.
S&P 500 Index Analyze (SPX500USD), 1-hour time frame.
Be sure to follow the updated ideas.
Do not forget to put a Stop loss for your positions (For every position you want to open).
Please follow your strategy and updates; this is just my Idea, and I will gladly see your ideas in this post.
Please do not forget the ✅' like '✅ button 🙏😊 & Share it with your friends; thanks, and Trade safe.
Trade ideas
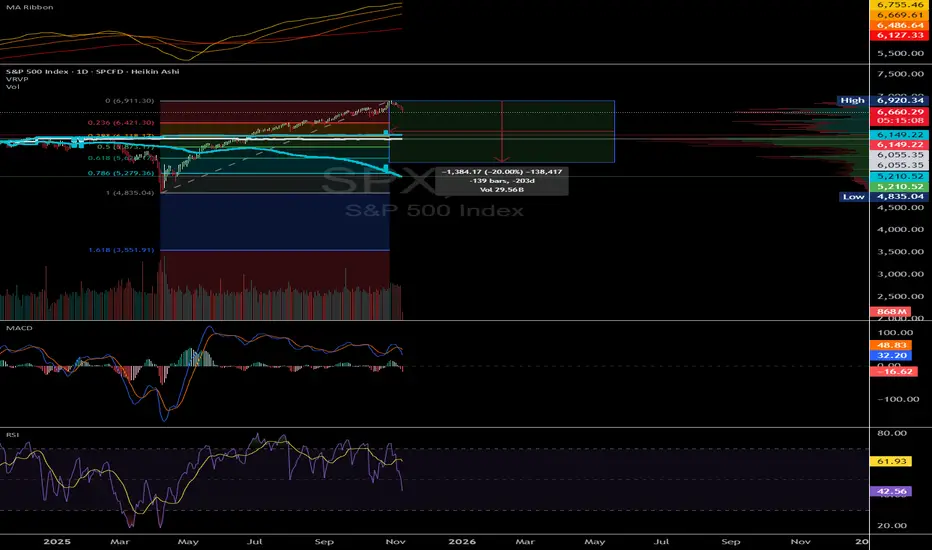
SPY/SPX Bear Market, liquidity speedbumps, and key levels SP:SPX AMEX:SPY
The current setup mirrors the prior rally from trough to peak, projecting a speculative 20% bear market range.
From here, I’m watching for a push into 6100–6200 that’s where strong resistance should form. If we reject that zone, it likely marks the start of a deeper unwind.
A quick overshoot toward 6000 wouldn’t surprise me and could trigger a dead cat bounce, but unless buyers regain control above 6200, the bounce should fade.
At 20% we'll be around $5550, where we’d likely find structural support. However a market shock around there could allow it to drop to $5200 if something happens while we're in that zone.
I don't think we'll go lower than $5000 moving forward

US500's Volatility ContinuesThe US500's volatility at this week is primarily driven by the reversal of the Artificial Intelligence (AI) rally that has propelled the index since April. The core of this weakness lies in the tech mega-cap stocks.
Fundamental Analysis
The market's structural support is encountering short-term uncertainty:
Valuation Concerns: Investors are questioning if the AI-fueled surge has gone too far, leading to profit-taking and caution, especially after a year of strong performance.
Data Vacuum: The longest US government shutdown in history continues to limit the release of key economic data, clouding the outlook for interest rates and injecting uncertainty into the market.
Corporate Fundamentals remain Solid: Despite the volatility, the underlying support is maintained by solid corporate earnings and the prospect of eventual Fed easing.
Technical Analysis
The US500 is currently undergoing a technical correction driven by sector shakeouts in tech, but strong underlying buying interest at key retracement levels suggests the medium-term bull market is technically intact. A move above 6,830 is required to resume the uptrend.
Key Levels
6,640 Psychological and short-term support area.
6,500 A decisive break below this level would warn of a deeper correction.
6,830 A sustained move above this level opens the door to new highs.
7,000 A major psychological level.
Outlook
The market is in a phase of necessary consolidation. While short-term volatility is high, the consensus view suggests fundamental weakness has not materialized enough to trigger a major crash.
Immediate Outlook: Expect continued choppy and volatility. The focus shifts to private economic indicators and any news regarding the government shutdown.
Longer-Term View: Analysts generally "don't see any big correction on the horizon" until year-end, as long-term investors continue to focus on solid earnings and the eventual benefit of lower rates.
Analysis by Terence Hove, Senior Financial Markets Strategist at Exness
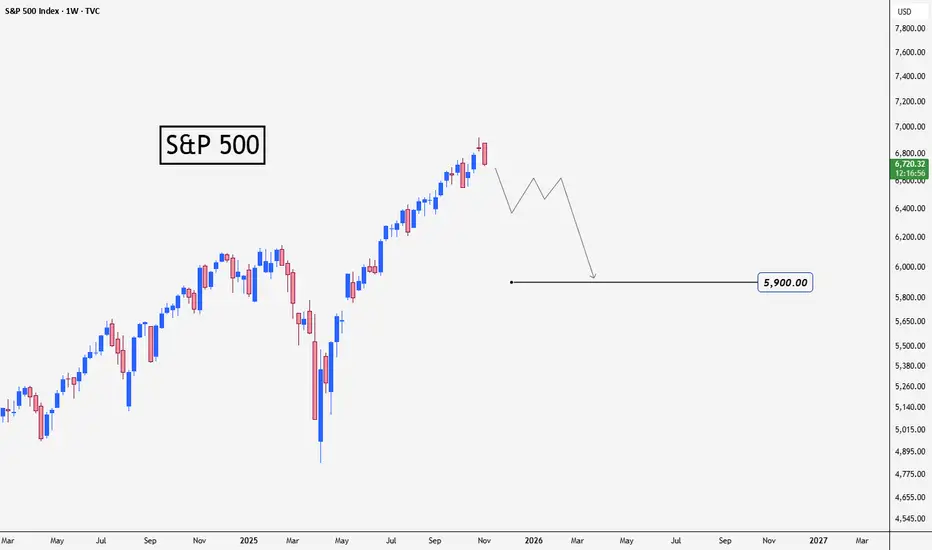
S&P 500 Predict the next waveHello everyone, I hope you are all well.
I wanted to share my prediction for the next wave of the S&P 500 index. It's as shown in the chart
The chart is on the weekly timeframe. I expect the decline to last for a period of time that could reach 6 months or more
This is not investment advice; please take full responsibility for your buying and selling decisions.
Warning: Be careful not to use this idea with leverage, as you could lose all your money
Nov 7th bull trap to 18ma is possibleI think another ABC is going to appen with the C starting after open. A rally for most of the day is what I'm thinking. if it just falls, I'm obviously wrong. A test of the 18ma would be the goal, but at that point I think it would be a short entry. Gold still bear flagging. Oil, back above the 18ma again - looks like accumulation. BTC perhaps lower, but it should also rally with the SPX if I'm correct.

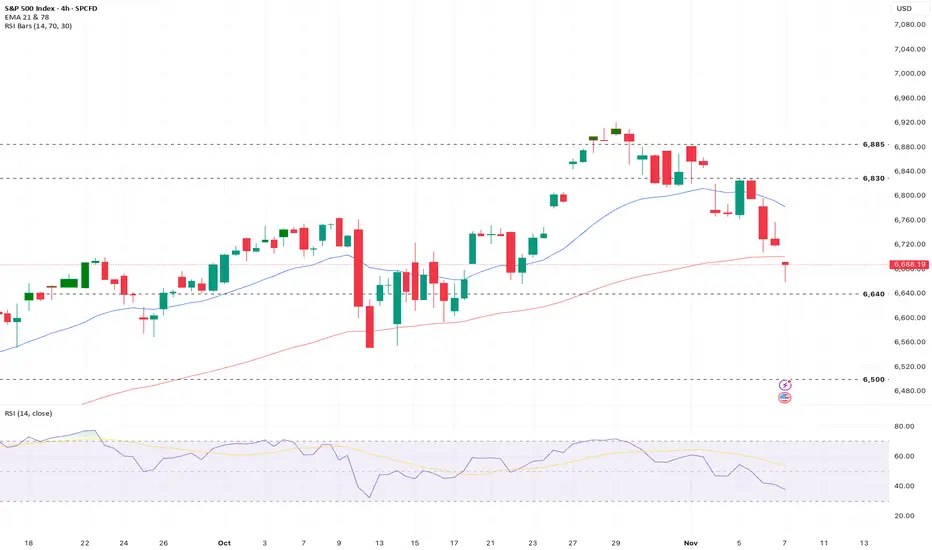
SPX500 – Bearish Momentum Active | Eyes on 6670 SupportSPX500 | Overview
Wall Street futures struggled for traction on Friday, wrapping up a volatile week marked by concerns over the U.S. economic outlook and stretched tech-sector valuations.
After a sharp 1.5% decline yesterday, the index continues to trade under bearish pressure, with potential for a retest before the next move.
Technically:
The price remains volatile, with a retest toward 6754 still possible.
As long as the price stays below 6754, downside momentum could continue toward 6706 and 6670.
A confirmed 1H close below 6706 would strengthen bearish pressure, targeting 6670 → 6626 → 6580.
However, if the price stabilizes above 6754, short-term bullish momentum may return, targeting 6775 and 6814.
Pivot Zone: 6723 – 6706
Resistance: 6754 · 6775 · 6814
Support: 6670 · 6626 · 6580
Outlook:
SPX500 remains bearish while below 6754, with risk of continued correction toward 6670–6626.
Only a 1H close above 6754 would signal recovery toward 6775–6814.

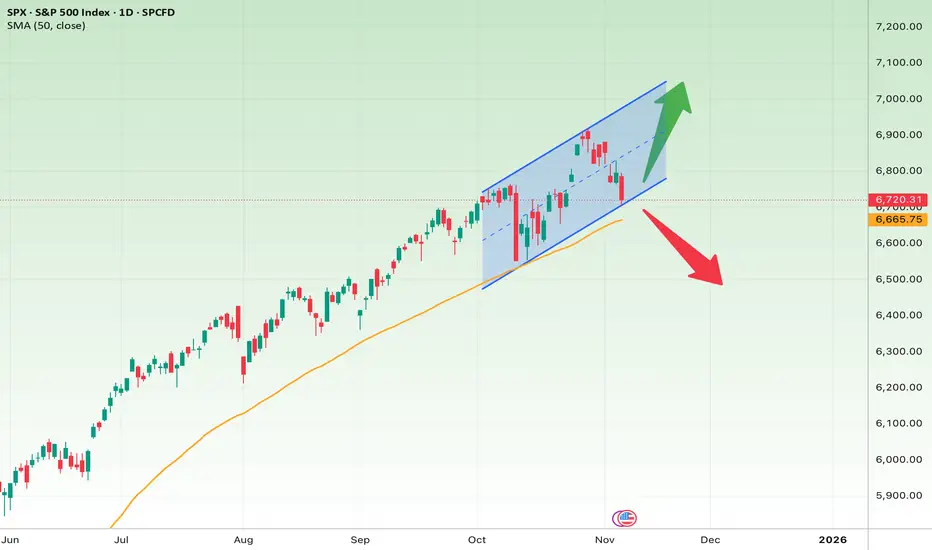
S&P 500 Index (SPX) — Daily Chart AnalysisThe S&P 500 is moving within a well-defined ascending channel on the daily timeframe. After touching the top of the channel, the index entered a short-term correction and is now testing the mid-channel area and the 50-day moving average (around 6,665) — both key support zones.
Short-Term Outlook (next few days to weeks)
If the index holds above 6,660–6,700 and starts to rebound, the next target would likely be the 6,950–7,000 resistance area near the top of the channel.
However, if 6,650 breaks and the price closes below it, a deeper pullback toward 6,450 or even 6,300 could follow.
• Bullish target: 6,950–7,000
• Bullish stop loss: Below 6,650
• Bearish target: 6,450–6,300
• Bearish stop loss: Above 6,800
Mid-Term Outlook (1–3 months)
The broader trend remains bullish, as the 50-day moving average still slopes upward. As long as the price stays above this line, the market structure remains positive.
If the upward channel holds, the next potential targets lie between 7,100 and 7,200.
But a confirmed breakdown below 6,650 could signal a shift in momentum toward a larger correction.
• Bullish mid-term target: 7,100–7,200
• Mid-term stop loss: Below 6,650
Summary :
The 6,660–6,700 range is the key zone to watch:
• Holding above it → continuation of the uptrend toward the channel’s upper boundary
• Breaking below it → possible decline toward the lower channel or deeper correction
In short, this area acts as the line between continuation and correction for the S&P 500.
SPX updated for Friday 7th NovemberNot quite a break of trend as yet
Ya really wants into 6700 and below to scare of the bulls
Lrts see what happens

Understanding Different Types of Global Assets1. Equities (Global Stocks)
Equities represent ownership in a company and are one of the most popular asset classes worldwide. When investors buy shares of a company listed on a stock exchange, they become partial owners and are entitled to a share of profits through dividends and capital appreciation.
Global equity markets include major stock exchanges such as the New York Stock Exchange (NYSE), London Stock Exchange (LSE), Tokyo Stock Exchange (TSE), and National Stock Exchange of India (NSE). Each region offers exposure to different industries and economic cycles.
Developed Market Equities: These include companies from economically stable nations like the U.S., Japan, the U.K., and Germany. They are considered safer but often yield moderate returns.
Emerging Market Equities: Countries like India, Brazil, and China offer higher growth potential but with increased volatility and political risk.
Frontier Market Equities: These are smaller, less developed economies (such as Vietnam or Kenya) with higher risk but potential for exponential growth.
Equity investors often use exchange-traded funds (ETFs) or mutual funds to gain diversified exposure across multiple markets without the need to directly buy international stocks.
2. Fixed-Income Securities (Global Bonds)
Bonds are debt instruments issued by governments, corporations, or financial institutions to raise capital. In return, investors receive periodic interest payments and the principal upon maturity. Global bond markets are vast and serve as a backbone of the financial system, providing stability and predictable income.
There are several types of global bonds:
Sovereign Bonds: Issued by national governments (e.g., U.S. Treasury Bonds, German Bunds, Indian Government Bonds). They are often seen as low-risk investments.
Corporate Bonds: Issued by multinational companies to fund operations or expansion. These carry higher yields but greater default risk.
Municipal and Supranational Bonds: Issued by local governments or institutions like the World Bank or IMF for development projects.
Investors in global bonds must consider interest rate differentials, currency fluctuations, and credit risk. For instance, a bond issued in Japanese yen might perform differently when converted back to U.S. dollars depending on exchange rate movements.
3. Commodities
Commodities are physical goods such as metals, energy resources, and agricultural products that serve as essential inputs in global production. They are traded on exchanges like the London Metal Exchange (LME), Chicago Mercantile Exchange (CME), and Multi Commodity Exchange (MCX) in India.
The main commodity categories include:
Energy Commodities: Crude oil, natural gas, and coal dominate global trade. Oil prices, in particular, affect inflation, production costs, and currency values worldwide.
Precious Metals: Gold, silver, and platinum are seen as “safe-haven” assets that investors flock to during economic uncertainty.
Industrial Metals: Copper, aluminum, and zinc are key materials for manufacturing and construction.
Agricultural Commodities: Wheat, corn, coffee, and cotton play crucial roles in global food supply chains.
Commodity prices are highly sensitive to geopolitical tensions, supply-demand imbalances, and natural events like droughts or hurricanes. Investors can access commodities through futures contracts, ETFs, or commodity-focused mutual funds.
4. Currencies (Foreign Exchange or Forex Market)
The foreign exchange (forex) market is the largest financial market in the world, with daily trading volumes exceeding $7 trillion. Currencies are traded in pairs, such as EUR/USD or USD/JPY, reflecting the relative value of one currency against another.
Forex trading allows investors to speculate on currency movements or hedge international investments against exchange rate risk. For example, a U.S. investor with European assets may buy euros to protect against a weakening dollar.
Major currency pairs include:
Major Pairs: USD/EUR, USD/JPY, GBP/USD — most liquid and widely traded.
Minor Pairs: Non-USD combinations like EUR/GBP or AUD/JPY.
Exotic Pairs: Combine a major currency with one from an emerging economy, such as USD/INR or EUR/THB.
Forex markets are influenced by interest rates, inflation, trade balances, and political stability. Central banks also play a crucial role in currency valuation through monetary policies and interventions.
5. Real Estate (Global Property Markets)
Real estate is another essential global asset class that provides income through rent and appreciation in property value. Investors can access real estate directly (by buying physical property) or indirectly (through Real Estate Investment Trusts – REITs).
Global real estate markets vary greatly by region:
Developed Markets: Properties in cities like New York, London, or Singapore offer stability but are expensive.
Emerging Markets: Cities in India, Vietnam, or Brazil provide higher yields but with greater risk due to economic and legal uncertainties.
Real estate investments are influenced by interest rates, urbanization trends, and government policies. REITs make it easier for investors to diversify globally without the challenges of direct ownership.
6. Alternative Assets
Alternative investments include asset classes outside traditional stocks and bonds. These are often less liquid but can provide diversification and high returns.
Common types of alternatives include:
Private Equity: Investments in privately held companies before they go public.
Hedge Funds: Pooled funds using complex strategies like long/short positions or arbitrage.
Venture Capital: Early-stage investments in startups with high growth potential.
Infrastructure Assets: Investments in public utilities, transportation, and renewable energy projects.
Collectibles: Art, wine, or rare coins can also serve as alternative assets with niche market value.
Institutions and high-net-worth investors use alternatives to hedge market volatility and achieve uncorrelated returns.
7. Digital Assets (Cryptocurrencies and Tokenized Assets)
In the last decade, digital assets have revolutionized global investing. Cryptocurrencies like Bitcoin, Ethereum, and Solana are decentralized digital currencies that operate on blockchain technology. They allow peer-to-peer transactions without intermediaries like banks.
Beyond crypto, tokenization enables real-world assets such as real estate, art, or stocks to be represented digitally on blockchain networks. This enhances liquidity, transparency, and accessibility.
However, digital assets carry high volatility and regulatory uncertainty. Governments and financial institutions are gradually shaping frameworks to integrate them into mainstream finance through Central Bank Digital Currencies (CBDCs) and regulated exchanges.
8. Derivatives
Derivatives are financial instruments whose value derives from an underlying asset such as stocks, bonds, commodities, or currencies. Common derivatives include futures, options, swaps, and forwards.
They are used primarily for hedging (risk management) or speculation. For instance, a company importing oil may use futures contracts to lock in prices and protect against future price increases. Traders, on the other hand, may speculate on these price changes for profit.
Derivatives markets are essential for global financial stability, allowing participants to manage exposures effectively, though misuse can amplify systemic risk.
9. The Importance of Diversification Across Global Assets
Diversification is the cornerstone of smart investing. By spreading investments across multiple asset classes and geographies, investors reduce exposure to regional downturns or sector-specific risks. For example, when global equities face a correction, safe-haven assets like gold or U.S. Treasuries often rise, cushioning overall portfolio losses.
A balanced global portfolio might include:
40% equities (across regions),
30% bonds,
10% commodities,
10% real estate,
10% alternatives or digital assets.
This mix provides both growth and stability in an uncertain global environment.
Conclusion
Understanding the different types of global assets is fundamental for building a resilient and diversified portfolio. Each asset class — equities, bonds, commodities, currencies, real estate, alternatives, digital assets, and derivatives — behaves differently under various economic conditions.
The key to successful global investing lies in recognizing the interconnections among these assets, managing risks intelligently, and adapting to market shifts driven by globalization, technology, and geopolitics. As financial markets evolve, investors who understand the structure and behavior of global assets will be better positioned to capture opportunities and weather uncertainties with confidence.
S&P 500: Multiple Bearish Signals AlignS&P 500 index chart shows multiple bearish signals on the weekly time frame
1. The price has hit the upside of the long-term uptrend and it was rejected
2. Bearish Reversal Evening Star Candlestick pattern appeared on the top
3. RSI has built the Bearish Divergence as it did not confirm the new peak
There are 3 support levels:
1. Double support of trend channel's mid-line and previous top around $6,147
2. Bottom of the channel between $5,300 and $5,400
3. "Die-hard" multiple support that was built since 2021 around $4,819
What are your thoughts?

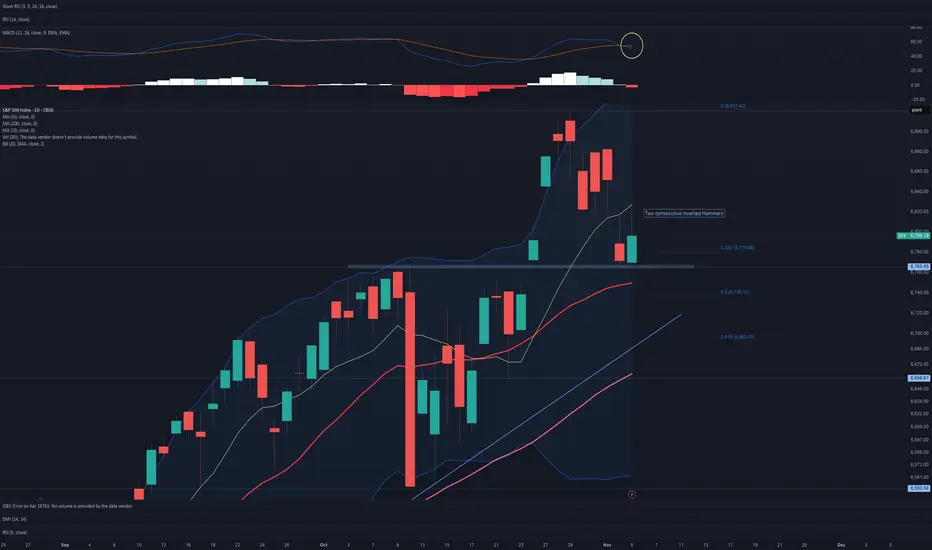
$SPX: MACD NEARING A SELL SIGNAL With one day left in the week, the candlestick pattern appears unfavorable. We will see if the 20-week SMA, which has upheld the narrow upward channel, continues to serve as support. The MACD is approaching a sell signal.

S&P 500 ROAD TO 7000 $SPX1. Executive Summary:
Following a significant correction from the 5000 level, the S&P 500 showed initial signs of stabilization on April 7th, 2025. The index had previously been rejected from a major resistance zone near the psychologically significant 7000 mark, having peaked around 6900. The current technical structure suggests a period of consolidation or pullback is underway. Critical support is identified in a layered zone between 6600 and 6200. A key finding from Fibonacci retracement analysis indicates that a hold above the 0.236 level (6428.21) could provide the necessary momentum for a renewed bullish assault, with the ultimate objective of retesting and breaking the 7000 level.
2. Recent Price Action & Market Structure:
Bullish Regeneration (7th April): The price action on this date is technically significant as it represents the first meaningful attempt to "regain" footing after a sustained drop. This could indicate that the initial wave of selling has exhausted itself, allowing buyers to step in.
Key Resistance & Rejection: The prior rejection from the ~6900 zone is a pivotal event. The failure to break through 7000 created a clear ceiling, establishing this area as a major resistance level that the market must now overcome to resume a long-term bullish trend.
3. Support Zone & Fibonacci Analysis:
The market has defined a clear hierarchy of potential support levels that will be critical in determining the next major directional move.
Layered Support Levels:
Immediate Support (6600): This is the first line of defence for the bulls. A bounce from here would indicate underlying strength and suggest the pullback is shallow.
Primary Support (6400): This level converges closely with the key Fibonacci level and is therefore a high-priority zone for buyers.
Significant Support (6200): A breach below 6400 would make this the next critical floor. A hold here is essential to prevent a deeper correction.
Fibonacci Retracement Context:
The Fibonacci tool has been applied to the most relevant upward move (likely from the 5000 low to the 6900 high).
0.236 Fibonacci Level (6428.21): This level is critically important. It represents a shallow retracement of the prior uptrend. The fact that it aligns with the identified 6400 support zone adds significant technical confluence.
Bullish Implication: A successful "bounce" from this ~6400/6428 confluence zone would be a strongly bullish signal. It would indicate that the broader uptrend remains intact and that the drop from 6900 is merely a healthy correction within a larger bull market. This would be the confirmation needed to project a move back towards the 7000 resistance.
Deeper Retracement Scenario (0.382 at 6123.76): Should the 0.236 level fail, the next major support resides at the 0.382 Fib level (6123.76), which aligns with the 6200 support. A bounce from this deeper level would still be constructive but would indicate a longer and more significant period of consolidation before a new high can be attempted.
4. Synthesis and Forward Projection:
The technical picture presents two primary scenarios:
Bullish Scenario (High Probability if 6400 Holds): The index finds strong support at the 6400/6428 confluence zone. The bounce initiated on April 7th accelerates, pushing the price back through the 6600 level and setting the stage for a retest of the 6900-7000 resistance area. A breakout above 7000 would then open the door for further all-time highs.
Consolidation Scenario (If 6400 Breaks): A break below the 0.236 Fib support shifts focus to the 6200/6123 zone. The market would likely enter a longer period of range-bound trading between ~6100 and ~6800 before gathering enough momentum for its next sustained move.
Conclusion:
In summary, while the S&P 500 faces clear overhead resistance following its rejection near 7000, the pullback is currently testing a critical support confluence near 6400. The bullish thesis for a "bounce back to 7000" is technically valid, but it is entirely contingent upon the index defending the 0.236 Fibonacci retracement level (6428.21) and the 6400 support zone. A trader should watch for confirmed bullish reversal signals (e.g., strong bullish engulfing candles, positive RSI divergence) at this level as the potential trigger for the next leg up.

stock market wave 3 top in imowave 3 for the stock market in, potential multi-year wave 4 down incoming

S&P500 index weekly logarithmic chart hitting 2,618 extensionI have meticulously tagged every turn and twist since 2009 on this chart. Using elliottwave theory I believe that this structure is ending. Bear market next? I do not know, what I do know is that it's been a fabulous run since 2009. I'm short NQ futures December contract. Good luck

Nov 6 - a move down is likely, but not certainOn SPX we're at double resistance. If we sell off here, we could have another C down, in which case, another bear trap may form (see chart at end of video). The market is very choppy and probably will continue to be for some time. Gold looks like it will test it's lows. BTC looks like it may test it's lows. Oil is still holding the 18ma, but it's running out of time to do something else.

S&P500 resilient US data reignited riskRisk appetite returned to markets over the last 24 hours, with the S&P 500 rising +0.37% as stronger US data and optimism over a potential end to the government shutdown lifted sentiment.
The ADP private payrolls report surprised to the upside at +42k (vs. +30k expected), while the ISM Services index jumped to 52.4 (vs. 50.8 expected) with new orders at a 12-month high, easing fears of an economic slowdown after Monday’s weak manufacturing data.
The improved tone triggered a broad risk-on rally:
US HY spreads tightened (-9bps) for the first time in a week.
Bitcoin rebounded (+3.38%) after recent losses.
Asian equities followed through overnight, with the Nikkei up +1.48% and Hang Seng +1.61%.
Despite solid data, Treasuries rallied as markets priced a higher chance of a December Fed rate cut, sending the USD to its biggest 3-week drop.
In corporate news, SpaceX agreed to buy EchoStar’s AWS-3 spectrum licenses for $2.6bn in stock, while EchoStar booked a $16.5bn non-cash charge tied to its 5G network wind-down.
However, some valuation concerns are re-emerging — the “Buffett Indicator” now shows US equities worth over twice GDP, with total market cap around $72tn, underscoring stretched levels after a +36% rally since April lows.
Bottom line: The S&P 500 regained momentum as resilient US data reignited risk appetite and rate-cut hopes, though extended valuations remain a potential headwind.
This communication is for informational purposes only and should not be viewed as any form of recommendation as to a particular course of action or as investment advice. It is not intended as an offer or solicitation for the purchase or sale of any financial instrument or as an official confirmation of any transaction. Opinions, estimates and assumptions expressed herein are made as of the date of this communication and are subject to change without notice. This communication has been prepared based upon information, including market prices, data and other information, believed to be reliable; however, Trade Nation does not warrant its completeness or accuracy. All market prices and market data contained in or attached to this communication are indicative and subject to change without notice.

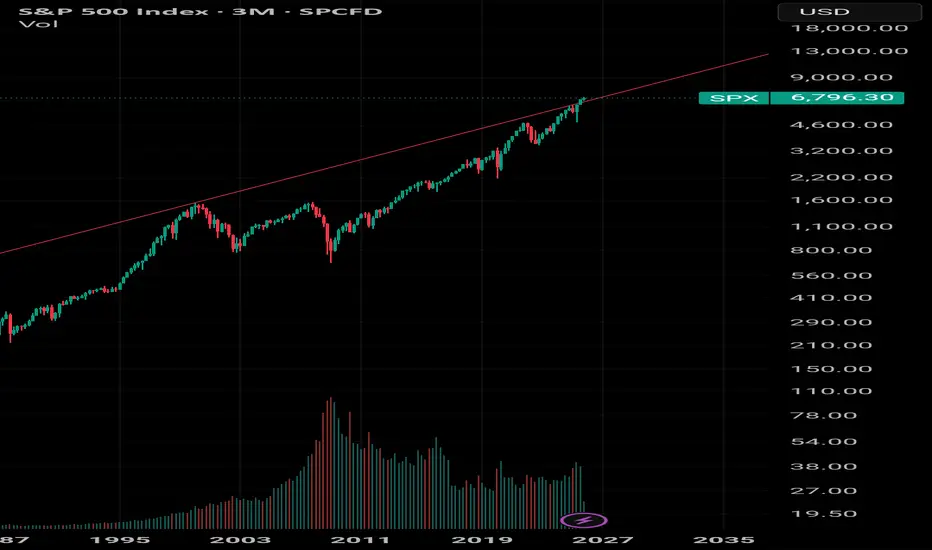
The amazing 100 year S&P log chartI love going back to this chart which tells us everything we need to know when asking the question why is buffet sitting in so much cash. It's an amazing chart and you can see what will Happen, what needs to happen but not when. Needless to say we are still above the red line.
SPX500 – Bullish Momentum Holds Above 6812 | Eyeing 6877 NextSPX500 – MARKET OVERVIEW | Bullish Bias Above 6812
The SPX500 index continues to show bullish momentum, holding firm above the pivot zone (6812–6797).
As long as price action remains above 6812, upside movement is expected toward 6842 and 6877, with a potential extension toward 6915 if bullish sentiment strengthens.
However, a sustained move below 6796 would weaken the current trend and open the way for a short-term bearish correction toward 6769 and 6754.
Key Technical Levels
Pivot Zone: 6812 – 6797
Resistance: 6842 · 6877 · 6915
Support: 6769 · 6735 · 6705
Outlook:
SPX500 remains bullish while above 6812, but a close below 6796 could trigger a corrective decline toward 6769–6754.

S&P 500 Is moving downthe overall sentiment of the latest news are not very good , a lot of traders are expecting a crash due to market overvaluation take this as an advice

I'm just marking support and resistance day 3 learning trading Just started, don't wait to really get my first 100 dollars. Just excited to really learn and start trading.

$SPX: MACD has triggered a sell signal. SP:SPX : While today's bounce started off promising, it ultimately fell short. It was unable to break above and reclaim the 10-day moving average, and today, the MACD generated a sell signal. However, before drawing any definitive conclusions, it’s essential to keep things in perspective. So far, this downward movement could be seen as a simple pullback. The S&P 500 has reached the 0.382 retracement level, and it's crucial to note that the 20-day simple moving average would need to be breached to increase the likelihood of a further decline.
Markets Looking SOFT at highs - Correction Underway (Key Levels)October 10th candle is a very important low for all US Markets
-S&P
-Nasdaq
-Dow
-Russell
The rally from that Oct 10 candle low (Friday) was met with aggressive
support but was only showing rallies in Mag 7 and AI related plays
Earnings for the most part are coming in meeting or exceeding expectations, but
price action is certainly looking soft with the market making lower highs and lower
lows for now
We have plenty of technical support, but given the longest US Government Shutdown
in history with dot.com like valuations (there is bubble and non-bubble evidence),
sentiment and elevated volatility are taking their toll and dragging the markets lower
I've closed a lot of open positions and de-risked the portfolio pretty severely this week
with the intention of finding ways to participate in a cautiously bullish environment. As I mention in the video, markets tend to V bottom, but round out the tops so the longer we
stall at these highs and the more "rounded" look we have near these highs, the more
fragile and support can be if we eventually see a break lower - TBD
Day to day, we continue to do good work carving out short-term winners and properly
position for what is next - good or bad
Thanks for watching. See you in the live markets
-Chris
