Trade ideas

SP500The S&P 500 has been in a strong uptrend since 2023 continuing its long-term bull run.
Currently the index is testing a critical resistance zone near the top trendline and the Fibonacci 1.618 extension (6800 – 7000) an area where rallies often pause or correct.
This makes it a decisive moment for the market: a confirmed breakout above this level could signal further upside while a rejection may trigger a healthy correction before the next move higher.

S&P to inflect at the Fib extension about now? Will the SP500 inflect at the fib extension of 1.618 of the prior dip down?
This is an important price level to watch to see if the index is bullish or bearish
My view is that its going to be a bearish outcome, however the market is being a bit naughty at the moment and it may push you over this price level to take out liquidity first before heading lower.
There are very few bears left out there - will they come out of hibernation right about now?

Peak Tech Earnings Wrapped Up: Here Are the Winners and LosersWe're past that time when we all get glued to the dual-monitor setup and watch the titans of tech parade their financials.
Last week was the Super Bowl of earnings season, with Meta NASDAQ:META , Microsoft NASDAQ:MSFT , Alphabet NASDAQ:GOOGL , Apple NASDAQ:AAPL , and Amazon NASDAQ:AMZN all reporting in the span of just a couple of days.
The result? A mixed bag of profits, promises, and expenses, all revolving around the familiar AI growth story. Some soared. Others sank. And everyone was reminded that in Big Tech , growth costs money — a lot of it.
Let’s unwrap what happened in the most influential week of the earnings calendar .
🥴 Meta: The Spending Spree Continues
Meta NASDAQ:META suffered the most bruising showing. On paper, revenue looked great — $51.2 billion, up 26% year over year and above estimates. But earnings per share? A brutal $1.05, far below the expected $6.72, after a nearly $16 billion one-time charge tied to President Trump’s “Big Beautiful Bill.”
Without that charge, net income would’ve jumped to $18.6 billion. Instead, the headline number showed $2.7 billion — not exactly inspiring. But the real story wasn’t the miss. It was the spending.
Meta now plans to splurge $71 billion this year, up from $69 billion, mainly on AI data centers and a hiring binge in its research division. The stock dropped 11% on Thursday.
🧠 Alphabet: Ads Strong, Cloud on Fire
If Meta NASDAQ:META stumbled, Alphabet NASDAQ:GOOGL strutted. The Google parent beat on everything : earnings per share at $2.87 vs. $2.26 expected and revenue hitting a record $102.3 billion, up 16% year on year.
The company took a $3.5 billion fine from the European Commission — but even with that, margins looked healthy. Excluding the fine, the operating margin would’ve hit 33.9%. Not bad for a firm still making 85% of its money from ads.
The real fireworks were in Google Cloud, where sales rose 34% and profit margins improved to 24% from 17% last year. Alphabet stock jumped 2.5% Thursday.
🧩 Microsoft: Cloudy with a Chance of Heavy Capex
Microsoft NASDAQ:MSFT delivered classic consistency — and then some. The company reported earnings per share of $4.13, beating estimates, on $77.7 billion in revenue. Azure, the star of the show, grew 40%, topping expectations.
Yet shares dipped 3% the day after as investors fixated on capital spending. Microsoft shelled out $34.9 billion last quarter and warned that capex growth in 2026 will exceed 2025.
🍏 Apple: New Phone Who Dis?
Apple NASDAQ:AAPL is back, everyone. The company posted record revenue of $102.5 billion , slightly above expectations, and hinted that the holiday quarter will be even juicier.
CFO Kevan Parekh said sales could rise 10–12%, led by a “double-digit” surge in iPhone 17 upgrades. After years of lukewarm demand, Apple’s upgrade cycle looks hot again.
One blemish: China sales dipped, underscoring the company’s ongoing battle in its second-largest market. But services revenue — now over $100 billion annually — continues to shine as Apple quietly transforms into a subscription empire disguised as a hardware company.
The stock erased a 3% Friday gain to dip into the red.
🚀 Amazon: AI, Efficiency, and a Holiday Boom
Then there was Amazon NASDAQ:AMZN , the comeback kid of this earnings season. The e-commerce giant’s revenue soared 13% to $180 billion , and profit surged 39% to $21.2 billion. Solid.
Amazon Web Services grew 20%, its fastest clip since 2022, as AI demand turned into real money. CEO Andy Jassy said data center expansion will remain a top priority heading into 2025.
The company managed to sprinkle in some “efficiency” — laying off 14,000 employees, a move expected to cost $1.8 billion now but save plenty later.
Amazon’s stock shot up 10% in pre-market Friday, and held on to the increase, proving that just a select few companies can pivot from layoffs to record profits with such finesse.
🧾 The Takeaway
So, what did we learn from Peak Tech Week?
America’s highflyers are spending big to secure their AI future. The underlying theme is that AI costs a fortune, but not investing in it could cost even more.
In short — the future is bright, the bills are bigger, and the market’s message is clear: keep growing, but try not to spook traders while you do it. The earnings show continues with AMD NASDAQ:AMD and Palantir NASDAQ:PLTD reporting this week.
Off to you : Are you looking to scoop up some NASDAQ:META or sell some NASDAQ:AMZN ? Share your thoughts in the comments!

Weekend Analysis: DXY, BTC, Gold, Silver, Nas100 and SPX500In this video presentation I am expecting the dollar index to continue its uptrend on the lower time frame towards the liquidation level target of 99.500.
Bitcoin is still in a distribution range and currently correcting the sharp sell off from $126,296. I am observing an A-B-C corrective pattern potentially to targets of either $115,044 or $117,653. These are confluence of resistance level and will be expecting a sell off from these levels. If these levels gets invalidated then potentially the all time highs of $126k is in view. However that's not my expectation so a breach of the target level will invalidate the bearish analysis on Bitcoin.
I think Gold and Silver have peaked out for now and smart money is off loading to FOMO retail traders. I am expect Silver to sell off much faster than Gold.
Nas100 and SPX500 clinched to a breakout of new highs but the buying volume is fading out and seems to be a fake out. I will be watching if the breakout levels gets support or breakdown on pullback to decide a long position or short position.
This is my opinion on the market this week and I thank you for your time to visit my publications.
Have a great trading week and don't forget risk and money management is your first job as trader or investor. Cheers!!

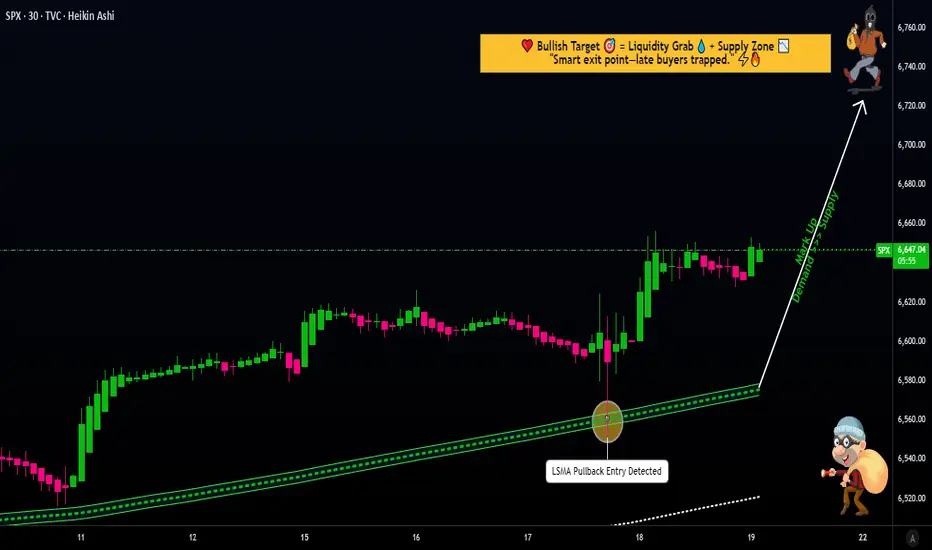
SPX500 Trading Strategy Explained: From Entry to Exit⚡ SPX500 “STANDARD & POOR” Indices Market Wealth Strategy Map ⚡
(Swing / Day Trade Plan – Thief OG Style)
🧭 Plan
📈 Bias: Bullish confirmed with 30m LSMA pullback + 0.786 Fibonacci-based MA confluence.
💡 Entry Approach (Thief Layering Strategy™):
Instead of one-shot entry, I place multiple buy-limit layers to average into strength. Example setup:
Buy limit: 6600
Buy limit: 6620
Buy limit: 6640
👉 You can extend or adjust the layering based on your own strategy.
🎯 Stop Loss (SL)
This is my Thief SL @6560.
⚠️ Note to Ladies & Gentlemen (Thief OG’s): This SL is not a recommendation. Use your own judgment — protect your loot at your own risk.
💰 Target (TP)
📌 6750 — sitting at strong resistance + overbought zone + possible bull-trap.
⚠️ Again, OG’s — this is not financial advice. Take profit when it fits your plan. Secure the bag, then enjoy the loot!
🔍 Related Pairs to Watch
Keep an eye on these correlated assets to confirm the SPX500’s move:
NASDAQ:NDX (Nasdaq 100): Tech-heavy index with strong correlation to SPX500. If tech stocks are pumping, it’s a bullish signal for our trade. 📊
TVC:DXY (US Dollar Index): A weaker dollar often boosts equities. Watch for inverse correlation—DXY dropping could mean SPX500 is ready to fly! 🚀
TVC:VIX (Volatility Index): Low VIX levels signal market calm, supporting our bullish setup. A spike in VIX could warn of trouble, so stay sharp! ⚡
Key Correlation Insight: SPX500 often moves in tandem with NASDAQ:NDX due to shared tech giants (think Apple, Microsoft). If NASDAQ:NDX is rallying, it’s a tailwind for our trade. Conversely, a rising TVC:DXY or TVC:VIX could signal caution.
📝 Thief Note
Dear Ladies & Gentlemen (Thief OG’s):
This map is my personal swing/day trade playbook — not a fixed recommendation. Layer entries, cut losers fast, and loot when you can. Market moves are wild; manage risk like a true OG.
✨ “If you find value in my analysis, a 👍 and 🚀 boost is much appreciated — it helps me share more setups with the community!”
⚠️ Disclaimer: This is a Thief-style trading strategy shared just for fun & educational vibes. Not financial advice. DYOR & trade responsibly.
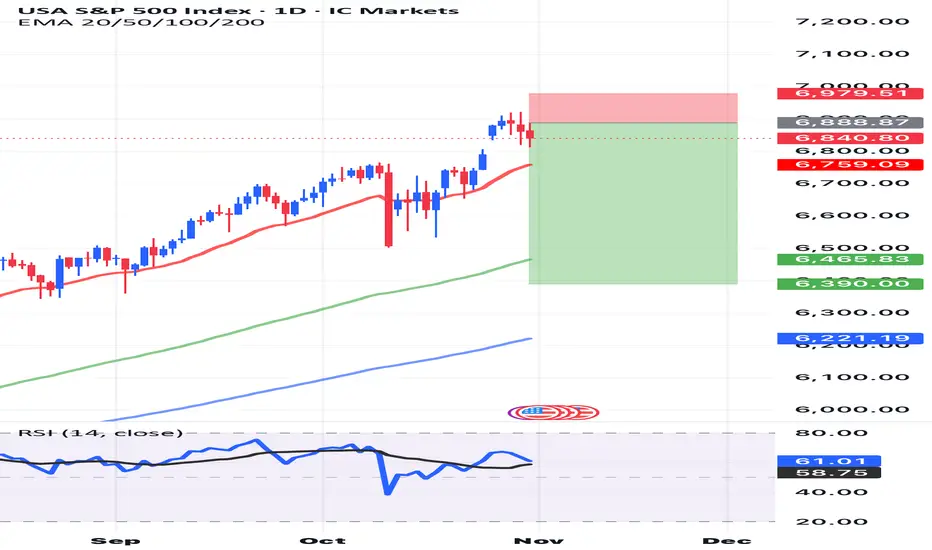
SPX500 Eyes 7000 — Breakout or Bull Trap Ahead?🦸♂️ SPX 500 Heist: The 7K Bull Run Playbook (Swing Trade Setup) ✅
Alright, crew, listen up! The market is a vault, and we're here to make a strategic withdrawal. The SPX 500 is showing us the blueprints for a potential bullish breakout. This is our plan to ride the wave.
🎯 The Master Plan: BULLISH
We're looking for a classic breakout play. The gates are at 6780, and once they're open, we're going in.
⚡ Entry Signal (The "Go" Signal)
Action: Consider long positions ONLY AFTER a confirmed daily breakout and close above the key level of 🎯 6780.00.
Translation: Don't jump the gun. Wait for the market to show its hand.
🚨 Stop Loss (The "Escape Route")
Location: My suggested escape hatch is down at 🛡️ 6600.00. Place it after the breakout we talked about.
A Note from the OG: "Dear Ladies & Gentleman (Thief OG's), I am not recommending you set only my SL. It's your own choice. You can make money, then take money at your own risk." 😉
💰 Profit Target (The "Loot Bag")
Destination: We're aiming for the major resistance zone at 🎯 7000.00. This is a psychological magnet and a previous area where sellers stepped in.
Why Here? It's a zone of strong resistance, potential overbought conditions, and traps for the greedy. Be smart and escape with your profits!
Another OG Note: "Dear Ladies & Gentleman (Thief OG's), I am not recommending you set only my TP. It's your own choice. You can make money, then take money at your own risk." 😎
🔍 Market Intel: Pairs to Watch
A master thief always checks the surrounding area. Keep an eye on these correlated assets:
AMEX:SPY (SPDR S&P 500 ETF): The direct tracker. Moves almost tick-for-tick with the SPX.
NASDAQ:NDX (Nasdaq 100): Tech-heavy cousin. If NDX is strong, it often pulls SPX up with it.
TVC:DXY (U.S. Dollar Index): Our usual antagonist. A stronger dollar can be a headwind for large-cap stocks.
CME_MINI:ES1! (S&P 500 E-mini Futures): The real-time action. This is where the big moves often happen first.
✨ Community Boost
If you find value in my analysis, a 👍 and 🚀 boost is much appreciated — it helps me share more setups with the community!
#SPX500 #SP500 #SwingTrading #MarketPlaybook #PriceAction #ThiefTrader #IndexAnalysis #TechnicalAnalysis #TradingStrategy #US500 #Equities #BreakoutStrategy #TradingView #StockMarket #RiskManagement

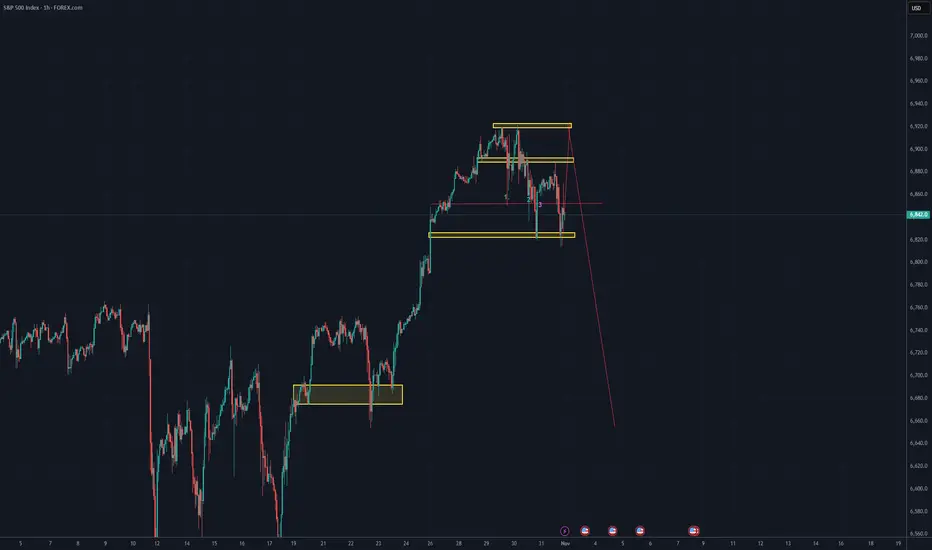
S&P will decline to 6350 from 6840 in the next 2-5 daysS&P will decline to 6350 from 6840 in the next 2-5 days

SPX: Pulls back from the latest ATHThe Fed cut interest rates by 25 basis points, as widely expected, while US equity markets pulled back from recent all time highest levels. This could be a short summary of the previous week on the US markets. The higher volatility continued leading the sentiment toward the overbought side. The newest ATH for the S&P 500 was at 6.917, but the index is closing the week at 6.840. The market was not happy regarding Fed Chair Powell comments that the rate cut in December is not guaranteed. The US Government continues to be in a state of a “shutdown”, where the majority of important macro data are still not available to the public, so the investors are currently acting in a sort of "blindfolded" manner when it comes to macro data.
The S&P 500 slipped as two of its largest members, Meta Platforms and Microsoft, weighed on the market. Meta plunged about 12 % after forecasting significantly higher AI-capex next year, while Microsoft declined over 2 % following disclosure of nearly $35 billion in planned spending. Meanwhile, Alphabet bucked the trend with a gain of 5.5 % thanks to strong advertising and cloud revenue offering some bright spots amid tech weakness. Amazon surged around 9,6% after a strong quarter led by cloud growth. Tesla was also a weekly winner with around 3,7% gain.
Analysts are in agreement that higher volatility of the equity market could continue in the future period. Tech companies are currently strongly investing into AI adoption, with some estimates of $600 billion in capital spending already planned for the next year. This will be one of indicators that investors will be closely watching in the future, especially examining how this CAPEX spending is translating into rising AI-driven revenues for each company.

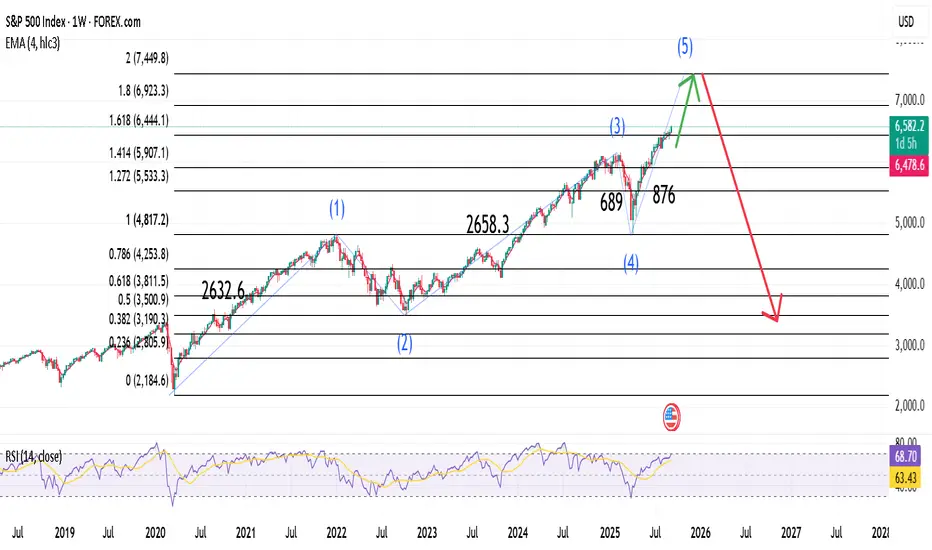
SPX to 7450?Looking at the long term chart starting from the covid crash we can see 2 impulse of average 2650 pts and two retracement, so from the trump crash to 4800 we could see one last bullish impulse of around 2650 pts to target 7450 in autumn.
Now I expect a retracement to 5965-5970 area before last bullish impule

Agenda 89 --- the path to spy's next major topso I been rambling about agenda 89 and spy cycles for like ages. I also more or less blew my account up not listening to my own advice and my own levels. key thing here is market follows cycles. and no I am not willing to share the prior cycles. this here is for me more than anyone else.
I am not good with numbers so I had chatgpt do the calculations for me and the rationale made sense given my basic college math level knowledge. In fact the cycles that gpt calculated appeared to follow the same cycle rules that I used to detect the historical cycles. I have only 3 historical cycles detected. in recent times. reason being that since 2008 Aladdin took over the market and things changed. there is a certain year where it all did shift but for simplicity only data after 2008 matters because after that Aladdin by blackrock the mega algorithm managed all the trillions that move the market daily. it literally trades with itself. it's too huge to fail so I will not fight it. the cycles have also been shrinking in expansion per say. the next top is likley the last or second to last before some major black swans start happening. At least that's what aladdin has priced in. he knows more about you than yourself and
other notes is that the tops follow wycoff style, the expanded and got more volatile as they progressed and I plan to follow the same pattern in my projections. my projections are half lazy in terms of the tops/bottoms. it can really follow any wycoff. but of note, when all was noted and combined chatgpt described it as a wycoff schematic #1. even though when I typed the pattern that i saw in i labeled it as musical notes. I did not paint very well on chart because things in real life do not follow the textbook 1-1, point is, whipsaw and that's your range there more or less. I am not sure how to past an image here so just google it.
the rules and this is for me to not blow my account up anymore:
1- no timing the market, it dipped? good it can dip lower before tuning up. so expect the trades to be long. were looking at 13 dips before the top in febuary.
2- the numbers can be off slightly. I'm no picasso, can;t time or paint the market. levels evolve and change with time. the range wont change though.
3- the true top is likley a tuesday or a wednesday since historically it was those days so extra bias for them
4- no greed
5- yes this will chop until next year mid febuary - do not blow up. RANGE BOUND.
I'm expecting possibilities of up to 720-730 for the top on spy since that would be two full cycles in geometry which would make sense assuming the prior 3 were 90 degrees each. hence a strong belief of mine that this may be the last market cycle aladdin is pricing in before doomsday events. Aladdin probably knows when WW3 will start before the guys launching the nukes know it will start and has been pricing it in since it took over the markets. that thing is a monster beyond comprehension.

US500How to become successful in forex and stock trading:
1.Master fundamentals and technical analysis.
2.Build and follow a solid trading plan.
3.Apply strict risk management (4–6% rule).
4.Stay disciplined—control fear and greed.
5.Record and analyze every trade.
6.Focus on high-quality setups only.
7.Diversify across assets and markets.
8.Keep evolving—study, adapt, and grow daily.
More upside for SPX500USDHi traders,
Last week SPX500USD went up and made a correction down.
So next week we could see more upside for this pair.
Let's see what the market does and react.
Trade idea: Wait for the correction down to finish. After that look for an impulse wave with a correction down on a lower timeframe. After a change in orderflow to bullish you could trade longs.
This shared post is only my point of view on what could be the next move in this pair based on my technical analysis.
But I react and trade on what I see in the chart, not what I've predicted or expect.
Don't be emotional, just trade your plan!
Eduwave

S&P 500 still holding From the weekly; this monster is still printing money. Stay in spot and you will see results. The green lines are my very likely Fibs. NFA so at the same time invest what you can afford to lose. Drop me a line later and request whatever long/shory macro/micro extensive analysis.
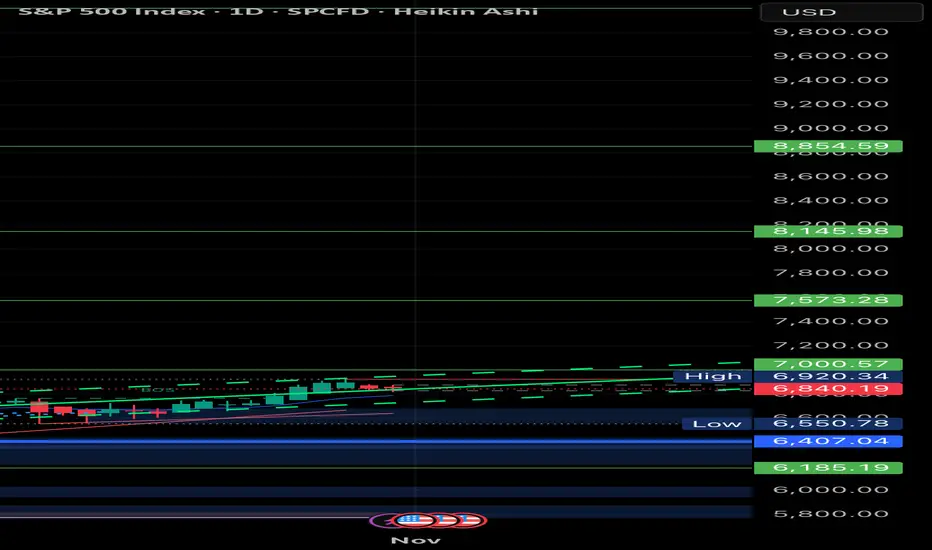
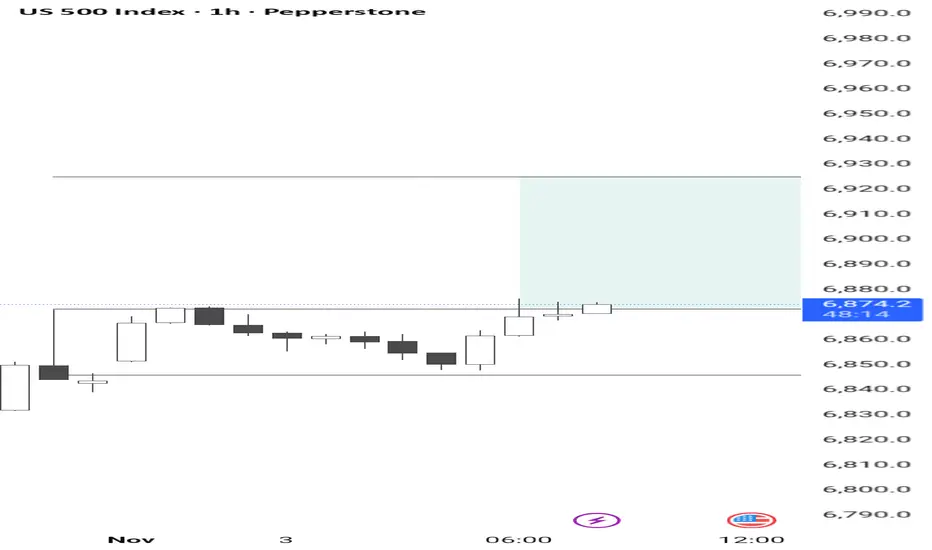
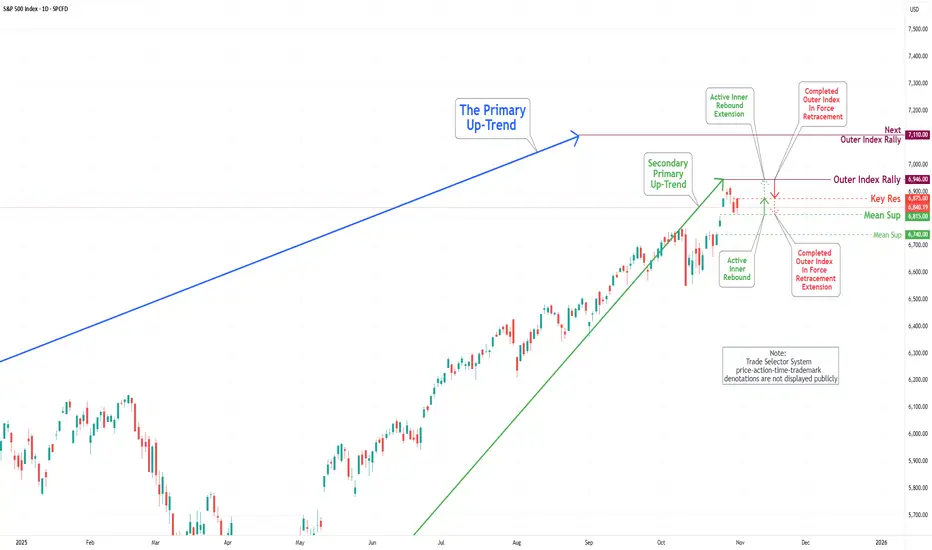
S&P 500 Daily Chart Analysis For Week of Oct 31, 2025Technical Analysis and Outlook:
During the recent trading session, the S&P 500 Index continued its wild ride, highlighting the importance of our key target, which stands as an Outer Index Rally at 6946. Fluctuations between the Mean Support at 6815 and the Key Resistance at 6875 serve as a crucial threshold for market participants. This positioning suggests the potential for further upward momentum, as the prevailing trend indicates a well-structured Active Inner Rebound extension toward the target stated above.
Nevertheless, it is essential to acknowledge the possibility of a sustained and gradual pullback within the current Active Inner Rebound zone. Such a pullback may retest the Mean Support at 6815 and could decline further to the Mean Support at 6740 before ultimately resuming an upward trajectory.
EURUSD - GBPUSD - BTC - AUDCAD - S&P500This weekly insights has a great possibility for a clear directions for

SPX 7450 end of bull cycle then3400In my view bullish cycle started in 2020 will complete at 7450 where massive crash will start to target 3400 area
S&P 500 INDEX | Institutional Technical Analysis Masterpiece🔥 US500 S&P 500 INDEX | Institutional Technical Analysis Masterpiece | 6,843.7 🔥
📈 ELITE MULTI-TIMEFRAME BREAKDOWN | NOVEMBER 3-7, 2025 TRADING ROADMAP 📈
Current Level: 6,843.7 | Analysis Date: November 1, 2025, 00:54 UTC+4
Hello, TradingView community! 👋 The S&P 500 has been on an absolute tear, closing the week at a staggering 6,843.7 . The big question on everyone's mind is: Are we witnessing a final euphoric push before a correction, or is this simply a pause before the next leg up? This week, from November 3rd to 7th, will be critical.
Let's break down the multi-timeframe picture, blending classic theories with modern indicators to build a comprehensive trading plan for both intraday and swing traders. 🧠
═══════════════════════════════════════════════════════════════════
🎯 MARKET INTELLIGENCE EXECUTIVE SUMMARY
The S&P 500 stands at 6,843.7 , navigating a historic technical confluence zone that will determine the market's trajectory through year-end 2025. Our algorithmic and classical analysis fusion reveals bullish continuation potential with measured risk parameters. This week presents asymmetric opportunities as institutional positioning, technical patterns, and macro catalysts align for potentially explosive moves.
Critical Support Infrastructure: 🛡️
Immediate Floor: 6,820 - 6,830 (Algorithmic bid zone)
Secondary Base: 6,800 - 6,810 (Institutional accumulation)
Major Support: 6,750 - 6,770 (Weekly pivot nexus)
Ultimate Defense: 6,700 - 6,720 (Psychological fortress)
Resistance & Target Architecture: 🎯
First Ceiling: 6,860 - 6,870 (Intraday supply)
Secondary Wall: 6,900 - 6,910 (Round number magnet)
Breakout Zone: 6,950 - 6,970 (Pattern objective)
Major Extension: 7,000 - 7,020 (Psychological milestone)
═══════════════════════════════════════════════════════════════════
📊 WEEKLY TIMEFRAME (1W) - MACRO MARKET STRUCTURE
Elliott Wave Grand Architecture: 🌊
We're positioned in Minor Wave 3 of Intermediate Wave (5) within the secular bull market. The impulsive structure projects targets at 7,100-7,200 based on Fibonacci extensions. Critical validation: maintaining above 6,720 preserves the bullish count.
Primary Count: Wave 3 of (5) targeting 7,100
Alternative: Wave B of expanded flat, risk below 6,650
Invalidation: Weekly close below 6,600
Time projection: Completion by late November
Wyckoff Accumulation Schematic: 📚
Phase D - Markup Beginning
- Preliminary Supply (PSY): 6,920 tested
- Buying Climax (BC): 6,950 rejection
- Automatic Reaction (AR): 6,750 hold
- Last Point of Support (LPS): Current 6,843
- Sign of Strength (SOS): Pending above 6,870
Ichimoku Cloud Mastery: ☁️
Tenkan-sen: 6,815 (9-period support)
Kijun-sen: 6,780 (26-period base)
Senkou A: 6,850 (cloud top resistance)
Senkou B: 6,720 (cloud bottom support)
Chikou Span: Clear above price (bullish)
Cloud status: Thick and ascending
Advanced Harmonic Patterns: 🦋
Developing Bullish Gartley with precision ratios:
- XA leg: 6,500 to 6,950 (450 points)
- AB retracement: 0.618 at 6,672 ✅
- BC extension: Testing 0.786 at 6,845 (current)
- D completion: 0.786 XA at 6,850-6,870
- Target upon completion: 7,050-7,100
═══════════════════════════════════════════════════════════════════
📉 DAILY TIMEFRAME (1D) - SWING TRADING COMMAND CENTER
Japanese Candlestick Mastery: 🕯️
Yesterday's Doji Star at resistance signals equilibrium. Today's action critical:
- Close above 6,860 = Three White Soldiers continuation
- Close below 6,820 = Evening Star reversal warning
- Current bias: Neutral-bullish pending confirmation
Master Pattern Recognition:
Cup and Handle formation nearing completion:
- Cup low: 6,650 (October)
- Cup high: 6,920 (Recent peak)
- Handle forming: 6,820-6,870 range
- Breakout target: 7,190 (270-point measured move)
- Volume requirement: 25% above 20-day average
Bollinger Bands Configuration: 📊
Upper Band: 6,875 (immediate resistance)
Middle Band (20-SMA): 6,810 (dynamic support)
Lower Band: 6,745 (oversold boundary)
Band Width: Expanding (volatility increasing)
%B Indicator: 0.68 (upper half, bullish bias)
RSI Multi-Timeframe Analysis:
Daily RSI: 59 (room for upside)
Hidden bullish divergence vs price action
Support trend line from September intact
Resistance at 70 provides 11-point runway
═══════════════════════════════════════════════════════════════════
⚡ 4-HOUR TIMEFRAME (4H) - TACTICAL EXECUTION FRAMEWORK
Gann Theory Application: 📐
Current Gann Angles:
1x1: 6,825 (45-degree support)
2x1: 6,850 (current resistance)
1x2: 6,790 (major support)
Square of 9: 6,889 (next target)
Gann Box: 6,750-6,950 range
Time cycles: Nov 5 critical date
Dow Theory Confirmation Checklist: ✅
Primary Trend: Bullish (new highs achieved)
Secondary Trend: Consolidation/Correction
Volume Confirmation: Accumulation on dips
Breadth Analysis: 65% stocks above 50-DMA
Sector Rotation: Technology leading (bullish)
Transportation Confirmation: Pending
Moving Average Symphony:
- EMA 8: 6,838 (ultra-short support)
- EMA 21: 6,825 (short-term support)
- EMA 50: 6,810 (medium support)
- SMA 100: 6,785 (strong support)
- SMA 200: 6,750 (major trend support)
Pattern Alert: 🚨
Ascending Triangle resolution imminent:
- Horizontal resistance: 6,860-6,870
- Rising support: 6,820-6,830
- Apex convergence: November 4
- Breakout projection: 6,950+
═══════════════════════════════════════════════════════════════════
🎪 1-HOUR TIMEFRAME (1H) - PRECISION TRADING LABORATORY
Micro Pattern Development: 🔬
Double Bottom forming at 6,825:
- First bottom: 6,823 (10:00 UTC)
- Second bottom: 6,826 (14:00 UTC)
- Neckline resistance: 6,855
- Pattern target: 6,885 (30-point move)
VWAP Trading Matrix:
Daily VWAP: 6,841
Weekly VWAP: 6,825
Monthly VWAP: 6,795
Upper Band 1: 6,858 (first resistance)
Upper Band 2: 6,875 (second resistance)
Lower Band 1: 6,824 (first support)
Lower Band 2: 6,807 (second support)
Support & Resistance Precision Grid:
R4: 6,890 (Major resistance)
R3: 6,875 (Daily upper BB)
R2: 6,860 (Pattern neckline)
R1: 6,850 (Immediate resistance)
PIVOT: 6,843.7 (Current Price)
S1: 6,835 (Micro support)
S2: 6,825 (VWAP support)
S3: 6,810 (Major support)
S4: 6,795 (Monthly VWAP)
═══════════════════════════════════════════════════════════════════
⚡ 30-MINUTE TIMEFRAME (30M) - SCALPING COMMAND POST
Microstructure Analysis: 🎯
Bull Flag pattern developing:
- Pole: 6,810 to 6,855 (45 points)
- Flag consolidation: 6,835-6,845
- Breakout trigger: 6,846
- Target: 6,890 (45-point measured move)
Volume Profile Intelligence: 📊
POC (Point of Control): 6,837
VAH (Value Area High): 6,848
VAL (Value Area Low): 6,828
HVN (High Volume Node): 6,835-6,840
LVN (Low Volume Node): 6,855-6,860 (breakout zone)
Scalping Execution Zones:
Buy Zones:
• Zone 1: 6,835-6,838 (POC test)
• Zone 2: 6,828-6,831 (VAL support)
• Zone 3: 6,820-6,823 (Strong bid)
Sell Zones:
• Zone 1: 6,848-6,851 (VAH resistance)
• Zone 2: 6,858-6,861 (Supply zone)
• Zone 3: 6,868-6,871 (Major resistance)
═══════════════════════════════════════════════════════════════════
🏃 15-MINUTE & 5-MINUTE HYPERSPEED SCALPING
15-Minute Lightning Analysis: ⚡
Wedge pattern near apex:
- Upper trendline: 6,847
- Lower trendline: 6,839
- Breakout direction: 70% probability upward
- Quick target: 6,855 (+12 points)
- Stop: 6,835 (-8 points)
5-Minute Algorithmic Signals:
Long Entry Conditions:
RSI(5) < 30 AND Price > VWAP = BUY
MACD crossover AND Volume > Average = BUY
Price touches EMA(20) from above = BUY
Short Entry Conditions:
RSI(5) > 70 AND Price < VWAP = SELL
MACD crossunder AND High volume = SELL
Price rejected at resistance = SELL
Exit Rules:
Take profit: 8-10 points
Stop loss: 5-6 points
Time stop: 15 minutes max hold
Session Volatility Map: 🕐
Asian: 10-15 point range (quiet)
London Open: 20-30 point expansion
NY Premarket: 25-35 point volatility
NY Open: 40-50 point moves
NY Afternoon: 20-30 point consolidation
═══════════════════════════════════════════════════════════════════
📅 WEEKLY STRATEGIC FORECAST (NOVEMBER 3-7, 2025)
Monday, November 3: 🚀
Opening gap probability: 60% bullish
Strategy: Buy weakness to 6,830, target 6,870
Key levels: Support 6,820, Resistance 6,880
Expected range: 50 points
Tuesday, November 4: 🗳️
Election Day - Extreme volatility expected
Strategy: Straddle/strangle positions
Potential range: 6,750-6,920 (170 points!)
VIX spike likely above 25
Wednesday, November 5: 💥
Post-election directional resolution
Strategy: Trade the breakout aggressively
Bullish above 6,880 → Target 6,950
Bearish below 6,800 → Target 6,720
Thursday, November 6: 📊
FOMC minutes and economic data
Strategy: Fade first move, trade reversal
Expected consolidation: 6,850-6,900
Options gamma concentration: 6,875
Friday, November 7: 🎯
Weekly options expiration dynamics
Strategy: Theta decay trades around 6,850
Pin risk: 6,850 strike concentration
Weekly close above 6,870 = Bullish next week
═══════════════════════════════════════════════════════════════════
⚖️ INSTITUTIONAL RISK MANAGEMENT PROTOCOLS
Intraday Risk Framework: 🛡️
Position sizing: 0.5-1% risk per trade
Risk-Reward: Minimum 1:2.5 ratio
Daily loss limit: -2% portfolio max
Consecutive losses: 3 max, then pause
Profit trailing: 60% of maximum gain
Breakeven stop: At 10-point profit
Scaling strategy: 3 entries maximum
Swing Position Architecture: 💼
Core position: 50% at 6,820-6,830
Add-on levels: 25% at 6,800, 25% at 6,780
Stop loss: Below 6,750 (all positions)
Target 1: 6,900 (25% exit)
Target 2: 6,950 (35% exit)
Target 3: 7,000 (25% exit)
Runner: 7,050+ (15% hold)
═══════════════════════════════════════════════════════════════════
🔴 RISK SCENARIOS & CIRCUIT BREAKERS
Bearish Invalidation Levels: 🐻
15-min close below 6,835 = Micro caution
Hourly close below 6,820 = Intraday bearish
4H close below 6,800 = Swing bearish shift
Daily close below 6,750 = Trend reversal risk
Weekly close below 6,700 = Major bear signal
Tail Risk Considerations: 🦢
• Geopolitical shock (100+ point gap risk)
• Fed policy surprise (2-3% moves)
• Tech earnings disasters (sector rotation)
• Credit event contagion (systemic risk)
• AI bubble concerns (valuation reset)
═══════════════════════════════════════════════════════════════════
💎 ELITE CONFLUENCE TRADING ZONES
Premium Buy Zone: ✅
6,820-6,830
(Multi-timeframe support + Fibonacci 61.8% + VWAP + Moving average cluster)
Optimal Sell Zone: ❌
6,870-6,880
(Resistance confluence + Pattern targets + Round number + Options barrier)
Breakout Trigger: 🚀
6,870-6,875
(Triangle apex + Bollinger Band + Volume breakout zone)
═══════════════════════════════════════════════════════════════════
🏆 MASTER TRADER'S FINAL VERDICT
The S&P 500 at 6,843.7 presents a high-conviction bullish opportunity with exceptional risk-reward dynamics. Technical confluence across multiple timeframes, combined with constructive market internals and seasonal factors, supports upside continuation toward 6,900-6,950 initially, with 7,000+ potential.
Top 3 Highest Probability Trades: 🎯
Swing Long: 6,820-6,830 → Target: 6,950 (RR 1:4)
Breakout Long: Above 6,870 → Target: 6,920 (RR 1:3)
Scalp Long: VWAP 6,841 → Target: 6,855 (RR 1:2.5)
Trading Wisdom: 🧠
Position for probability, not possibility. Size for survival, not home runs. The best traders are risk managers who happen to trade.
"Markets can remain irrational longer than you can remain solvent. Trade the chart, not the opinion!" 💡
═══════════════════════════════════════════════════════════════════
📍 ACTIONABLE INTELLIGENCE SUMMARY
Bull market intact above 6,750. Accumulate dips toward 6,820. Target 7,000 by month-end. Risk management is paramount during election week volatility.
Trade with discipline. Prosper with patience. 💰
═══════════════════════════════════════════════════════════════════
#SPX #SP500 #US500 #TechnicalAnalysis #Trading #StockMarket #Indices #DayTrading #SwingTrading #ElliottWave #Wyckoff #HarmonicPatterns #OptionsTrading #VIX #MarketStructure #OrderFlow #InstitutionalTrading #AlgorithmicTrading #TradingView #MarketForecast #SPY #ES_F
🔔 Follow for Institutional-Grade Analysis | Precision • Discipline • Profits 📊
Disclaimer: This analysis is educational only. Trading carries substantial risk of loss. Past performance does not guarantee future results. Always conduct independent research and employ proper risk management.

Understanding the Concept of Exotic OptionsIntroduction: Beyond the Vanilla Options
In the world of derivatives trading, options are among the most powerful instruments available to investors. Traditional or “vanilla” options—such as calls and puts—are already versatile tools for hedging and speculation. However, as financial markets evolved, traders and institutions began to seek more sophisticated instruments that could offer customized payoffs, align with complex risk management needs, or exploit specific market views. This need gave birth to a more advanced class of derivatives known as exotic options.
Exotic options go beyond the standard payoff structure of vanilla options. They can depend on multiple underlying assets, trigger conditions, time periods, or paths that prices follow. These options have become integral in structured products, risk management, and tailored investment strategies, particularly in global forex, commodity, and equity-linked markets.
This essay explores the concept, types, valuation, applications, advantages, and risks of exotic options—providing a comprehensive understanding of how these instruments work in modern finance.
1. What Are Exotic Options?
Exotic options are non-standard derivative contracts that have complex features differentiating them from traditional options. While vanilla options grant the right to buy (call) or sell (put) an asset at a predetermined strike price before or at expiration, exotic options can alter how and when payoffs are determined.
They may:
Depend on the path of the underlying asset’s price, not just its final value.
Have multiple exercise or settlement dates.
Involve different underlying assets or currencies.
Include barriers, averages, or digital features that modify payouts.
For instance, a barrier option may only become active (“knock-in”) or inactive (“knock-out”) if the underlying price crosses a specified level. Similarly, an Asian option’s payoff depends on the average price of the underlying over time, reducing volatility effects.
Exotic options are thus tailored to specific investor needs—allowing hedgers or speculators to fine-tune their exposure to price movements, volatility, and time decay.
2. Evolution and Market Use
The development of exotic options traces back to the late 1970s and 1980s, when financial innovation surged alongside advances in computing and quantitative finance. Early forms appeared in the foreign exchange and commodity markets, where traders needed customized hedging tools to manage complex exposures.
By the 1990s, exotic options became a cornerstone of structured finance, used by investment banks to create tailor-made products for corporate clients and high-net-worth investors.
Today, exotic options are found across:
Currency markets (FX options): Commonly used for hedging exchange rate risks.
Commodity markets: To manage exposure to volatile prices.
Equity-linked notes and structured products: For customized return profiles tied to indices or stock baskets.
Interest rate and credit derivatives: To hedge rate movements or credit events.
Exotic options have thus evolved from niche instruments into mainstream financial engineering tools—allowing traders to achieve precise risk-return outcomes that vanilla options cannot offer.
3. Key Characteristics of Exotic Options
Exotic options differ from vanilla options through unique features such as:
a. Path Dependency
In vanilla options, only the final price of the underlying asset matters. In exotic options, however, the entire price path may influence the payoff.
Example: In an Asian option, the payoff depends on the average price over time, not the terminal price at expiration.
b. Conditional Payoffs
Many exotic options include “if-and-only-if” conditions. For instance:
Barrier options activate or deactivate based on price thresholds.
Lookback options depend on the maximum or minimum price achieved during the option’s life.
c. Multi-Asset Dependence
Some exotic options depend on more than one underlying, such as currency pairs, indices, or stock baskets.
Example: A basket option may be based on the average performance of multiple assets.
d. Complex Exercise Rules
Unlike American or European options, some exotics allow customized exercise schedules or partial exercises tied to specific market events.
e. Tailored Payout Structures
Payoffs can be linear, binary, capped, or floored—allowing unique risk-reward combinations suited to specific strategies.
4. Major Types of Exotic Options
There are numerous exotic options, but the following categories are among the most common and important:
a. Barrier Options
Barrier options are activated or extinguished when the underlying asset hits a certain level.
Types include:
Knock-in options: Become active only if the price crosses the barrier.
Knock-out options: Become void if the barrier is breached.
Double-barrier options: Have both upper and lower thresholds.
These are popular in currency and commodity markets due to their cost-effectiveness and targeted exposure.
b. Asian Options
Also known as average options, these derive their value from the average price of the underlying over a period.
They are used to smooth out volatility and reduce the impact of short-term price swings—ideal for commodities or volatile assets.
c. Lookback Options
Lookback options allow the holder to “look back” over the life of the option to determine the optimal strike or payoff.
For instance, the holder of a lookback call can buy at the lowest price observed during the option period.
These are valuable for volatility trading and performance-linked bonuses, but are more expensive due to the flexibility they provide.
d. Binary (Digital) Options
Binary options provide all-or-nothing payouts. If a condition is met (for example, the asset price exceeds the strike), a fixed amount is paid; otherwise, nothing is received.
They are used in speculative trading and hedging against specific events (like rate announcements or price thresholds).
e. Compound Options
A compound option is an option on another option. There can be four variants—call on call, call on put, put on call, and put on put.
These are primarily used by institutional investors managing portfolios of options or structured exposures.
f. Chooser Options
These allow the holder to decide, at a future date, whether the option will be a call or put.
They are ideal for hedging uncertainty, especially in situations where the future direction of prices is unclear.
g. Rainbow or Basket Options
These depend on multiple underlying assets. The payoff may be linked to the best or worst performer, or an average of all.
Used widely in equity-linked structured products to diversify exposure.
h. Barrier-Rebate and Range Options
In these, the payoff depends on whether the price stays within a certain range or hits a barrier, sometimes offering a rebate if deactivated.
5. Pricing and Valuation Challenges
Pricing exotic options is more complex than pricing vanilla ones because of path dependency and non-linear payoffs. Traditional Black-Scholes models are insufficient for many exotics. Instead, advanced methods such as:
Monte Carlo simulation (for path-dependent options),
Binomial or trinomial tree models (for barrier options),
Finite difference methods (for solving partial differential equations),
are used for accurate valuation.
Moreover, the valuation must incorporate:
Volatility skew and smile effects,
Interest rate differentials (especially in FX exotics),
Time decay and path volatility, and
Counterparty credit risks.
Due to these complexities, exotic option trading is typically limited to institutional investors and quantitative traders with access to robust pricing models and computing power.
6. Strategic Applications in Markets
Exotic options play several strategic roles in modern finance:
a. Risk Management
Corporations use them to hedge specific exposures that vanilla options cannot cover efficiently. For example:
A company importing oil may use an Asian call to hedge against the average price rather than the spot price.
Exporters use barrier options to hedge currency risks only if extreme price movements occur.
b. Yield Enhancement
Investors seeking higher returns may purchase structured products embedding exotic options (like range accrual notes) that provide enhanced coupons tied to certain price conditions.
c. Speculation and Arbitrage
Traders exploit exotic options to speculate on volatility, correlations, or price ranges rather than pure direction.
For instance, digital options allow bets on whether a price will surpass a level by expiration.
d. Structured Product Design
Exotic options form the building blocks of many structured investment products—such as equity-linked notes, autocallables, and principal-protected instruments—allowing issuers to customize payoffs.
7. Advantages of Exotic Options
Customization: Can be precisely structured to match unique market views or hedge specific risks.
Cost Efficiency: Often cheaper than vanilla options offering similar exposures due to conditional triggers.
Strategic Flexibility: Allow exposure to volatility, time, or correlation rather than simple price direction.
Diversification: Multi-asset or path-based structures provide diversification benefits.
Creative Payoffs: Enable innovative investment products appealing to both retail and institutional investors.
8. Risks and Limitations
While attractive, exotic options carry significant risks:
a. Complexity Risk
The intricate payoff structures make them hard to value or understand, leading to potential mispricing.
b. Liquidity Risk
Most exotic options are over-the-counter (OTC) products, not exchange-traded, hence low liquidity and wider bid-ask spreads.
c. Counterparty Risk
Since many trades are bilateral, there is always the possibility of default by the counterparty.
d. Model Risk
Valuation depends on complex models and assumptions about volatility, correlation, and interest rates. Incorrect assumptions can lead to misestimation of fair value.
e. Regulatory and Transparency Issues
Post-2008, regulators have tightened rules around complex derivatives, requiring greater disclosure and collateralization. Yet, transparency remains limited compared to exchange-traded instruments.
9. Real-World Examples
Currency Knock-Out Options: Commonly used by multinational corporations to hedge FX exposure cost-effectively.
Asian Options in Oil Markets: Used by airlines to manage jet fuel price volatility.
Autocallable Notes: Retail structured products embedding digital and barrier options that offer enhanced coupons but risk early termination.
These examples show how exotic options have integrated into mainstream hedging and investment frameworks, providing flexibility and innovation.
10. The Future of Exotic Options
With the rise of AI, quantitative finance, and data-driven analytics, the design and pricing of exotic options are becoming increasingly sophisticated. Innovations in machine learning, stochastic volatility models, and blockchain-based smart derivatives promise to make exotic options more transparent and accessible.
However, the challenge remains balancing complexity with clarity. Regulators and financial educators are emphasizing the need for greater transparency and investor awareness to prevent misuse or misunderstanding of such instruments.
Conclusion
Exotic options represent the pinnacle of financial innovation—a class of derivatives that blend mathematics, creativity, and risk management into one. They extend beyond the simplicity of vanilla options, allowing investors to capture nuanced market scenarios, hedge complex exposures, or design innovative return profiles.
However, their sophistication also brings inherent risks—especially in valuation, liquidity, and counterparty exposure. As global markets evolve, the role of exotic options continues to expand, bridging the gap between customized investment strategies and advanced financial engineering.
In essence, understanding exotic options is not merely about mastering a financial product—it’s about appreciating how modern finance tailors risk, reward, and imagination into instruments that shape the dynamics of the global derivatives market.
S&P Nearing Major Resistance (Update)This updates my previous S&P chart back last year showing the S&P still had room to run until any major resistance. We're nearing that major resistance at 7577. Looks like it might hit around January 2026.
The trouble is this trend is heating up and we needed a pullback to 6295. With all the excitement from Nvidia and other major Hyperscalers I'm worried it's going to just go straight to Major resistance. *If it does* we could be looking at a decently large pullback next year (finishing around August) down to that 6295 area and back into the supporting trend line for the next big uptrend to start.
If however we slow down here and get a pullback back to 6295 then I think we're good to make it over the major resistance without that big pullback next year.
Either way once we hit the major resistance at 7577 we'll need to get close to that lower trend line at some point to begin a new bull run.
Good luck and take caution as we approach this resistance!

US500 Strong Bullish MomentumFundamental Analysis
The current bullish trajectory of the US500, is overwhelmingly earnings driven. Robust Q3 corporate results, notably massive beats from tech and consumer giants like Apple with record iPhone sales and services, Amazon’s cloud revenue surge , have provided a decisive fundamental lift. This resilient performance has overshadowed macro uncertainties around Fed policy caution, trade tensions and cemented investor confidence in double digit earnings growth projections for 2026. The rally is characterized by solid breadth, extending beyond mega caps to sectors like Energy, suggesting a durable economic foundation.
Technical Analysis
The US500 exhibits strong bullish momentum, on track for its best monthly streak in years. The index is testing a critical resistance zone between 6,885 and 6,890, formed by the convergence of long-term trend lines. A confirmed weekly close decisively above 6,900 is necessary to validate a powerful breakout toward the psychological 7,000 level and signal an acceleration in the uptrend. Short term downside is currently contained by strong support levels, indicating that pullbacks are likely to be met with active dip buying.
Outlook
The overall outlook for the US500 is constructively bullish into year end. As positive earnings guidance reinforces investor sentiment, the path of least resistance remains higher. However, given the proximity to all time highs and critical technical resistance, short-term volatility and consolidation are likely as the market digests the risk of stretched valuations e.g. (Nvidia's high GDP ratio is a notable concern) before attempting a sustainable move toward the 7,000 mark.
Analysis is by Terence Hove, Senior Financial Markets Strategist at Exness
