S&P 500 | H1 Rising Wedge | GTradingMethodHello Traders,
Similar to the Dow Jones setup, the US500 is also showing a rising wedge pattern. Yesterday, price broke to the downside and is now retesting the wedge — a classic technical setup.
📊 Trade Plan:
Risk/Reward: 5.4
Entry: 6 653.6
Stop Loss: 6 676.8
Take Profit: 6 526
🧐 Market Overview:
Rising wedges are typically bearish continuation/reversal patterns, and the current retest provides an opportunity to align with that probability. That said, wedges can fail, especially around major news events, so risk management is key specially with markets being bullish after the fomc announcement.
💡 GTradingMethod Tip:
When trading wedge retests, always allow the market to confirm direction. A strong rejection on the retest adds confluence and avoids false breakouts.
🙏 Thanks for checking out my post!
Make sure to follow me to catch the next idea and please share your thoughts — I’d love to hear them.
📌 Please note:
This is not financial advice. This content is to track my trading journey and for educational purposes only.
Trade ideas

SPX for Friday 19th SeptemberPrice movement has got really messy now.That is without the spikes.Direction is unclear

SPX updated for Friday 19th Se[temberI have despiked the chart to expose the trend.There are downward spikes making it difficult to read

Index Futures & Options1. Introduction to Index Derivatives
Financial markets thrive on two main goals: wealth creation and risk management. Investors, traders, and institutions constantly look for tools that can help them protect against uncertainties or magnify profits. One such set of tools are derivatives, financial contracts whose value is derived from an underlying asset such as stocks, commodities, currencies, or indices.
Within the derivatives universe, Index Futures and Options are among the most widely traded instruments globally. They are not based on a single stock but on a basket of stocks represented by a market index like the S&P 500 (US), Nifty 50 (India), FTSE 100 (UK), or Nikkei 225 (Japan).
Why indices? Because they reflect the overall performance of a market segment or economy, making them powerful tools for broad-based speculation, hedging, and arbitrage.
2. What are Index Futures?
An Index Future is a standardized derivative contract traded on an exchange where two parties agree to buy or sell the value of an index at a future date for a pre-agreed price.
Unlike stock futures, index futures do not involve delivery of actual shares since an index itself cannot be delivered. Instead, they are cash-settled contracts.
For example:
Suppose the Nifty 50 index is at 20,000 points today.
You buy one Nifty Futures contract expiring next month at 20,100 points.
If, on expiry, Nifty closes at 20,500, you make a profit of 400 points × lot size.
If it closes at 19,800, you incur a loss of 300 points × lot size.
Key Features of Index Futures:
Underlying: A stock market index.
Lot Size: Fixed by the exchange (e.g., 50 units for Nifty in India).
Cash Settlement: No delivery of shares, only the difference in value.
Margin Requirement: Traders must deposit initial and maintenance margins.
Leverage: Small capital controls large exposure.
3. Mechanics of Index Futures Trading
Steps Involved:
Select Index Future (e.g., Nifty, S&P 500).
Choose Expiry (monthly, weekly in some markets).
Place Buy/Sell Order on exchange.
Margin Blocked: Initial margin required (5–12% typically).
Mark-to-Market (MTM) Settlement: Daily profits/losses adjusted in trader’s account.
Expiry Settlement: Final cash settlement at index closing price.
Example:
Trader A buys Nifty Futures at 20,000.
Next day Nifty closes at 20,200.
Profit = 200 × 50 (lot size) = ₹10,000 credited to Trader A.
This daily settlement ensures default risk is minimal.
4. What are Index Options?
An Index Option is a derivative contract that gives the buyer the right (but not obligation) to buy or sell an index at a pre-decided strike price before or on a specified expiry date.
Like futures, index options are cash-settled since indices cannot be delivered physically.
Types of Index Options:
Call Option (CE) – Right to buy index at strike price.
Put Option (PE) – Right to sell index at strike price.
The seller (writer) of the option, however, has the obligation to fulfill the contract if the buyer exercises it.
5. Types of Index Options (Call & Put)
Let’s simplify with an example using Nifty 50:
Call Option Example:
Nifty = 20,000.
You buy a Call Option (CE) with Strike = 20,100 at Premium = 150.
On expiry, if Nifty = 20,400 → Intrinsic value = 300; Profit = 150 (after premium).
If Nifty < 20,100 → Option expires worthless; Loss = Premium (150).
Put Option Example:
Nifty = 20,000.
You buy a Put Option (PE) with Strike = 19,800 at Premium = 120.
On expiry, if Nifty = 19,400 → Intrinsic value = 400; Profit = 280 (after premium).
If Nifty > 19,800 → Option expires worthless; Loss = Premium (120).
6. Pricing & Valuation Concepts
Index futures and options pricing depends on multiple factors:
Futures Pricing (Cost of Carry Model):
Futures Price = Spot Price × (1 + r – d)^t
Where,
r = Risk-free interest rate
d = Expected dividend yield
t = Time to expiry
Option Pricing (Black-Scholes Model):
Key Inputs:
Spot Index Level
Strike Price
Time to Expiry
Volatility
Risk-free Rate
Dividends
Options’ premiums consist of:
Intrinsic Value = Difference between spot and strike.
Time Value = Premium paid for future uncertainty.
7. Key Strategies using Index Futures & Options
Futures Strategies:
Directional Trading:
Buy futures if bullish on market.
Sell futures if bearish.
Hedging:
Long-term investors sell index futures to hedge portfolio risk.
Arbitrage:
Exploit mispricing between futures and spot market.
Options Strategies:
Protective Put: Buy puts to protect long portfolio.
Covered Call: Sell call against index holdings to earn premium.
Straddle: Buy call + put at same strike → profit from high volatility.
Strangle: Buy OTM call + OTM put → cheaper than straddle.
Iron Condor: Combination of spreads → profit in low volatility.
8. Role in Hedging & Speculation
Hedging:
Institutional investors with large portfolios use index derivatives to offset market-wide risks. Example: A mutual fund holding 500 crores worth of stocks may sell Nifty futures to hedge against a market fall.
Speculation:
Traders with directional views use leverage in index futures/options to profit from short-term moves.
Portfolio Insurance:
Buying index puts acts as insurance during market downturns.
9. Advantages & Disadvantages
Advantages:
Efficient hedging tool.
High liquidity in major indices.
Cash settlement – no delivery hassle.
Lower cost compared to trading multiple individual stock options.
Good for expressing macro views.
Disadvantages:
Leverage magnifies losses.
Options can expire worthless.
Requires good understanding of pricing & volatility.
Market risks cannot be eliminated fully.
10. Risks & Challenges
Leverage Risk: Small move in index can wipe out margins.
Volatility Risk: Option buyers may lose premium if volatility drops.
Liquidity Risk: Smaller indices may have low volume.
Systemic Risk: Large index moves can create margin pressures across market.
11. Global Market Practices
US Markets: S&P 500 Futures & Options most traded globally (CME, CBOE).
India: Nifty 50, Bank Nifty dominate F&O segment (NSE).
Europe: FTSE, DAX index derivatives popular.
Asia: Nikkei 225, Hang Seng actively traded.
These instruments are also used by hedge funds, mutual funds, pension funds, and sovereign wealth funds to manage exposure.
12. Case Studies & Examples
2008 Financial Crisis:
Portfolio managers used index puts to hedge against market collapse.
Those without hedges faced catastrophic losses.
Indian Market Example:
During Budget announcements, traders use straddles/strangles on Nifty due to expected high volatility.
Global Funds:
US-based funds often use S&P 500 futures to hedge international equity exposure.
13. Conclusion
Index Futures & Options are powerful instruments that serve dual roles:
Risk Management (Hedging)
Profit Generation (Speculation & Arbitrage)
For institutions, they act as portfolio insurance. For traders, they provide opportunities to capitalize on short-term moves. However, they demand discipline, risk management, and understanding of market mechanics.
In a world where uncertainty is constant, index derivatives are no longer optional – they are essential for anyone engaged in serious investing or trading.
SPX to 6,860$ WITHIN the NEXT WEEK!!!We have been calling this since 5,800$.
I wish I could tell you how I do this.
I have one heck of a set up.
it should keep pumping to 6,860$ as stated!
and thereafter, I don't have to say anymore as there will be the imminent crash I've been talking about.

S&P 500 | Bullish ContinuationS&P500 is in bullish continuation pattern while printing HHs and HLs with no divergence on any timrframe,which indicates that there is a continuation pattern.

US500Success in forex and stocks comes from a combination of knowledge, discipline, and patience. Understanding market trends, economic factors, and company
fundamentals is crucial, but equally important is controlling emotions and sticking to a well-planned strategy. Continuous learning, adapting to changing conditions, and managing risk wisely can turn opportunities into consistent growth over time.
Consistency, not luck, separates successful traders from the rest.

SPY / S&P TOO HOT....gravity is strongMore traditionalist here and following technicals (macro-level). We see insane PE / CAPE ratios, higher than dot.com, most expensive stock market ever, and weakening economy. Not being fooled by tech companies buying from each other with CAPEX (100% depreciation). Correction will happen faster than people think! It's easy to get pumped up by the narrative, but the real story is not good and media outlets like CNBC / FoxBusiness are spinning good stories that are mostly opinions with zero fundamentals or historical context. Best of luck!
Add CBOE:UVIX CBOE:MSTZ CBOE:BTCZ to your portfolio before they spike

S&P500 Key support at 6600FOMC Takeaways
Fed cut rates 25bps to 4.00–4.25%, as expected.
Powell framed it as a “risk-management cut”, tempering hopes for an aggressive easing cycle.
Dot plot now signals 75bps total cuts in 2025 (vs. 50bps before), with softer growth/labour tone.
Markets saw a whipsaw: initial rally → Treasury selloff → equities flat by close.
Market Moves
Equities: S&P 500 closed -0.10%, after falling as much as -0.84% intraday.
Sector split: IT lagged (-0.70%), but financials (+0.96%) and consumer staples (+0.90%) outperformed.
Futures (Asia session): S&P +0.49%, Nasdaq +0.73% → rebound tone.
Rates: Yields higher post-FOMC (10yr +6bps to 4.09%) but down 2–2.5bps this morning.
FX: Dollar Index +0.18% overnight, extending gains despite initial dip.
Trading Implications
Market focus: Is the economy strong enough to sustain gains with only a gradual Fed cutting path?
Bull case: Rate-sensitive domestic sectors (financials, staples, housing-related) showing resilience; futures pointing higher.
Bear case: Transports lag industrials (Dow at records, transports weaker) – a potential warning sign for breadth of the rally.
Catalyst today: FedEx earnings – a key test for global trade/transport demand and market breadth confirmation.
Key Support and Resistance Levels
Resistance Level 1: 6660
Resistance Level 2: 668
Resistance Level 3: 6700
Support Level 1: 6600
Support Level 2: 6570
Support Level 3: 6550
This communication is for informational purposes only and should not be viewed as any form of recommendation as to a particular course of action or as investment advice. It is not intended as an offer or solicitation for the purchase or sale of any financial instrument or as an official confirmation of any transaction. Opinions, estimates and assumptions expressed herein are made as of the date of this communication and are subject to change without notice. This communication has been prepared based upon information, including market prices, data and other information, believed to be reliable; however, Trade Nation does not warrant its completeness or accuracy. All market prices and market data contained in or attached to this communication are indicative and subject to change without notice.

Negative divergence + vwap resistance4h negative divergence + vwap resistance. It's a bull trap, it will go down again (into the bear trap perhaps). 6550 is the minimum target.

S&P 500 Outlook: Bearish Pullback While Under 6,634SPX500 – Technical Overview
The S&P 500 recorded a new all-time high at 6,633 as markets brace for the Federal Reserve’s rate decision later this week.
Futures remain supported by expectations of a 25 bps cut, while traders await Powell’s commentary for guidance on inflation, labor-market weakness, and tariff risks.
Monday’s rally to record highs was fueled by optimism around U.S.–China trade talks, strong tech performance, and fresh gains in gold and mining stocks.
Technical Outlook
📉 Bearish correction:
While price trades below 6,634, a near-term pullback is favored.
Downside targets: 6,605 → 6,590, with deeper support at 6,571 if selling pressure accelerates.
📈 Bullish continuation:
A confirmed 1H close above 6,634 would reassert bullish momentum.
Next upside targets: 6,662 → 6,700.
📌 Market Context:
The Fed’s meeting and Powell’s tone remain the primary catalysts. A dovish message or stronger-than-expected cut could fuel a breakout above 6,634 toward new highs, while a cautious or hawkish stance may encourage a deeper correction before the next bullish leg.

S&P 500 consolidated near a new high zoneThe S&P 500 consolidated near a new high zone of 6600 as markets brace for the Federal Reserve’s rate decision this week. Futures remain supported by expectations of a steady policy stance, while traders await Chair Powell’s commentary for guidance on inflation trends, labour market weakness, and trade risks.
Monday’s rally to record levels was fuelled by optimism surrounding U.S.–China trade talks and strong performance from the technology sector.
Technical Outlook
The Fed meeting and Powell’s tone remain the primary catalysts A decisive break above 6612 could open the way toward the next psychological resistance zone around 6720.
You may find more details n the chart.
Trade wisely Best Of Luck.
Ps; Support with like and comments for better analysis thanks for Supporting.


New all-time high in global financial liquidity1) The Fed has unveiled its new monetary policy trajectory, here are the key takeaways:
- Federal funds rate cycle through the end of 2025: there should be a total of 3 rate cuts by year-end.
- Update of macroeconomic projections: The Fed acknowledges the slowdown in the labor market and still expects inflation to normalize during 2026, allowing time to absorb the impact of tariffs.
- Balance of power among the 12 voting FOMC members: 11 out of 12 voted for a 0.25% rate cut, with only Stephen Miran voting for a jumbo Fed cut.
In the end, Jerome Powell’s Fed has thus enacted a genuine monetary pivot to account for the labor market slowdown, while remaining cautious about the upcoming normalization of inflation. The more accommodative monetary trajectory announced should provide support for risk assets in the stock market, but upcoming U.S. employment and inflation updates will still have a strong impact.
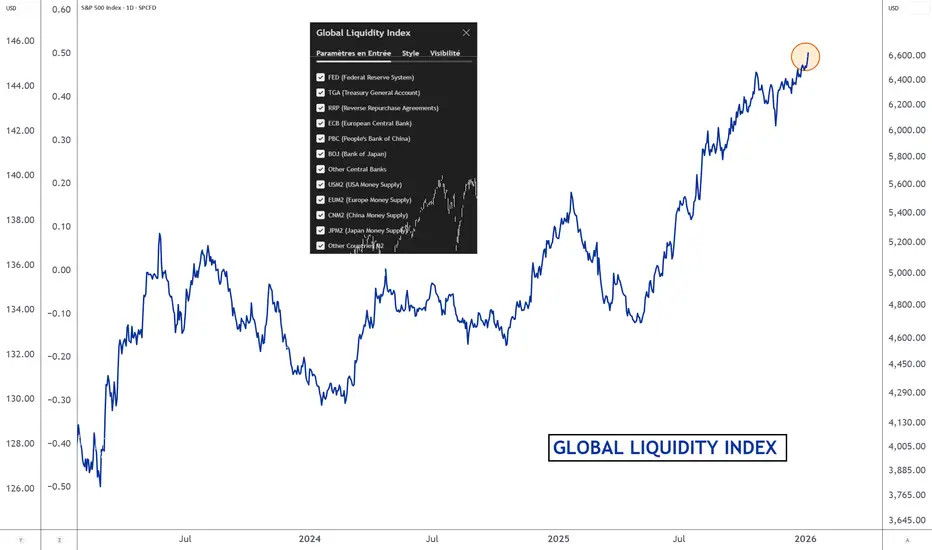
2) Global liquidity hits a new all-time high, a supportive factor for risk assets
Correlation studies show that risk assets in the stock market are highly correlated with the trend in global liquidity, i.e., the sum of the money supplies of the world’s major economies. Simply put, when the underlying trend of global liquidity is bullish, the S&P 500 and bitcoin prices also follow a bullish trend, and vice versa.
There are several ways to represent a country’s money supply, and the M2 monetary aggregate is recognized as the best measure of available liquidity within a state. Global M2 liquidity is calculated by aggregating the money supplies of major economies, notably the United States and China, converted into U.S. dollars (USD). The dollar’s evolution directly influences this measure: a strong dollar reduces global M2 in USD terms, while a weak dollar increases it, affecting capital flows and global financial conditions.
While global M2 liquidity is decisive, the net credit capacity within the financial system also plays a major role. When this is added to global M2, you get global liquidity — and this has just reached a new all-time high, as shown in the chart attached to this article.
This should therefore be a supportive factor for the stock market through year-end.
DISCLAIMER:
This content is intended for individuals who are familiar with financial markets and instruments and is for information purposes only. The presented idea (including market commentary, market data and observations) is not a work product of any research department of Swissquote or its affiliates. This material is intended to highlight market action and does not constitute investment, legal or tax advice. If you are a retail investor or lack experience in trading complex financial products, it is advisable to seek professional advice from licensed advisor before making any financial decisions.
This content is not intended to manipulate the market or encourage any specific financial behavior.
Swissquote makes no representation or warranty as to the quality, completeness, accuracy, comprehensiveness or non-infringement of such content. The views expressed are those of the consultant and are provided for educational purposes only. Any information provided relating to a product or market should not be construed as recommending an investment strategy or transaction. Past performance is not a guarantee of future results.
Swissquote and its employees and representatives shall in no event be held liable for any damages or losses arising directly or indirectly from decisions made on the basis of this content.
The use of any third-party brands or trademarks is for information only and does not imply endorsement by Swissquote, or that the trademark owner has authorised Swissquote to promote its products or services.
Swissquote is the marketing brand for the activities of Swissquote Bank Ltd (Switzerland) regulated by FINMA, Swissquote Capital Markets Limited regulated by CySEC (Cyprus), Swissquote Bank Europe SA (Luxembourg) regulated by the CSSF, Swissquote Ltd (UK) regulated by the FCA, Swissquote Financial Services (Malta) Ltd regulated by the Malta Financial Services Authority, Swissquote MEA Ltd. (UAE) regulated by the Dubai Financial Services Authority, Swissquote Pte Ltd (Singapore) regulated by the Monetary Authority of Singapore, Swissquote Asia Limited (Hong Kong) licensed by the Hong Kong Securities and Futures Commission (SFC) and Swissquote South Africa (Pty) Ltd supervised by the FSCA.
Products and services of Swissquote are only intended for those permitted to receive them under local law.
All investments carry a degree of risk. The risk of loss in trading or holding financial instruments can be substantial. The value of financial instruments, including but not limited to stocks, bonds, cryptocurrencies, and other assets, can fluctuate both upwards and downwards. There is a significant risk of financial loss when buying, selling, holding, staking, or investing in these instruments. SQBE makes no recommendations regarding any specific investment, transaction, or the use of any particular investment strategy.
CFDs are complex instruments and come with a high risk of losing money rapidly due to leverage. The vast majority of retail client accounts suffer capital losses when trading in CFDs. You should consider whether you understand how CFDs work and whether you can afford to take the high risk of losing your money.
Digital Assets are unregulated in most countries and consumer protection rules may not apply. As highly volatile speculative investments, Digital Assets are not suitable for investors without a high-risk tolerance. Make sure you understand each Digital Asset before you trade.
Cryptocurrencies are not considered legal tender in some jurisdictions and are subject to regulatory uncertainties.
The use of Internet-based systems can involve high risks, including, but not limited to, fraud, cyber-attacks, network and communication failures, as well as identity theft and phishing attacks related to crypto-assets.
How Blockchain Could Create a Single Global Marketplace1. The Current Global Marketplace: Fragmented and Inefficient
Despite globalization, today’s international trade and commerce remain highly fragmented:
Multiple currencies → Every country has its own currency, requiring foreign exchange conversion, leading to costs, delays, and risks.
Intermediaries → Payment processors, banks, brokers, and logistics middlemen increase costs.
Trust issues → Buyers and sellers often don’t know each other, so they rely on third-party verification.
Inefficient supply chains → Tracking goods across borders is complex, slow, and prone to fraud.
Regulatory fragmentation → Every country enforces its own trade, tax, and compliance rules.
As a result, cross-border trade is expensive, slow, and sometimes inaccessible for small businesses or individuals. The dream of a truly globalized marketplace remains incomplete.
2. Blockchain’s Core Features and Why They Matter
Blockchain brings several unique features that directly solve the inefficiencies of global commerce:
Decentralization → No single authority controls the ledger, allowing peer-to-peer trade without middlemen.
Transparency → Transactions are visible and verifiable, reducing fraud.
Immutability → Once recorded, data cannot be tampered with, ensuring trust.
Smart contracts → Self-executing agreements automate business logic like payments or delivery confirmations.
Tokenization → Physical or digital assets can be represented as tokens, enabling easy trading.
Borderless payments → Cryptocurrencies and stablecoins allow instant cross-border value transfer.
Together, these features create the foundation for a single, borderless, digital-first marketplace.
3. Building Blocks of a Global Blockchain Marketplace
To understand how blockchain could unify the world economy, let’s break down the key pillars:
a) Universal Digital Currency
The first step is borderless payments. Cryptocurrencies like Bitcoin, Ethereum, and especially stablecoins pegged to fiat currencies already allow instant international transfers.
No need for currency exchange.
Settlement in seconds, not days.
Lower fees compared to SWIFT, Visa, or PayPal.
For example, a freelancer in India can receive payment from a U.S. client in USDT (a dollar-pegged stablecoin) instantly, bypassing banks and high remittance costs.
b) Tokenized Assets
Almost anything — from gold and real estate to art and stocks — can be represented as digital tokens on blockchain. Tokenization creates:
Fractional ownership → Anyone can buy a piece of expensive assets.
Liquidity → Assets can be traded globally without geographic restrictions.
Inclusivity → Small investors can access markets previously reserved for the wealthy.
This democratization of assets is crucial for a true global marketplace.
c) Smart Contracts for Automation
Smart contracts remove the need for trust between strangers. For example:
An exporter ships goods → smart contract releases payment automatically once delivery is confirmed.
A digital service provider delivers work → contract triggers instant payment.
This eliminates disputes, delays, and dependency on lawyers or courts.
d) Decentralized Marketplaces
Blockchain enables decentralized platforms where buyers and sellers connect directly. Examples include:
OpenBazaar (past experiment) → A peer-to-peer marketplace.
Uniswap & decentralized exchanges → Peer-to-peer asset trading.
NFT platforms → Direct artist-to-buyer transactions.
Such platforms reduce fees, censorship, and reliance on corporate intermediaries like Amazon or eBay.
4. Potential Benefits of a Single Global Blockchain Marketplace
1. Inclusivity and Financial Access
Currently, 1.4 billion people remain unbanked (World Bank data). Blockchain wallets give anyone with a smartphone access to global trade and finance.
2. Lower Costs
Cutting out intermediaries means cheaper remittances, payments, and trading. Cross-border remittance costs can drop from 7% to less than 1%.
3. Faster Transactions
International settlements that take days (via SWIFT) can be done in seconds.
4. Trust Without Middlemen
Blockchain’s transparency and immutability allow strangers across the globe to transact securely.
5. Global Liquidity and Market Access
Tokenization enables markets to operate 24/7, allowing capital and goods to move freely without geographic barriers.
6. Economic Empowerment
Small businesses, freelancers, and creators in emerging economies can access global customers directly, without dependence on banks or corporate platforms.
5. Real-World Use Cases
1. Cross-Border Payments
Companies like Ripple (XRP) and Stellar (XLM) are already enabling fast, cheap international transfers.
2. Supply Chain Management
IBM’s Food Trust blockchain allows tracking food from farm to supermarket, ensuring authenticity.
3. Decentralized Finance (DeFi)
Platforms like Aave or Compound let users lend/borrow globally without banks.
4. E-Commerce and Retail
Decentralized marketplaces allow direct buyer-seller trade. Imagine an Amazon alternative run on blockchain where sellers keep more profit.
5. NFTs and Creator Economy
Artists, musicians, and game developers can sell directly to global audiences using NFTs, bypassing labels or publishers.
6. Tokenized Real Estate
Platforms like Propy enable property sales on blockchain, making international real estate investments accessible.
6. The Role of Governments and Institutions
For a global blockchain marketplace to succeed, governments and institutions must play a role:
Global regulatory frameworks → To ensure safety while enabling innovation.
Central Bank Digital Currencies (CBDCs) → Countries like China, India, and the EU are developing CBDCs that could integrate with blockchain.
Public-private partnerships → Collaboration between regulators, banks, and blockchain firms to ensure trust.
Eventually, a hybrid system may emerge where CBDCs and decentralized platforms coexist, bridging traditional finance with blockchain.
7. Conclusion
Blockchain holds the potential to transform our fragmented, inefficient global economy into a single, unified marketplace where trade flows freely, securely, and inclusively. By combining borderless payments, tokenized assets, smart contracts, and decentralized platforms, blockchain eliminates the barriers of trust, geography, and cost.
Challenges remain — regulation, scalability, and adoption — but with growing institutional interest, technological improvements, and grassroots adoption, the path to a global blockchain-powered economy is clearer than ever.
The question is no longer “if”, but “when” blockchain will reshape the world economy. When that happens, trade will not just be global — it will be truly universal.
S&P500 |H1 Rising Wedge | GTradingMethodHello Traders, happy Tuesday!
🧐 Market Overview:
I’ve been closely tracking the rising wedge forming on the 1 hour chart. While this isn’t a pattern I normally trade, the structure caught my attention, and I decided to expose a small amount of risk.
Rising wedges are generally bearish in nature - they don't always have to be though. If I zoom out, markets are over bought on the RSI and there are rsi divergences on multiple timeframes. This is one signal that markets need to cool off before advancing further. So bearing in mind the RSI divergences and the bearish pattern, I have decided to risk a small amount.
Further, if this pattern plays out, it will likely bring crypto down with it.
Ideally, I’d prefer to see a clean double top develop before committing more exposure on the short side.
📊 Trade Plan:
Entry: 6 633.7
Stop Loss: 6 648.7
Take Profit: Not predefined (will target structural support levels highlighted on the chart)
🙏 Thanks for checking out my post!
Make sure to follow me to catch the next idea and please share your thoughts – I’d like to hear if anyone else is trading this pattern or if you have any tips on how to trade it.
📌 Please note:
This is not financial advice. This content is to track my trading journey.

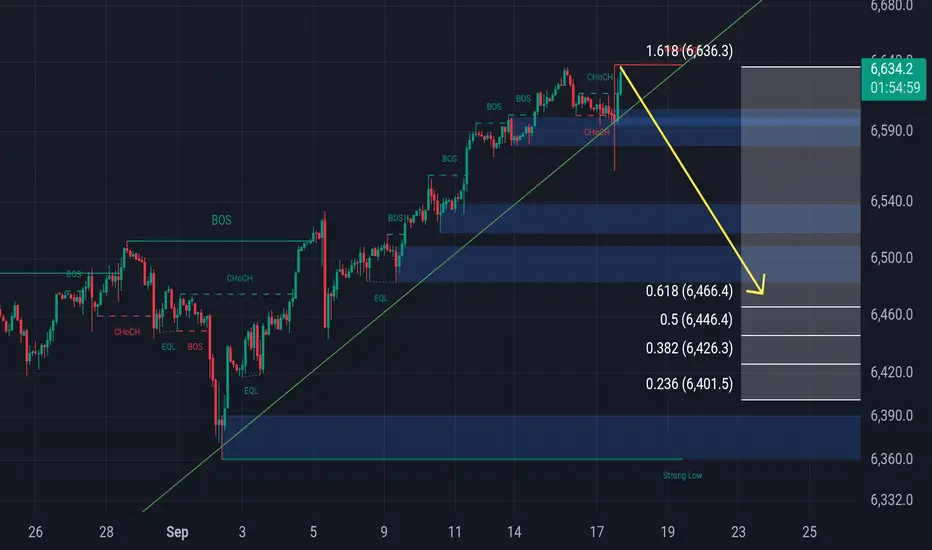
Monitoring possible Retest of BOS then .618This is just a short scalp, not a permanent short.. Monitoring the flow on the 2hr, Im seeing a bearish divergence leading into an apex.. I havent posted in awhile and thought I would share something im working on..
Up and down all aroundJust a possible path according to EW theory. This 5-wave move can extend into the end of the year.

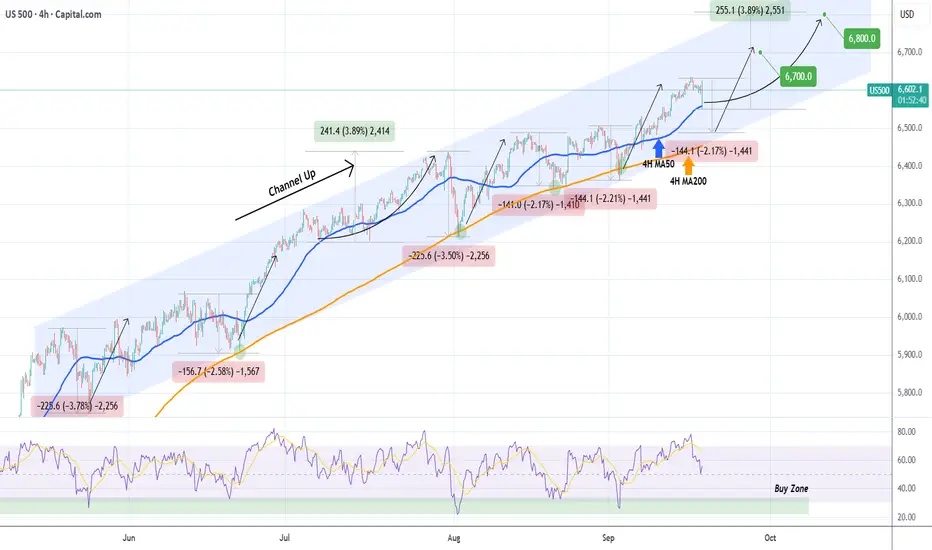
S&P500 Risks drop to the 4H MA200 if MA50 fails.The S&P500 index (SPX) is experiencing a strong intra-day correction that just hit its 4H MA50 (blue trend-line) for the first time since September 05. As long as this holds, we expect a gradual rise, targeting 6800 (representing a +3.89% increase similar to July's).
A 1D candle closing below the 4H MA50 however, has historically paved the way to more selling within the 4-month Channel Up, that touched the 4H MA200 (orange trend-line) before rebounding. If that candle closing takes place, we will close the 4H MA50 buy on minimum loss and buy on the 4H MA200, targeting 6700 (sharp rebound similar to all 4H MA200 bounces).
Keep also an eye on the 4H RSI Buy Zone. It has given the 5 most optimal buy entries during these 4 months. Note also that the 4H MA200 has been holding as Support since the April 25 break-out.
-------------------------------------------------------------------------------
** Please LIKE 👍, FOLLOW ✅, SHARE 🙌 and COMMENT ✍ if you enjoy this idea! Also share your ideas and charts in the comments section below! This is best way to keep it relevant, support us, keep the content here free and allow the idea to reach as many people as possible. **
-------------------------------------------------------------------------------
💸💸💸💸💸💸
👇 👇 👇 👇 👇 👇
S&P500 | H2 Double Top | GTradingMethodHello Traders,
Watching the S&P for a potential double top.
It also aligns with the retest of the rising wedge, which is has already broken to the downside. This kind of confluence gives me extra excitement about a trade.
What I still need to happen for me to open the trade:
- H2 candle close in the entry range
- H2 candle that closes in the range needs a certain closure rate
- RSI needs to create another divergence
- Volume needs to be lower on T2, although my system does give exceptions if there is a data release, in this case FOMC, so exception will likely apply.
📊 Trade Plan:
Risk/reward = Between 3.3 and 4.3
Entry price = Between 6630 and 6639.9
Stop loss price = Between 6649.2 and 6656.8
Take profit level 1 (50%) = 6576
Take profit level 2 (50%) = 6553
I would ideally like my stop loss above the rising wedge, that way it needs to break through both barriers.
Also, if this pattern plays out, I think it will drag the crypto market down with it... Unfortunately.
💡 GTradingMethod Tip:
Always predefine your risk before entering a trade. This is a non negotiable to becoming a professional trader.
🙏 Thanks for checking out my post!
Make sure to follow me for updates and let me know in the comments — do you see the wedge retest as bearish, or do you think the bulls have more room to run?
📌 Please note: This is not financial advice. This content is to track my trading journey and for educational purposes only.
Peace
G

S&P/Nasdaq bearish caseBearish case for equities today:
This count has short-term pain for long-term gain.
Looking for initial pump, then dump over the next few days, target buy below 6144 for S&P and 22226 for Nasdaq.
If correct, VIX (UVIX) should pop.

Update Before the Big Rate Decision: Expected to Lower RatesUpdate Before the Big Rate Decision: Expected to Lower Rates

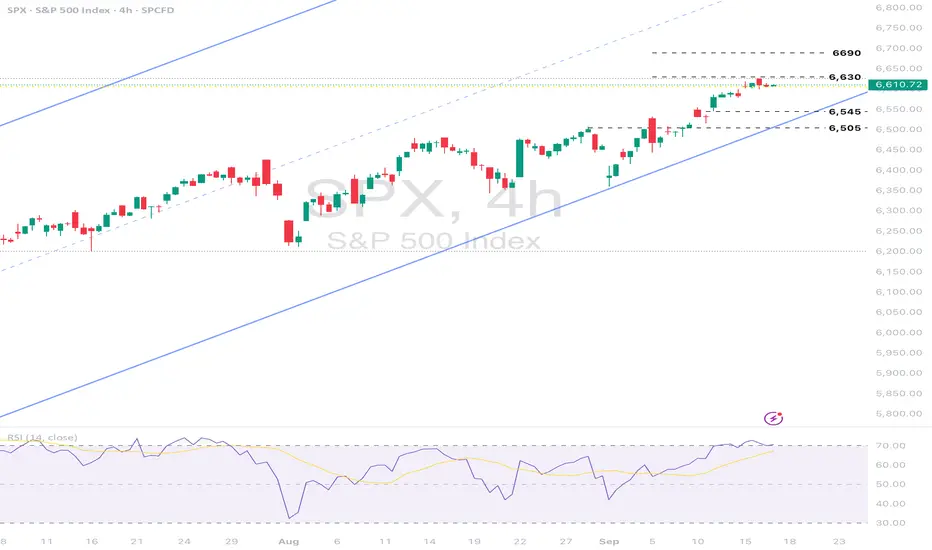
US500: Disconnection between equity prices & broad economic dataThe US500 is trading near record highs with the index up nearly 18% over the year. The market is driven by optimism about an imminent Fed rate cut, robust Q3 earnings, and continued strength in large cap tech shares, but fundamental valuation concerns and signs of overbought technical conditions persist.
Fundamental Analysis
The rally is resting on expectations that the Federal Reserve will announce its first 2025 rate cut this week, likely by 25 basis points.
Mega cap tech and rate sensitive sectors are leading gains, but economic headwinds remain, unemployment is ticking higher, and indicators like retail sales and leading economic indicators have weakened.
Valuations among the top US500 stocks are stretched, with the top 10 names trading at a forward P/E of 30x well above historical averages and record levels of cash hoarding notably by Berkshire Hathaway are raising caution flags.
Disconnection between equity prices and broad economic data is notable, with softening consumer metrics and elevated corporate bankruptcies.
Technical Analysis
Technical signals remain mostly bullish, as the index continues to trade within a strong uptrend and posts new highs.
Short-term technical indicators such RSI show overbought conditions and weak breadth could signal fatigue.
Key support is found at 6,545, then at 6,505 while immediate resistance is at the all-time high and then at projected levels of 6,630 ahead of 6,690.
Analysis by Terence Hove, Senior Financial Markets Strategist at Exness