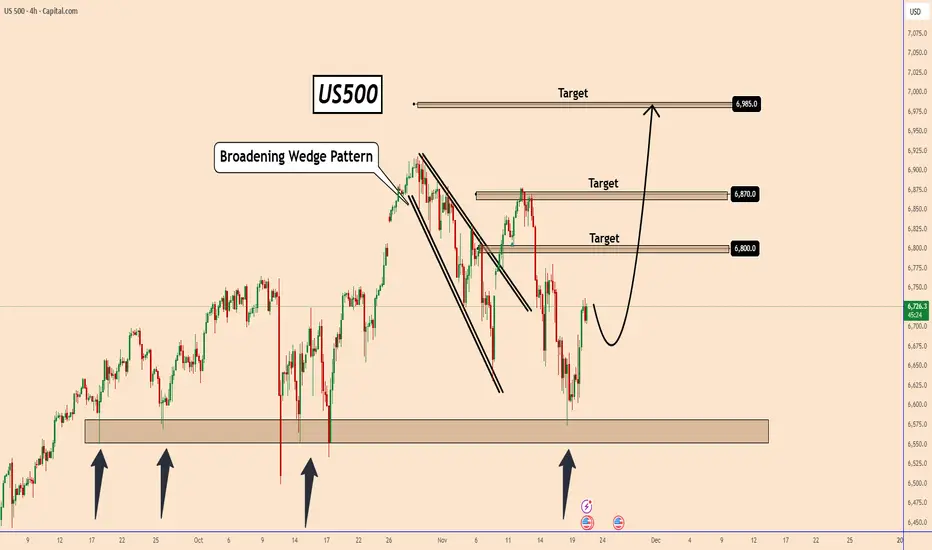
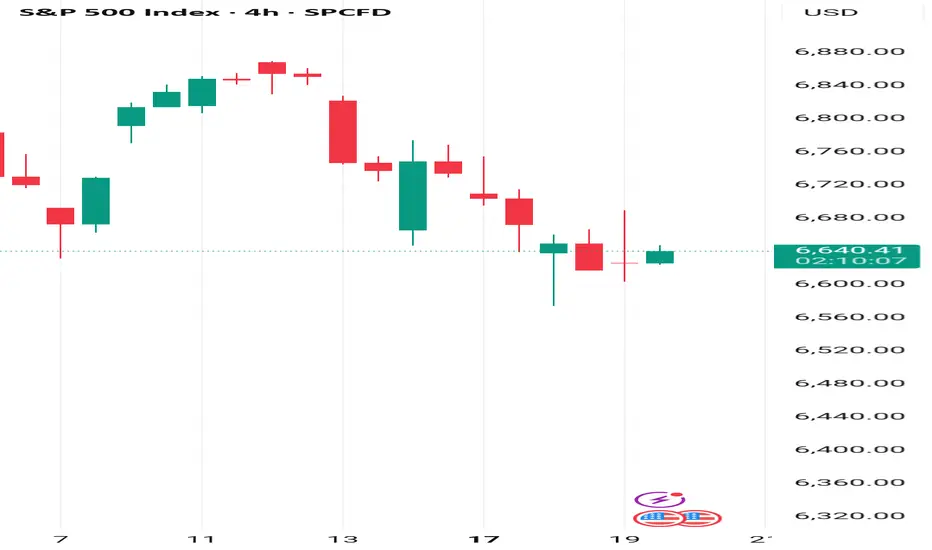
US500: Strong Reversal Zone Holding | Potential Rally AheadUS500 – Strong Reversal Zone Holding | Potential Rally Ahead
US500 has once again reacted strongly from the major support zone marked on the chart — an area that has held multiple times in the past.
Buyers stepped in aggressively, preventing further downside and maintaining the broader bullish structure.
After forming a broadening wedge pattern followed by a sharp decline, price has stabilized and is now showing early signs of a potential bullish reversal.
If momentum continues building, the next upside targets are:
6,800
6,870
6,985 (major target)
You may find more details in the chart!
Thank you and Good Luck!
❤️PS: Please support with a like or comment if you find this analysis useful for your trading day❤️
Trade ideas
S&P 500 needs a correctionLooking at the volume, we see that the price is rising but the volume is declining in line with it. This indicates a high probability of a correction, in my view. Short the S&P 500 to 6146, where I expect at least an attempt to form a new bottom. Let the bears do their thing; an update will follow.
⚠️ Not financial advice.

SPX500 – Key Breakout Levels Ahead of NFP | Bearish Below 6734SPX500 | OVERVIEW
Stocks soar on Nvidia earnings relief as the company delivered forecasted quarterly revenue well above Wall Street expectations, easing recent concerns over AI-sector valuations that had contributed to a market pullback.
Markets now shift focus to the U.S. Non-Farm Payrolls (NFP) report, which is expected to generate strong volatility across indices.
Technically:
Stocks rally after Nvidia’s strong earnings forecast, easing some AI-valuation concerns. Markets now await the NFP report, which could fuel major intraday volatility.
Below 6734: Bearish continuation toward 6670 → 6635 → 6610
Above 6754: Bullish breakout toward 6800 → 6844
Pivot: 6734
Support: 6670 · 6635 · 6610
Resistance: 6769 · 6800 · 6844
SPX500 stays bearish under 6734, and only a strong candle close above 6754 will confirm bullish momentum.


S&P 500 dip-buying setup?Keep an eye on this technical setup; I watch it closely, and it has proven to have a good track record. As you can see from the charts below, the VIX has closed north of the upper Bollinger Band (set to 2 standard deviations), and the daily price of the S&P 500 recently formed an AB=CD pullback to 6,594. This technical confluence often delivers a dip-buying opportunity.
Written by FP Markets Chief Market Analyst Aaron Hill

De-Globalization and Globalization: Role in the Trade Market1. What Is Globalization?
Globalization refers to the increasing interconnectedness of countries through trade, capital flows, technology, labor mobility, and communication networks. It removes barriers between nations by promoting:
Free trade agreements
Cross-border investments
Multinational corporations expanding globally
Technology transfer and innovation diffusion
Movement of goods, services, and people
Key Drivers of Globalization
Trade Liberalization: Reduction of tariffs and quotas by organizations like WTO.
Advances in Technology: Internet, logistics, digital payments, AI.
Global Supply Chains: Production spread across multiple countries.
Capital Mobility: Foreign direct investment (FDI), foreign portfolio investment (FPI).
Transportation Efficiency: Low-cost shipping, aviation growth.
Benefits of Globalization
Lower cost of goods and services.
Higher economic growth for emerging markets.
Access to global markets for domestic producers.
Innovation through global competition.
Greater consumer choices.
Challenges of Globalization
Job losses in industries exposed to global competition.
Income inequality within countries.
Over-dependence on global supply chains.
Faster transmission of economic crises.
Despite these challenges, globalization dominated world trade through the 1990s and early 2000s, shaping a highly interconnected economic landscape.
2. What Is De-Globalization?
De-globalization refers to the process of reducing global interdependence. It involves countries restricting trade, limiting foreign investments, reshoring manufacturing, and prioritizing domestic production over global integration.
The shift began with economic nationalism and strengthened due to several global events:
Key Causes of De-Globalization
Geopolitical Tensions:
US–China trade war, Russia-Ukraine conflict, Middle-East instability.
Supply-Chain Vulnerabilities:
COVID-19 exposed heavy reliance on foreign manufacturing.
Protectionism:
Rising tariffs, import bans, and industrial subsidies.
National Security Concerns:
Restrictions on semiconductor exports, defense technologies, and data.
Energy and Food Security Risks:
Nations prioritize domestic reserves to avoid shortages.
Characteristics of De-Globalization
Regionalization of trade (Asia-centric, EU-centric, US-centric blocs).
Friend-shoring and near-shoring instead of global sourcing.
Declining share of global trade in GDP.
Stricter FDI regulations.
Rise of self-reliance policies—e.g., India’s Atmanirbhar Bharat.
Impact of De-Globalization
Higher manufacturing costs.
Slower global GDP growth.
Volatile commodity and currency markets.
Strategic competition between major economies.
De-globalization does not mean an end to global trade—it indicates a restructuring toward secure and region-based trade networks.
3. Role of Globalization in the Trade Market
Globalization has been the backbone of the modern trade market for 30+ years. Its influence can be identified in multiple areas:
(a) Expansion of International Trade
Countries specialized based on comparative advantage:
China in manufacturing
India in IT services
Middle East in oil
USA in technology and finance
This specialization increased global efficiency and lowered production costs.
(b) Growth of Multinational Corporations (MNCs)
Companies like Apple, Toyota, Samsung, and Unilever built supply chains across continents, boosting cross-border trade and investments.
(c) Deep Supply Chains
Products became globally integrated.
Example: A smartphone may involve design in the US, chips from Taiwan, assembly in China, and software from India.
Such supply-chain integration increased trade volume significantly.
(d) Increased Capital Flows
Globalization enabled investors to diversify by investing in foreign stocks, bonds, and real estate. It boosted foreign direct investment (FDI) and global liquidity.
(e) Boost to Emerging Markets
Countries like India, China, Vietnam, and Indonesia benefitted from export-led growth, attracting foreign companies and creating millions of jobs.
(f) Lower Prices & Higher Consumer Choice
Global competition reduced product costs, giving consumers access to global brands at affordable prices.
4. Role of De-Globalization in the Trade Market
De-globalization has introduced new dynamics that reshape how global trade functions.
(a) Rise of Protectionism
Countries impose tariffs to protect local industries.
Examples:
US tariffs on Chinese steel and electronics
India’s import restrictions on certain electronics to promote local manufacturing
This reduces global trade flows and pushes countries toward self-reliance.
(b) Reshoring Manufacturing
Companies move factories closer to home markets to avoid supply disruptions.
This impacts trade routes and reduces dependency on distant suppliers.
(c) Regional Trade Blocs
ASEAN, EU, USMCA, and African Continental Free Trade Area (AfCFTA) are forming tighter regional trading networks.
Trade becomes more regionalized rather than global.
(d) Geopolitical Trade Wars
Strategic competition, especially US–China, impacts:
Semiconductor exports
Technology transfer
Patents and IP laws
Digital trade regulations
Such restrictions create uncertainty in global trade.
(e) Commodity & Energy Security
Nations stockpile oil, gas, and minerals to ensure autonomy.
This leads to price volatility and new trade corridors like India importing discounted oil from Russia.
5. Combined Impact on Global Trade Markets
The world is entering a hybrid phase—neither fully globalized nor fully de-globalized.
Key Trends Shaping the Future
Shift from globalization to regionalization but not complete isolation.
Digital globalization continues through data, software, AI, and digital payments.
Supply-chain diversification reduces over-reliance on any single country.
Strategic industries (chips, defense, energy) remain highly protected.
Developing countries like India, Vietnam, and Mexico gain new manufacturing opportunities.
Winners in This Transition
Countries offering supply-chain stability
Nations with strong digital and technology ecosystems
Economies able to balance both global and domestic trade strategies
Losers
Countries dependent on single-market exports
Economies heavily reliant on cheap manufacturing
Nations vulnerable to geopolitical conflicts
Conclusion
Globalization and de-globalization are not absolute states but two ends of a spectrum continually shaping the world economy. Globalization promoted trade expansion, innovation, economic growth, and international cooperation. De-globalization emerged as a corrective phase to address vulnerabilities exposed by global tensions, supply-chain crises, pandemics, and national security threats.
The modern trade market is now characterized by a blend of globalization’s connectivity and de-globalization’s strategic caution. Countries are trading more selectively, focusing on trusted partners, secure supply chains, and balanced economic policies. Going ahead, the world is likely to embrace “smart globalization,” where nations seek benefits of global trade while protecting their strategic interests.
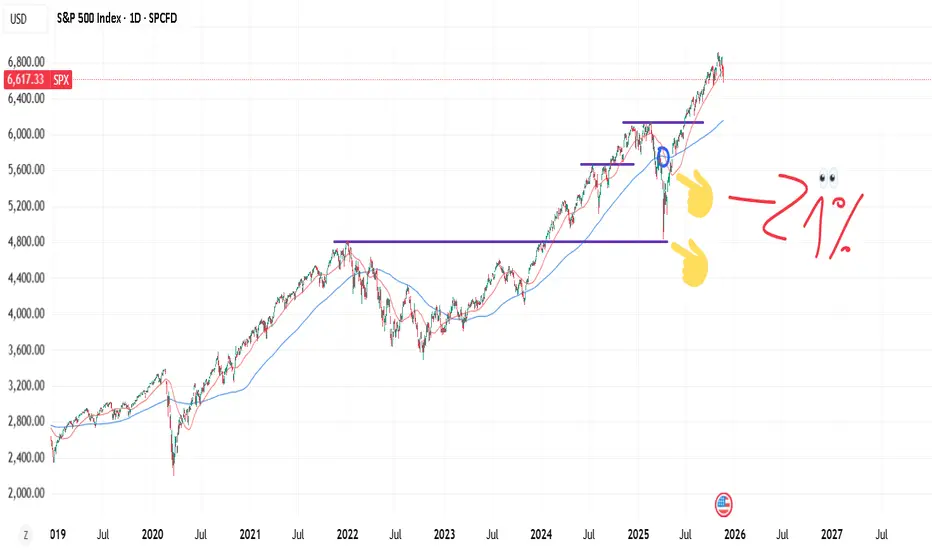
S&P 500 to print final move to 6500It goes without saying, this bull market has been the most hated I’ve ever known. Retail traders attempts to go “short” on every leg up resulted in quick squeezes. Every 1% to 4% correction brought renewed calls for the end of all things. Including time I believe. There is a reason why 90% of market participants fail in trading. Emotions.
The last four long ideas published by Without Worries are linked below. Read the comments in each to get an impression of the distain retail traders have for this bull market. The Cup and Handle idea for example, published on November 9th 2023. Many reading the idea were understandably skeptic. I tell you that to tell you this... The idea was much more than a chart pattern. The idea included studies from Dollar index and more importantly market sentiment.
So lets focus on those two in a little more detail.
** Market sentiment **
The market sentiment in November last was incredibly bearish. The Put/Call ratio was sky rocketing, in other words retail traders were all “short” on the market. That was a mistake. Guess what? They're doing it again.
Weekly Put/Call ratio
If you follow my practices you’ll know one of our golden rules, we never never long into active resistance. Just don’t. Don’t even think about it.
On the above weekly Put/Call chart we can see retail traders are betting heavily with both feet for a market correction as the Put/Call ratio shows a strong demand for “Short” contracts. We can see RSI is actively rallying into resistance. Oh dear…
** The dollar index **
The dollar has entered a bull market. Or so it appears. On the 2-day chart below price action has printed a Life Cross with the index trading above the 2-day/200 sma.
However on closer inspection just as in late 2022 and indeed late 2023, both price action and RSI support have failed. This will be a short lived bull market, for now.
Support and resistance is the ultimate cheat code. It has been integral to the previous ideas shared. It amazes how many continue to dismiss the importance of practicing this simple concept. Look left.
2-day DXY
** The conclusion **
On the above monthly chart several technical developments have occurred. Together with market sentiment and dollar index structure, the combination provides a powerful message.
The red arrows highlight each significant market top over the last 10 years when sentiment was incredibly bullish. The blue arrows record sentiment at extreme bearish levels.
Here’s the interesting part, when sentiment was this bearish price action was already at the lower half of the rising channel. There is not an instance when a rise from lower to higher half of the channel with confirmation of support (we’ve confirmed) did not result in a resistance test at the top of the channel.
The resistance is now between 6500 and 6700.
Is it possible the market collapses like many retail traders are now calling for? Sure.
Is it probable? No.
Ww
** previous S&P 500 ideas **
S&P 500 - Cup and Handle
S&P 500 - Why everyone is wrong
S&P 500 - Why everyone is wrong - Part II
S&P 500 to 6000

S&P 500 — Double Top Setup by FRLThe market remains in an uptrend, but FRL highlights a critical moment.
Price is testing the origin of the last impulse — the key FRL level that separates continuation from reversal.
A confirmed close below this level will complete the double-top formation and shift the trend into a corrective phase.
If confirmation comes, the natural FRL target lies at the 0.618 retracement, which aligns with the 200-day SMA — a strong confluence support.
Previous similar FRL setup (fully played out):
Nasdaq 100: Double Top or Double Bottom? (FRL Setup)

US500 Post-Nvidia Earnings: A Cautiously Optimistic RevivalThe release of Nvidia's robust quarterly earnings will serve as a critical pivot point for the US500, temporarily dispelling acute market anxieties that led to a recent four day losing streak. The overall outlook shifts from one of pre-earnings jitteriness and valuation concerns to cautious optimism driven by fundamental strength in the dominant tech sector.
Fundamental Analysis: AI Momentum Validated
The core of the market's positive reaction lies in the fundamental validation of the Artificial Intelligence (AI) mega-trend, which Nvidia remains the central, high-beta bellwether for.
Robust Financial Performance: Nvidia is expected to deliver a significant beat, reporting Q3 revenue of $54.9 billion, a staggering 57% year-over-year increase and providing bullish Q4 guidance of $62.2 billion in projected revenue, alongside strong EPS.
Sector Wide Relief: These numbers directly address the market's key worry, whether the elevated valuations of tech stocks, particularly those linked to AI, were justified. The massive revenue and growth trajectory from the AI chip leader suggests that the capital expenditure cycle in data centers and AI infrastructure remains incredibly strong.
The Valuation Dilemma: While the results provide support, the broader US500's valuation remains elevated at approximately 25 times earnings. This suggests that while the growth engine of AI/Tech is firing on all cylinders, the market's pricing leaves little room for error. The fundamental analysis suggests that the current rally must be consistently backed by strong economic data or further aggressive growth from the largest companies.
Technical Analysis: Battle at Resistance
The price action of the US500 suggests a recovery is underway, but key technical hurdles must be overcome to confirm a re-establishment of the medium-term uptrend.
Recovery and Support: The index successfully recovered from multi-day losses, with immediate support forming near 6,600. This area, combined with the technical floor from the recent pullback at 6,574, is now viewed as the crucial dip-buying zone for bulls seeking trend stability.
Overhead Resistance: The immediate technical challenge for the US500 is the resistance 6,700. A decisive breakout above this level is mandatory to trigger fresh buying momentum and signal a potential move toward testing recent all-time highs.
Volatility Remains High: The recent spike in the Volatility Index (VIX), which touched 22, highlights that despite the positive catalyst, the market structure remains highly volatile. Traders are still anticipating sizable moves, indicating that the index is not yet in a period of calm, sustained advance. The overall medium-term uptrend is intact above key support but is vulnerable to renewed profit-taking.
Sentiment Analysis & Outlook: Relief vs. Lingering Risk
Market sentiment has shifted from anxiety to a sense of relief and renewed optimism, but deep seated macro risks prevent euphoria.
The AI Bubble Fear Eases: Nvidia's expected strong performance has temporarily quieted concerns about an imminent "AI bubble" or a broader market correction led by tech weakness. Momentum stocks, especially semiconductors and megacap tech, are enjoying a strong tailwind.
Macro Risks on the Horizon: The market's focus will quickly pivot to non-tech catalysts, specifically interest rates and the highly anticipated delayed jobs report later this week. Any downside surprise from this key economic data could immediately negate the tech-driven positive sentiment.
Near-Term Outlook: The outlook is for cautious stabilization and the potential for modest further gains. For the US500 to sustain a rally and target new highs, it must achieve two things:
Technical Confirmation: Sustain above the 6,600 support and successfully break the 6,700 resistance.
Macroeconomic Alignment: The upcoming economic data must not present a surprise that forces the market to re-evaluate the Federal Reserve's policy path.
Nvidia has bought the market time and provided a strong catalyst. The US500 is breathing a sigh of relief, but the path forward remains highly sensitive to macro news flow and the resilience of the AI trade outside of this singular earnings report.
This analysis is by Terence Hove, Senior Financial Markets Strategist at Exness
Stocks set to significantly outperformStocks are back on major support and are set to significantly outperform. It's a good idea to be out of gold or USD and pile into stocks for a real increase in value. Shorting gold isn't a bad idea either.
Ignore the bubble talk. When there's a real bubble you'll go out to eat and hear the table next to you talking about stocks.
Wednesday 19 November: Forex thoughts Today's 4 HR S&P opening candle (for me) epitomises the trading week so far. Periods of positivity and periods of negativity, with neither action particularly having any 'juice' behind it. It feels like we are 'waiting for something' (NFP?).
Currently, correlations are out of the window and it's difficult.
Sentiment for the JPY remains subdued (rate hike pushed back, if there will be one at all). Which makes the JPY very shortable. But getting the timing correct is easier said than done.
The GBP continues to be remarkably resilient and the AUD continues to under perform its fundamentals.
As things stand, I wouldn't like to hazard a guess at the outcome or reaction to any of the upcoming events (FOMC, NVIDIA, NFP). So, I'm content to observe and form a fresh opinion post NFP.
Yesterday's trade stopped out very quickly, I realise it was bold and unconventional but given the underlying negativity at the time, I still don't think it was the worst idea in the world.
Maybe you have a different interpretation of the week's events so far?
S&P 500 Reversal Roadmap: Second Bottom Forming at PRZ?As I expected in the previous idea , the S&P 500 index has indeed reached its targets after breaking through the Support lines .
Currently, the S&P 500 is approaching the Support zone($6,580_$6,490) , Potential Reversal Zone (PRZ) , and the 100_SMA(Daily) .
There’s a possibility of forming a second bottom and a descending channel in the S&P 500, suggesting that the second bottom could form near the PRZ .
From an Elliott Wave perspective, it seems that the S&P 500 is completing the microwave 5 of the microwave C of the main wave Y .
I expect that, after entering the PRZ or approaching the 100_SMA(Daily) , the S&P 500 will resume its upward movement and potentially rise to around $6,664 .
Note: The S&P 500 currently has a significant impact on the markets, especially cryptocurrencies like Bitcoin( BINANCE:BTCUSDT ). Therefore, a potential rise in the S&P 500 could positively influence Bitcoin as well.
First Target: $6,664
Second Target: $6,723
Stop Los(SL): $6,499
Please respect each other's ideas and express them politely if you agree or disagree.
S&P 500 Index Analyze (SPX500USD), 1-hour time frame.
Be sure to follow the updated ideas.
Do not forget to put a Stop loss for your positions (For every position you want to open).
Please follow your strategy and updates; this is just my Idea, and I will gladly see your ideas in this post.
Please do not forget the ✅' like '✅ button 🙏😊 & Share it with your friends; thanks, and Trade safe.

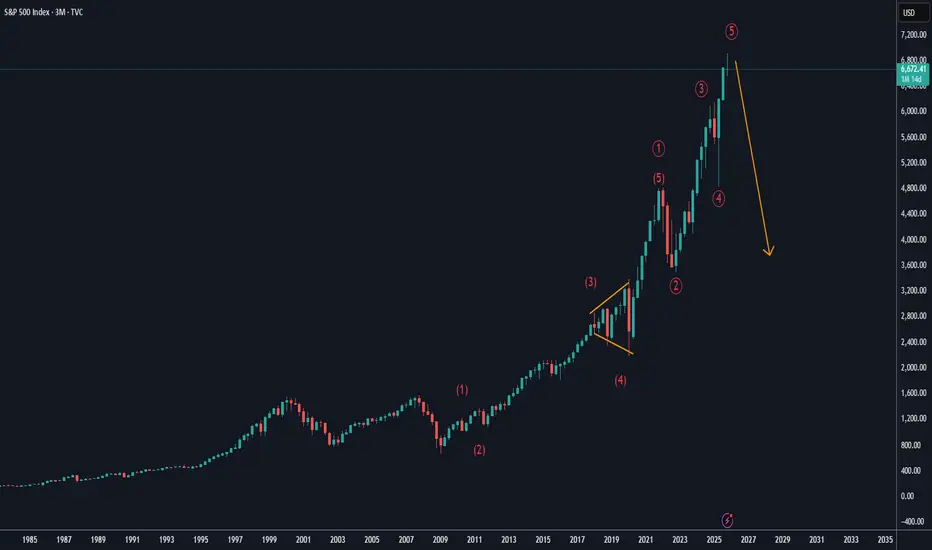
DECODED ANALYSIS S&P 500 INDEX DECODED ANALYSIS S&P 500 INDEX
Historical Chart Study from1871 to Present.
Based on the decoded multiple yearly candle structure, the S&P 500 grand cycle confirms that its final (last yearly pattern) is forming in a downtrend.
In comparison, the Dow Jones Industrial Average formed its final (last yearly pattern) in an uptrend in 1974.
For the S&P 500 to maintain its structure, the index must move above $6,993.
Key Resistance Levels noted:$6,993
Additional Resistances: $7,256, $7,362, $7,633
Resistances noted for year 2030 at $10,396, $10,740
Support Levels:
Upper Supports: $5,903, $4,871, $3,947, $3,688, $3,590, $3,385
Main Yearly Pattern Support: $2,476
Multiple skipped supports detected, with the lowest noted at $3.25
Disclaimer:
This analysis is for educational purposes only.
Always conduct your own research DYOR.

SPX500 Softens as Tech Valuation Concerns Rise Before EarningsSPX500 | Overview
U.S. futures slipped lower as traders shifted into risk-off mode, driven by renewed concerns over stretched AI and tech valuations ahead of Nvidia’s earnings, set to be released after the market close tomorrow.
Sentiment remains cautious, and price action continues to respect the current bearish structure.
Technically:
SPX500 maintains a bearish momentum while trading below 6670, with downside targets at 6635 and 6610.
A break below 6610 would extend losses toward 6578.
A bullish recovery will only be possible if the price closes a 1H or 4H candle above 6670, which would open the path for a move toward 6706 and potentially 6722–6754.
Key Levels
Pivot Line: 6670
Support: 6635 · 6610 · 6578
Resistance: 6706 · 6722 · 6754
Outlook:
SPX500 remains bearish below 6670, targeting 6635–6610.
A confirmed 1H/4H close above 6670 would shift momentum toward 6706–6722, signaling the first sign of a bullish reversal.

Cognitive Bias VS PrejudgmentCognitive Bias is how you or your brain process or interpret information. What you strongly believe in. (Influenced by beliefs, expectations, emotions, and shortcuts).
Prejudgment could be things that are "most of time true, but not always". Learned truths that can be false. (Prejudgment is treating a general rule as always true).
... markets move based on Supply-Demand dynamic, structural positioning and "least resistance". Markets follow the economy. And there are merits to using quant statistics.
Prejudgment: (Based on DOW theory or Tudor Jones upsloping 200dma) - there is less risk buying strong bull markets. When DOW is broken, price bellow 200dma - it means bear market. In practice this was a statistical scarce spot where big money is made.
-20% is usually a good indicator as well as bottom for the top1% stocks? as well in bitcoin, that wouldn't fall that much.
Prejudgment: Stocks follow the economy (true), tariffs pose risks to economy ie cause recession, hence a bear market.
Statistically, based on like previous 6 years, every sharp drop gets re-filled instantly. ie the V shape recoveries. mirroring 2020. There was a positional imbalance.
Cognitive Bias: trending near the bottom ---> affirms your fears of crash. or bubble talks. Prices follow S-D dynamic, not charts.
Another one is believing that most people are in fear. Which equates a crash.
cognitive biases in short -- you favor or over emphasize the importance of near term events over longterm proven statistics. Markets repeat over and over again, in same psychological patterns.
Old Ship Fleet: uncertainty and risk.In the old days, buying a trading ship posed risks due to natural disasters. Later on, people could have option to buy lets say a 10% share in a fleet of 10 trading ships. When one ship goes down, it doesn't ruin your "portfolio".
I think the concept about not putting all eggs in one basket fits well into risk taking.
Then you have some investors claim, you put all your eggs into one basket - and guard the basket.
The ship fleet works as a syllogism about uncertainty. Math (probability of disaster on statistical basis). And risk taking.
Eggs in one basket is a syllogism about losing everything. But not uncertainty or risk-taking per se.
-> In competitive spaces, with only few or one winner. With exponential, explosive returns -- diversifying or putting eggs in separate baskets make no sense. "Fortune favors the bald" is a better way to describe it.
but it says nothing about mathematical side of uncertainty or risk taking. Hence the "old ship fleet".
Past Resistance = Future Support: Winter 2025-2026 Rally Coming!Past Resistance = Future Support: Winter 2025-2026 Rally Coming!
This video discusses technical reasons why a winter rally is forthcoming; and why market fears are only that; 'pivots' toward the growth of the US economy and new all time highs.

7K End Of Year $SPX Rally into Bearish Deep Crab Plummet? Let's see if this pattern plays out with the Administration touting "money printing" to stimulate the economy, while jobs and the economy are in major decline. Not trading or investment advice. Entertainment only.

Sell you stocks! -227.20% the secreat ATH finder
We reached the secret Fibonacci level (-227.20%) on SPX.
Something big is going on.
This level worked perfectly to spot 2021 ATH on the SPX and now seems to be happening again.
I sold the majority of my stocks. What are you doing?


the PopLooks like a reversal here. A break below the lows and I'm incorrect. Everything is popping. Watch Oil for a break up above the 18ma soon.

S&P 500 falls below 6K - key levels to watchAs highlighted the possibility yesterday, the S&P 500 has now fallen to a fresh multi-week low. The old low at 6631 is now the most important level to watch in terms of upside resistance. Above that 6638, yesterday's low, will come into focus ahead of 6650/5 area.
On the downside, the mid-October lows of 6533 and 6500 are the next areas of interest for the bears. Will we get there? Perhaps if NVidia earnings disappoint tomorrow night.
By Fawad Razqzada, market analyst with FOREX.com
