SPX: Tariffs 2.0 slams marketSPX stumbles as trade tensions resurface, feeding volatility into Friday's close. Friday was a painful day on financial markets, with a correction of 2,71%. For one more time it all started with the announcement on social networks of the US President that the US will impose 100% tariffs on imports from China starting November 1st. The rest is history - around $2 trillion from markets was wiped out. A similar situation occurred in April this year, when the never-ending story about tariffs started. Finally, the market settled that around 40% tariffs on imports from China would not impact the US economy at the higher level. However, analysts are estimating that the 100% tariffs might hurt the US economy more severely.
Semiconductor stocks like Nvidia and AMD led Friday’s market decline. Nvidia fell 5% amid uncertainty over its efforts to gain approval from the U.S. and China to sell downgraded AI chips. AMD, which had recently driven the tech rally, dropped nearly 8%. Apple and Tesla also saw sharp losses, down 3% and 5% respectively. However, the pullback wasn’t limited to China-exposed names, it was a broad-based sell-off, with 424 of the S&P 500 stocks closing in the red. The magnitude of the drop forced institutional investors to de-risk across the board, selling other positions to cover losses and raise cash as tech dragged portfolios lower. Only a few defensive names, including Walmart and tobacco-related stocks, managed to end the day slightly higher.
The current question is what does Monday bring? On one side, investors might continue to perceive tariffs impact negatively, so the correction might continue. On the opposite side are investors who will be in the mood of wait-and-see if a current threat of 100% tariffs will actually come to effect, or some sort of agreement on the state levels will be achieved.
Trade ideas

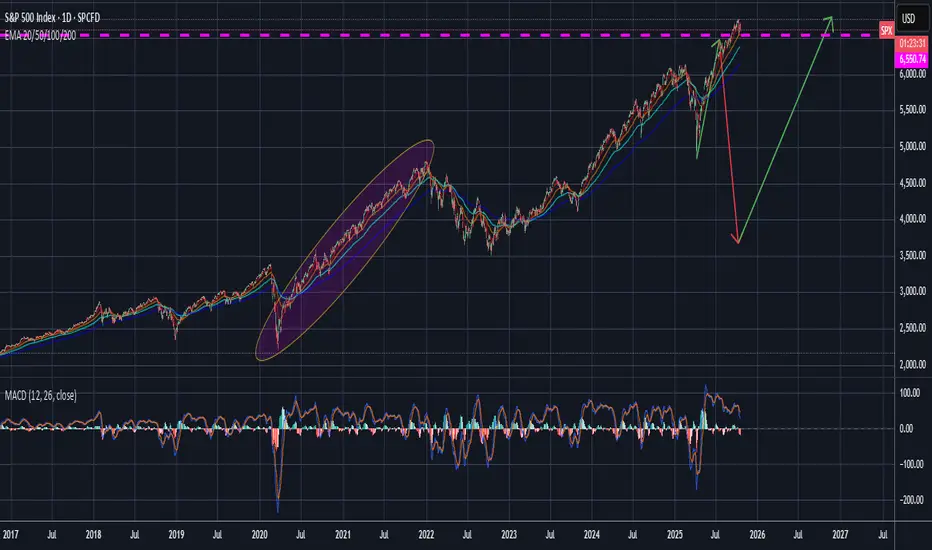
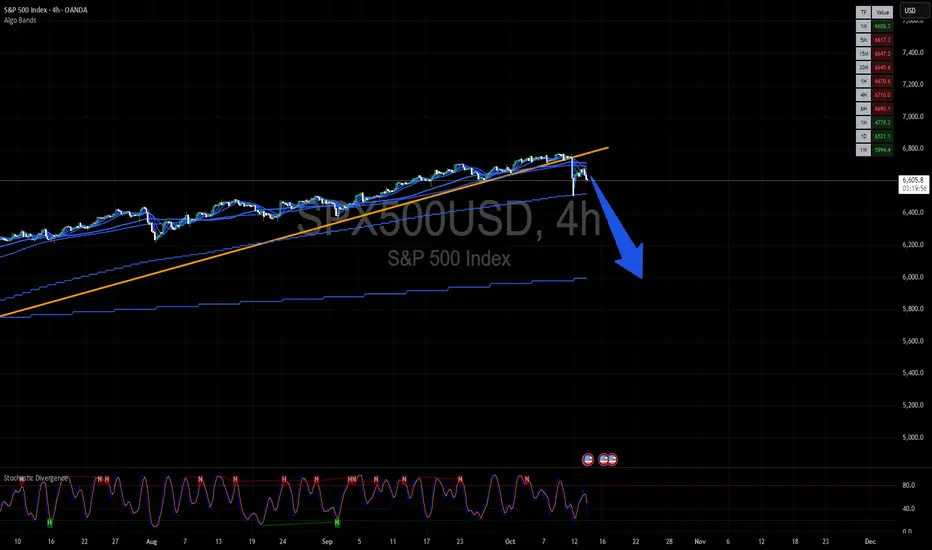
S&P 500 The Bull Run Is Over. Watch the Yellow Level.The S&P 500 rally looks exhausted.
Over the past week, momentum has clearly faded, lower highs, weaker daily closes, and stronger selling pressure on each bounce.
Technically, the market shows early signs of a shift from bullish to corrective or bearish.
The Yellow Level acts as a divider between a mildly bullish market and the start of a medium-term bearish phase.
Above the Yellow Level: price may hold short-term strength or consolidation.
Below the Yellow Level: structure breaks down and downside potential expands.
A daily close below the Yellow Level would confirm the beginning of a broader bearish move.
In my view i suggest all the Trader/Investor which they are reading this to stay AT LEAST 80/90% IN CASH. something is about to happen... stay safe!

SPXShift prediction to the right a bit. I think almost everyone in these markets are waiting to sell.... I'm thinking if SPX closes below $6650 today, that will give the signal the wolves are looking for.
Still anticipating brief freefall on crypto ~1 week and brief correction on stocks ~1 month.
Short timeframe, but huge drop. Good luck.
S&P 500 Index Near Key Resistance – Correction Ahead?Recently, the S&P 500 ( SP:SPX ) has seen some sharp moves with high momentum due to the tariff tensions between the US and China over the past couple of weeks. These moves have also impacted other correlated markets like cryptocurrency .
In the past day, news came out that Trump is planning to meet the Chinese president on October 31st . With markets opening, the S&P 500 started to rise and is currently moving near a Resistance zone($6,734_$6,690) and close to its Resistance lines .
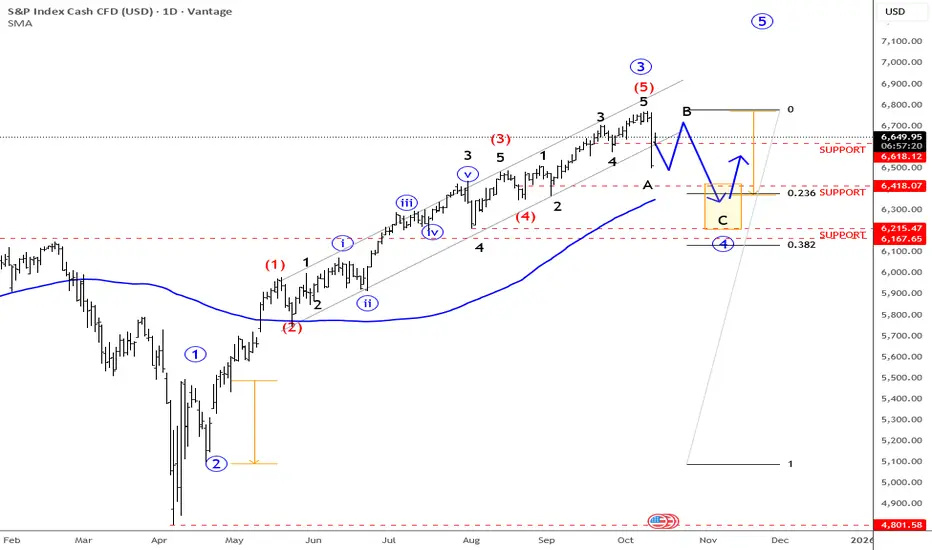
From an Elliott Wave perspective, it seems that the S&P 500 is completing a microwave 5 of the main wave C , and the corrective structure looks like an Regular Flat(ABC/3-3-5) .
I expect that in the coming hours, the S&P 500 index could drop at least to around $6,641(First Target) .
Second Target: $6,611
Stop Loss(SL): $6,735
Note: The $6,641 level is quite important in the context of the recent rally and could act as both support and resistance for the S&P 500.
A possible decline or fall in the S&P 500 index could also cause Bitcoin to decline (due to Bitcoin's high correlation with the S&P 500 index in recent weeks).
Please respect each other's ideas and express them politely if you agree or disagree.
S&P 500 Index Analyze (SPX500USD), 1-hour time frame.
Be sure to follow the updated ideas.
Do not forget to put a Stop loss for your positions (For every position you want to open).
Please follow your strategy and updates; this is just my Idea, and I will gladly see your ideas in this post.
Please do not forget the ✅' like '✅ button 🙏😊 & Share it with your friends; thanks, and Trade safe.

SPX: Markets have spokenThe previous week continued to be volatile on US equity markets, after the Fridays sell off, two weeks ago. It seems like with all uncertainties coming from the US Government, the market took the time and said: it's enough. This was especially evident on intraday trading, where values of equity indicators were moving from highly negative to highly positive. It seemed like there was no direction in trading. Eventually, the Friday trading session ended up in a positive territory, where the S&P 500 closed the week at 6.664 or 0,5% higher for the day. In order to save the day, the US President commented shortly on Friday on social networks, that 100% tariffs on imports from China is not sustainable. Previously, Fed Chair Powell noted at NABE Conference that further cuts are still an option in the future period, but it will depend on data. At the same time, the US Government continues to be in the state of “shutdown”, not providing any relevant macro data. Both investors and the Fed are currently acting in a sort of blindfolded territory.
Nvidia was especially under pressure during the previous week. The only positive day for the stock was Friday, where the share price increased by 0,78%, but still marking negative territory for the second week in a row. Shares of Apple surged by 1,96% on Friday after the announcement of a contract between Apple and Formula 1 over five-year exclusive U.S. media-rights with Formula 1, starting from 2026, under which Apple TV will become the sole U.S. broadcaster of all F1 races. On the other hand, the semiconductor industry has not experienced such a high volatility. The TSMC delivered a standout performance, topping earnings expectations and raising its guidance, through which the company fuelled investors' confidence.
Without official macro data, the week ahead will be another one which will be guided by fundamentals and/or announcements from the US Administration. It means that markets are going to stay within the “yellow” zone. Analysts are commenting that this zone does not mean that the market will switch to the red zone and significant correction, but only that they are currently highly alerted.
SELL S&P 500from the price action point of view the S&P 500 is looking bearish. having been that the chart has formed a complete rising wedge. it liking to test and intra supoort level on 30H. of 6600.
#bearish #S&P500 #Fundamentalanalysis #technicalanalysis

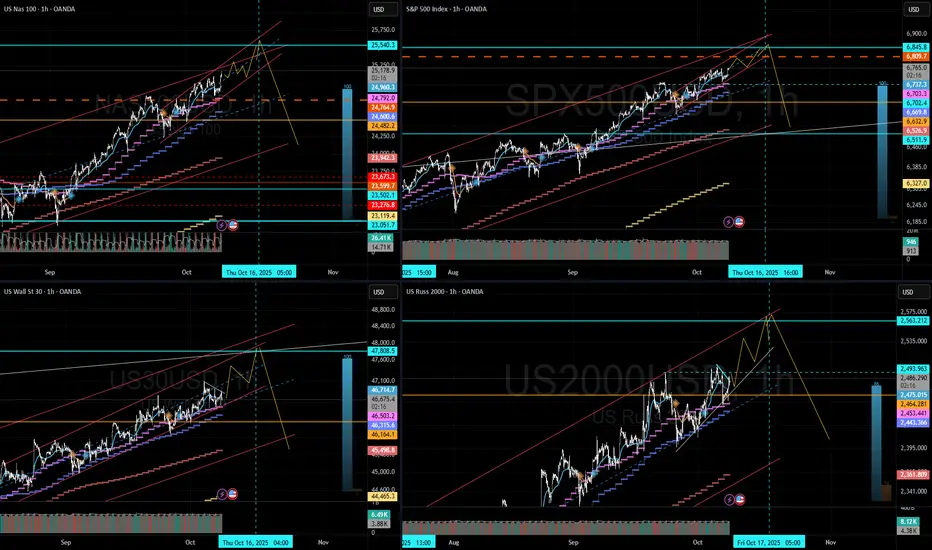
NAS, and all indices lining up for Oct. 17thOct. 17 Options Expiration could be a catalyst for a market correct higher degree Wave 2.
Or very close a few days after.
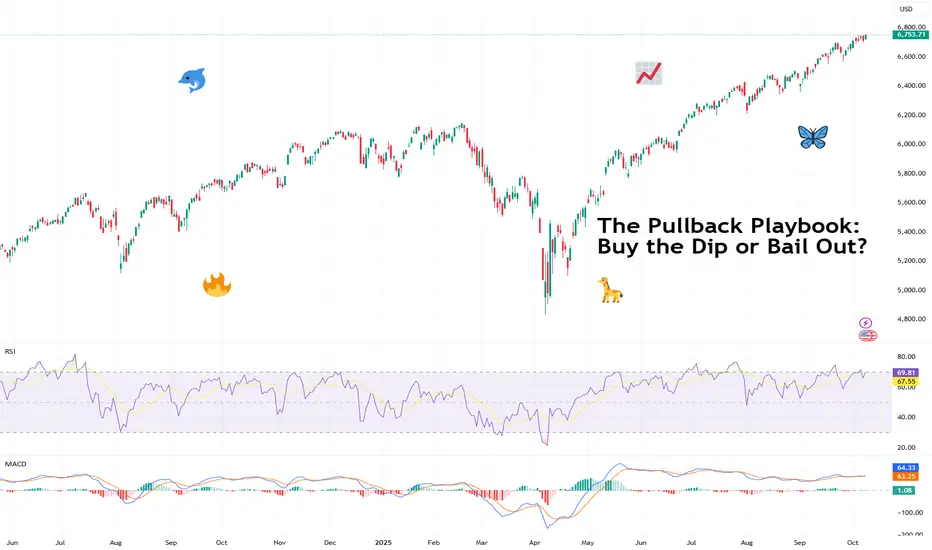
The Pullback Playbook: Buy the Dip or Bail Out?Markets don’t go up in straight lines. Even the strongest trends pause, retrace, and test your conviction.
These pauses are called pullbacks and they can either be healthy breathers before the next leg higher or the first cracks in a trend about to fall apart. The challenge for traders is knowing the difference.
📉 What Exactly Is a Pullback?
Think of a pullback as a temporary trend halt, not necessarily a crash. The price moves against the prevailing trend for a short period, testing support levels or shaking out weak hands before deciding where to go next. They’re common, normal, and — if managed right — they’re opportunities rather than threats.
But here’s where it gets tricky: not all pullbacks are trend halts. Some are the start of a flat-out reversal. And unless you’re comfortable holding through a potential nosedive, you need skills and tools to tell which is which.
🧐 Pullbacks vs. Trend Reversals
So how do know if you’re looking at a pullback or a trend reversal? The main differentiating factor is the length of the move. The healthy pullback looks orderly — modest in size, controlled in volume, and often retracing to familiar moving averages or support zones.
A healthy pullback might retrace 3-5% in a bull run, testing the 20- or 50-day moving average before bouncing higher.
A trend reversal barrels through multiple support levels in days, erasing weeks of gains. It’s often sharper, louder, and driven by news or panic.
Signs of a healthy pullback include:
• Price holding above key moving averages (20, 50-day. Some stretch to the 100-day but these tend to be rare — it’s more likely a trend reversal by then).
• Volume shrinking on the way down, then swelling on the rebound.
• Oscillators like RSI cooling off from overbought territory without plunging into oversold.
Trend reversals look more like:
• Breaks of multiple support levels in one go.
• Heavy, accelerating sell volume.
• Headlines driving panic: tariffs, central bank surprises, data releases from the Economic calendar , crypto exchange blowups, or noise coming from the Earnings calendar .
📊 Technical Tools to Judge the Dip
Charts can’t predict the future, but they can help you gauge probabilities. Pullbacks often line up with Fibonacci retracements, moving averages, or horizontal support and resistance levels.
• Moving Averages : If price pulls back to the 50-day and holds, that’s often a green light for trend continuation. If it slices straight through the 100-day? Not so healthy.
• Trendlines : Respecting the line = confidence. Breaking it = trouble.
• Volume : Low-volume pullbacks suggest sellers aren’t that committed. High-volume dumps are red flags.
None of these are crystal balls. But together, they give you a framework to avoid buying every dip.
🏄♂️ The Psychology of Buying the Dip
Why do traders love dips? Because everyone wants a discount. A pullback offers a chance to jump on a trend at a better price, and social media culture has turned “buy the dip” into a meme strategy. But memes don’t pay the bills when a dip turns into a crater.
The psychology works both ways:
• Optimists see dips as golden tickets.
• Pessimists see them as traps.
• Realists know both can be true, depending on the setup.
Being aware of your own bias — whether you lean toward buying too early or panicking too soon — is half the battle.
🔄 Asymmetric Risk and the Smart Bet
Here’s where it gets interesting. You don’t need to be right all the time if your risk-reward ratio is skewed in your favor. A tight stop and a wide target can mean one win cancels out several small losses.
Imagine risking 1% to potentially make 10%. Even if you’re wrong most of the time, the math can work. Pullbacks are prime territory for asymmetric setups: smart, thought-out entries, clear invalidation points (below support, trendline breaks), and attractive upside if the trend resumes.
This doesn’t mean chasing every dip. A pullback can wipe your position clean if you’ve placed your stop loss a little too close, a little too early.
⏳ Timing Matters
The biggest mistake with pullbacks is trying to catch the exact bottom. Traders love to brag about nailing the wick, but most who try end up paying for it. Smarter is to wait for confirmation — a bounce, a reversal candle, a break back above a short-term moving average.
Yes, you may miss the lowest price. But you’ll also miss buying into a freefall.
🌍 Pullbacks in Context
Context is everything. A dip in a raging bull market is not the same as a dip in a shaky sideways market. Macro matters too. If the Fed is cutting rates , risk assets might rebound fast. If tariffs, wars, or inflation are spiking, a pullback could turn into something bigger and deeper.
That’s why traders zoom out before diving in. Daily charts tell one story; weekly charts often tell the bigger tale.
🚀 Buy or Bail?
So, do you buy the dip or bail out? The honest answer is: it depends. A well-structured pullback in a strong uptrend with unchanged fundamentals is an opportunity.
A violent, volume-heavy selloff in a fragile market with cracked fundamentals is a warning.
The pullback dilemma isn’t just about charts but also about psychology. Can you hold your nerve when the market wobbles, or will you cut and run? Both choices can be right in the right context.
🎯 Final Takeaway
Pullbacks are part of every trend’s DNA. They test conviction, patience, and risk management. The key isn’t to predict every wiggle but to recognize whether price action is just cooling off or signaling something bigger.
Stay disciplined, respect your stops, and let the chart, not the noise, tell you when it’s time to stay in or step aside.
Off to you : Buy the dip? Or bail out? How do you respond to expected and unexpected market pauses? Let us know your coping mechanism in the comments!
SP500: Breaks Out Of Channel, Steps Into Wave Four I hope you had a nice weekend despite that nasty turn lower on stocks we saw on Friday. As you know, the move came after Trump threatened to impose new tariffs on China, following China’s own restrictions and tighter export controls on rare earth metals, which are crucial for the tech sector. We’ve seen this story before back in April, and if tariffs come back into focus again, traders will likely react with fear — so it’s not a surprise we saw such a strong drop in stocks on Friday.
Normally, markets are most sensitive when this kind of news first hits, and then they tend to stabilize afterward. What’s interesting, though, is that despite the strong sell-off in stocks, the dollar index didn’t show the kind of sharp upside reaction you’d usually expect. So I’m wondering if stocks can find some support, but seems like this can be only wave B rally, since we are in the middle of wave four retracement. Keep in mind there is an open gap lower on futures.
Big supports is at 6400 and 6200.
Grega
SPX500 – Overview | Bearish Pressure Below 6,699SPX500 – Overview | Bearish Pressure Below 6,699
U.S. stock futures opened the week flat, as easing U.S.–China trade tensions offered some relief to markets.
Investors are now turning their focus to a busy earnings week and upcoming inflation data, while diplomatic meetings between U.S. Treasury Secretary Scott Bessent and Chinese Vice Premier He Lifeng aim to further defuse tensions ahead of a potential Trump–Xi summit later this month.
🕯 Technical Outlook
SPX500 remains under bearish momentum while trading below 6,699, targeting 6,670 → 6,633 → 6,610.
If the price closes a 1H candle above 6,716, it would shift momentum bullish, with upside targets at 6,754 and beyond.
Pivot: 6,699
Support: 6,670 – 6,633 – 6,610
Resistance: 6,716 – 6,731 – 6,755

SPX500 NEW HIGHSAccording to Gann: The high came at 6766--a cardinal level. Thereafter, SPX sold off and found support at 6602--another cardinal level. This shows you that the SPX is vibrating to the Static Sq9--very nice! That is what we need here. It means that once we start the correction all the levels you see listed here will become important. It doesn't mean that every level will offer support, but it does mean you need to pay close attention to each one as we go down. You can trade off them. Oddly enough, markets often become easier to trade the more volatility you have.

Hellena | SPX500 (4H): SHORT to support area of 6646 .Colleagues, in the last forecast I was counting on price reaching the 6550 area, but that plan turned out to be a long term plan. I see the sense in making some shorter term targets.
The closest target I see is the 6646 support area, where wave “4” ends. This is a corrective movement, so it is necessary to realize that the price may continue to fall after reaching the target.
Fundamental context
U.S. inflation remains elevated — CPI rose to about 2.9 % YoY, with core inflation around 3.1 %. At the same time, the labor market continues to cool, and corporate earnings show mixed results. Combined with the Fed’s cautious stance and ongoing fiscal uncertainty, this creates pressure on the stock market.
Manage your capital correctly and competently! Only enter trades based on reliable patterns!

SPX500 Weakens as Markets Focus on Fed Rate-Cut HintsSPX500 – Overview | Bearish Pressure Below 6,699
Markets are focusing back on the Federal Reserve after Chair Jerome Powell hinted at the possibility of further rate cuts, calming investor sentiment despite lingering U.S.–China trade tensions.
For now, optimism around policy easing is offset by uncertainty in risk assets.
🕯 Technical Outlook
The price has reached resistance at 6,699 and is now stabilized below it, suggesting potential for further downside.
As long as price trades below 6,699, momentum remains bearish, targeting 6,670 → 6,634.
A 1H close above 6,700 would shift momentum bullish, opening the path toward 6,754.
Pivot: 6,699
Support: 6,670 – 6,635 – 6,609
Resistance: 6,717 – 6,754 – 6,791

SPX500 Long From Support!
HI,Traders !
#SPX500 made a retest
Of the wide horizontal
Support level of 6581.19
And a local rebound is
Already taking place so
We are bullish baised
And we think that a local
Bullish correction is to
Be expected !
Comment and subscribe to help us grow !

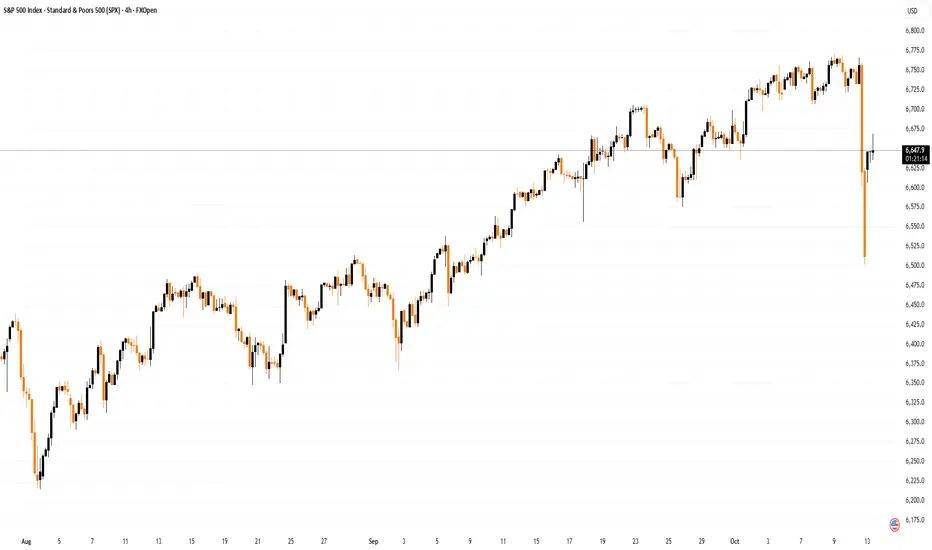
$SPX Sell is not over yetHuge down move on Friday on Trump's tweet. And a gap up yesterday and market was sideways. So we are going up from here? It was a super bearish candle on Friday and technical points to further downside.
Indeed, my call at 840pm EST timestamped was followed by a 80 pts sell down. I could be wrong but I see 6000 or so; confluence of support, and even down to 5800 (50 Fib) before a huge rally towards end of year.
SPX500 NEW HIGHSThis picture includes the 50 day moving average. In addition to Static Sq9 support at 6602, keep an eye on the 50dma at 6549. A close below the 50dma will get the attention of a lot of traders. Once the SPX closes below the 50dma, look for a waterfall decline as traders and investors start to panic.

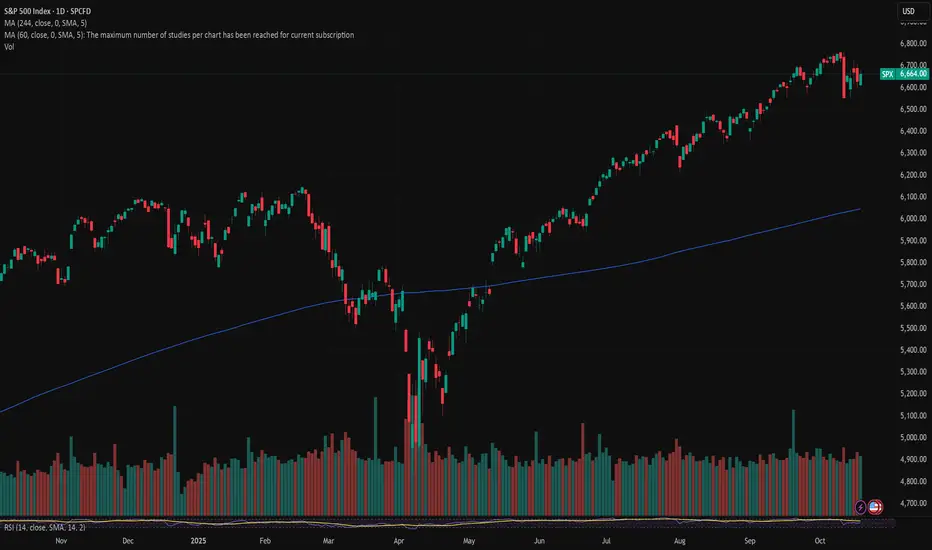
Bulls fight back but bearish signals lingerRecent mixed price and momentum signals on the S&P 500 suggest traders should keep an open mind on whether to play the index from the long or short side in the near term.
For the bulls, the strong bounce from a zone comprising the 50-day moving average and May 23 uptrend over the past two sessions suggests the buy-the-dip trade remains alive despite Friday’s sharp pullback, pointing to the potential for an eventual retest of the record high at 6766.
However, bearish divergence with RSI (14) raises questions about the sustainability of the move, especially with MACD having already crossed the signal line from above before proceeding to trend lower. Bullish momentum is weakening, not building, likely keeping bears interested for the moment.
For those looking to play the index from the long side, there are few setups worth considering. If we were to see a break above 6700 resistance, longs could be established above the level with a stop below, targeting the record high of 6766 initially. Alternatively, another pullback and bounce from the 50DMA/May uptrend support zone would provide a decent entry level, allowing for longs to be set with a stop below for risk management purposes. Potential targets include Tuesday’s high, 6700 or 6766.
For the bears, a failure to clear 6700 resistance would create a short setup, allowing for trades to be established beneath the level with a stop above for protection. The 50DMA/May uptrend support zone screens as a logical initial target, with 6500 and 6360 other options after that.
Good luck!
DS

S&P 500 Index Shows Elevated VolatilityS&P 500 Index Shows Elevated Volatility
On the 4-hour chart of the S&P 500 Index (US SPX 500 mini on FXOpen), the ATR indicator with standard settings has not fallen below the 30 mark, signalling higher current market volatility compared to previous periods. Traders’ decisions are being influenced by the ongoing government shutdown, developments around a potential US-China tariff deal, and an increasingly active earnings season. Market sentiment has also been shaped by renewed concerns over regional bank stability and profit-taking in AI-related stocks.
Looking ahead, the new week is also expected to bring heightened volatility, as:
→ US Treasury Secretary Scott Bessent and Chinese Vice Premier He Lifeng are set to meet in the coming days, paving the way for a potential meeting between Presidents Trump and Xi later this month.
→ Attention will also turn to quarterly results from Netflix, Coca-Cola, Tesla, IBM, and Intel. With key US economic data releases suspended due to the government shutdown, investors are likely to look to corporate earnings for direction.
Technical Analysis of the S&P 500 Chart
Major turning points on the 4-hour S&P 500 chart, highlighted in bold, outline a broad ascending channel that reflects the market’s expanded price swings.
From a bullish perspective:
→ The price remains in the upper half of the channel.
→ Market sentiment is improving, with prices moving closer to last week’s highs during the European session.
→ As indicated by the arrow, a wide bullish engulfing pattern formed near the lower boundary of the channel, confirming strong buying interest around the 6,560 level.
From a bearish standpoint:
→ Selling pressure was particularly aggressive near 6,720, pushing the price lower on 10 October.
→ Last week, this level once again acted as resistance, suggesting that bears maintain control there, limiting near-term upside potential.
Given these dynamics, traders may wish to adjust their strategies to account for the prevailing volatility. Should positive headlines emerge on US-China trade progress, supported by upbeat corporate forecasts, the S&P 500 could make a push towards the upper channel boundary, potentially setting a new record near the 6,800 mark.
This article represents the opinion of the Companies operating under the FXOpen brand only. It is not to be construed as an offer, solicitation, or recommendation with respect to products and services provided by the Companies operating under the FXOpen brand, nor is it to be considered financial advice.

Trump’s Decision Shakes Global Financial MarketsTrump’s Decision Shakes Global Financial Markets
On Friday, 10 October, President Trump made an unexpected statement about the possible introduction of 100% tariffs on Chinese goods, triggering sharp price swings across global markets:
→ Stock markets: The S&P 500 index tumbled by more than 3%, hitting its lowest level in over a month.
→ Currency markets: The US dollar slumped sharply against other major currencies.
However, on Sunday, Donald Trump softened his tone on Truth Social, suggesting that trade relations with Beijing “will be absolutely fine”. Vice President JD Vance echoed this sentiment, adding that the United States is ready for talks if China is “prepared to act reasonably”.
This shift in rhetoric from US officials helped markets recover, with the S&P 500 index rebounding sharply at Monday’s open, reclaiming much of Friday’s losses.
Technical Analysis of the S&P 500 Chart
In our previous analysis of the 4-hour S&P 500 chart (US SPX 500 mini on FXOpen) on 4 October, we identified an upward channel (shown in blue) and expressed several concerns:
→ The price was approaching the upper boundary of the channel, where long positions are often closed for profit.
→ The latest peak slightly exceeded the October high (A), suggesting a potential bearish divergence.
→ The news blackout caused by the government shutdown created an “information vacuum”, which could quickly turn sentiment negative if filled with adverse developments.
The lower boundary of the blue channel offered only temporary support near 6,644 points on Friday before the price broke downwards. Doubling the channel width provides a projected target near 6,500, which coincides with Friday’s low.
Given these factors, it can be assumed that the lower line of the blue channel now acts as the median of a broader range following Friday’s sell-off. This suggests that in the coming days, the S&P 500 index may stabilise as demand and supply find temporary balance along this line.
Looking further ahead, the situation may resemble that of early April, when after a panic-driven market drop (also triggered by Trump’s tariff comments), the S&P 500 not only fully recovered but went on to reach new highs.
Key Levels:
→ 6,705 – a level that has acted as both support and resistance this autumn;
→ 6,606 – the boundary of the bullish gap.
This article represents the opinion of the Companies operating under the FXOpen brand only. It is not to be construed as an offer, solicitation, or recommendation with respect to products and services provided by the Companies operating under the FXOpen brand, nor is it to be considered financial advice.
SPX500 Drops as Regional Banking Worries Shake Wall StreetSPX500 – Overview | Bearish Pressure Below 6,578
U.S. stock futures fell nearly 2% as regional banking concerns resurfaced following disappointing earnings and early signs of credit stress across smaller U.S. lenders.
The selloff reignited fears about credit quality and dragged global markets lower, while traders now shift focus to upcoming earnings from regional banks and American Express for further clues on financial stability.
🕯 Technical Outlook
SPX500 maintains bearish momentum while trading below 6,578, targeting 6,550 → 6,527 → 6,506.
A 1H close above 6,578 would shift sentiment bullish, opening the path toward 6,609 → 6,635 → 6,670.
Pivot: 6,578
Support: 6,550 – 6,527 – 6,506
Resistance: 6,609 – 6,635 – 6,670

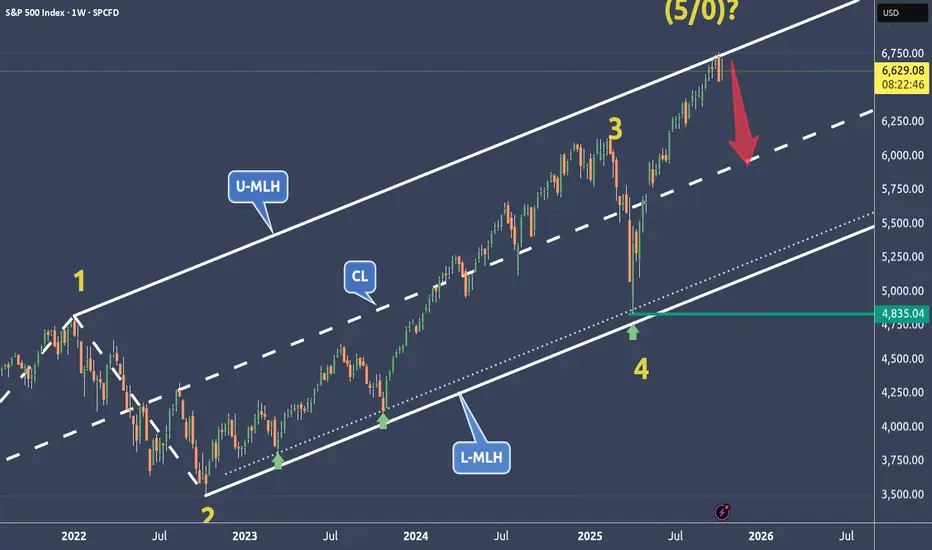
SPX is weakening at a very dangerous price level🔱 SPX is at a very dangerous price level ⚠️
...right at the Upper Median Line Parallel.
💰 If this market turns, the Centerline becomes the next target.
The 0-5 Count is also a good indication when prices start to turn at these extreme levels.
⚠️ Stay sharp — momentum is fading.
I wish you all a relaxing weekend.
BUY SPX - S&P500- Amazing low risk high reward trade!Based on our deep analysis we can see that SPX - S&P500 will head to the upside. Great time to buy - it has broken major resistance levels + trends.

SPX 500 extends recovery as traders watch US-China situationAfter breaking above 6677 yesterday, the S&P 500 created a higher high on the intraday charts, and so today's gains were a continuation of that move. But the index has now arrived into the next potential resistance area between 6720-6740, which was a key short-term support zone before the breakdown we saw on Friday. Could we see some volatility around this zone now?
Risk appetite returned overnight, with US index futures climbing to new weekly highs, even though European markets showed a more mixed performance. In currencies, the US dollar index retreated against most major peers, surrendering part of its recent gains. Market sentiment this week reflects a cautious blend of optimism and restraint. Expectations for Federal Reserve rate cuts remain the key driver, underpinning risk appetite even as gold extends its record-breaking rally beyond $4,200.
Investors appear largely unfazed by renewed US–China trade tensions, brushing off President Trump’s latest warning on cooking oil imports. Meanwhile, solid US bank earnings have bolstered confidence in corporate resilience, keeping equities supported despite the ongoing US government shutdown. Adding to the upbeat tone this morning, French political tensions eased after Prime Minister Sébastien Lecornu announced a delay to his contentious pension reform plan.
But with the US-China tensions back at the forefront, could investors start taking profits on their long equity trades to cause a bit of selling pressure now?
by Fawad Razaqzada, market analyst with FOREX.com
