S&P500 fresh all time highUS equities regained momentum yesterday, with the S&P 500 up 0.58% to a fresh all-time high as investors shrugged off political uncertainty and the ongoing government shutdown. The broader risk-on tone was supported by strong global sentiment, easing bond yields, and renewed optimism across multiple asset classes.
Key drivers:
Political backdrop: Despite the US shutdown and political noise in France, markets focused on stability signals — notably President Macron’s decision to delay a snap election by pledging a new prime minister.
Global rally: Equities, bonds, oil, and gold all moved higher, reflecting a broad-based risk appetite. Gold hit a record $4,042/oz, suggesting some defensive hedging alongside equity strength.
AI momentum: The AI investment boom continued to fuel tech optimism, with Nvidia-backed startup N8n raising $180m at a $2.5bn valuation, underscoring ongoing enthusiasm around AI-linked growth.
Macro & policy: Investors largely looked past Washington gridlock, though air traffic disruptions and debate over furloughed workers’ pay added to the shutdown narrative.
Market tone:
Sentiment remains constructive for the S&P 500, with investors betting on resilient corporate earnings and continued AI-driven growth. However, elevated valuations and political uncertainty may temper further near-term upside.
Key Support and Resistance Levels
Resistance Level 1: 6768
Resistance Level 2: 7800
Resistance Level 3: 6820
Support Level 1: 6695
Support Level 2: 6672
Support Level 3: 6642
This communication is for informational purposes only and should not be viewed as any form of recommendation as to a particular course of action or as investment advice. It is not intended as an offer or solicitation for the purchase or sale of any financial instrument or as an official confirmation of any transaction. Opinions, estimates and assumptions expressed herein are made as of the date of this communication and are subject to change without notice. This communication has been prepared based upon information, including market prices, data and other information, believed to be reliable; however, Trade Nation does not warrant its completeness or accuracy. All market prices and market data contained in or attached to this communication are indicative and subject to change without notice.
Trade ideas

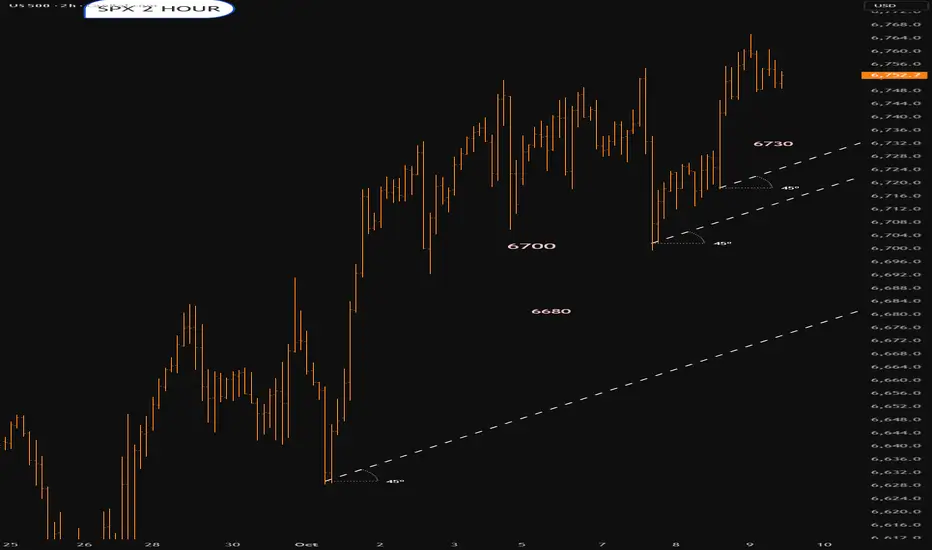
SPX.Poss first signs of trouble6700 pivot area.If that breaks and then becomes resistance on the bounce.Possible bear trap there first
SPX500 Tests Highs as AI and Rate-Cut Hopes Support RallySPX500 – Technical Overview
The S&P 500 continues to trade near record highs as AI strength and renewed rate-cut optimism offset lingering concerns from the U.S. government shutdown.
Markets remain supported by expectations of further Fed easing, though volatility may persist around key resistance zones.
Technical Outlook
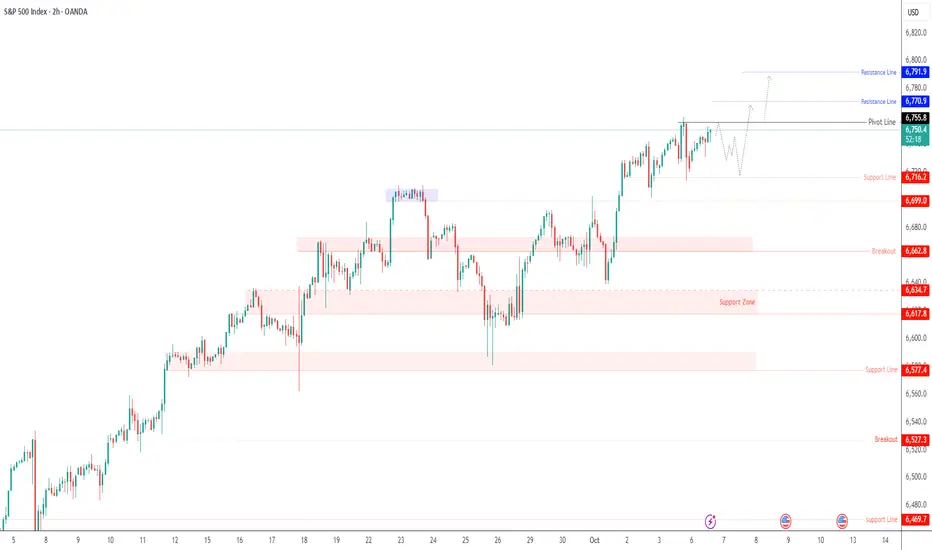
The index is testing the previous week’s highs around 6,755–6,727.
A 1H close below 6,727 would confirm a short-term bearish correction toward 6,699 → 6,662.
Conversely, a 1H close above 6,755 would reinforce bullish momentum and open the way toward 6,770 → 6,791 → 6,820.
Pivot: 6,755
Resistance: 6,770 – 6,791 – 6,820
Support: 6,727 – 6,716 – 6,699 – 6,662
SPX...Ya might want to tighten stopsLets see if that trend can continue.?
Looks overstretched.That does not mean it will get sold

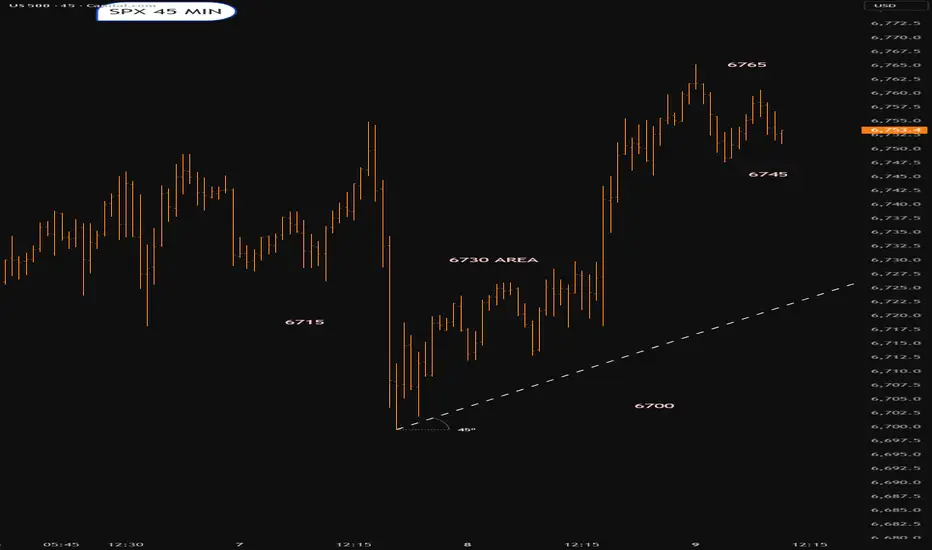
SPX into the open/ Thursday 9th OctoberWe could pop 6765 or we might even retrace to 6700-6715
Lets see what happens
S&P 500 - Should I be getting in right now?Price continues higher, holding above both the 60-day and 250-day EMAs, but momentum is fading:
RSI + MACD divergence
Open interest down by 500k (CFTC report) - w/c 23rd September.
Shorts likely getting squeezed = price up, participation down.
Elliott Wave count suggests we're in the 5th wave of the 3rd impulse — still bullish, but a Wave 4 correction could be next.
📍 Key level to watch: 5,481 (re-entry into Wave 1 territory = count invalidation)

American Financial Pulse: U.S. Markets Shape the Global Economy1. The Rise of U.S. Financial Dominance
After World War II, the world needed stability — and the United States provided it. The Bretton Woods Agreement (1944) established the U.S. dollar as the central pillar of the international monetary system. With the world’s gold reserves concentrated in America, other countries pegged their currencies to the dollar.
Even after the gold standard ended in 1971, the dollar’s dominance remained intact. U.S. financial markets grew deeper, more liquid, and more sophisticated than any other. Investors from around the world began to see U.S. Treasury securities as the safest asset, and corporations preferred raising funds through American capital markets.
By the 21st century, Wall Street had become the nerve center of global finance, home to some of the largest and most influential institutions — Goldman Sachs, JPMorgan Chase, Morgan Stanley, Citigroup, and others.
2. Wall Street: The Barometer of Global Sentiment
When the New York Stock Exchange (NYSE) or NASDAQ moves, the world pays attention. Wall Street’s performance often sets the tone for markets across Asia and Europe.
Bullish sentiment in the U.S. can lift markets worldwide, signaling economic optimism and boosting commodity prices.
Bearish or volatile trends, on the other hand, can spark global risk aversion, leading to sell-offs in emerging markets.
For instance:
The 2008 Global Financial Crisis, which started with the collapse of U.S. housing markets, triggered the worst worldwide recession since the Great Depression.
The tech boom of the 2010s, driven by Silicon Valley giants like Apple, Microsoft, and Amazon, created wealth and innovation ecosystems that influenced startups and stock markets globally.
In short, Wall Street isn’t just America’s financial hub — it’s the world’s emotional pulse of risk and reward.
3. The U.S. Dollar: The Global Reserve Currency
The U.S. dollar is the king of currencies — a symbol of trust, strength, and stability. Around 60% of global foreign exchange reserves are held in dollars, and most international trade and commodities (like oil and gold) are priced in USD.
This dominance gives the U.S. a unique “exorbitant privilege” — the ability to borrow cheaply, attract global capital, and wield financial sanctions effectively.
When the Federal Reserve raises or cuts interest rates, it doesn’t just affect the U.S. — it reshapes capital flows globally. A stronger dollar often leads to:
Capital outflows from emerging markets,
Currency depreciation in developing economies, and
Higher import costs for countries that rely on dollar-denominated trade.
Conversely, a weaker dollar can boost global liquidity and commodity prices, supporting international growth.
4. The Federal Reserve: The World’s Central Bank
The Federal Reserve (Fed) is not just America’s central bank — it’s the de facto central bank of the world.
Its policies on interest rates, inflation control, and money supply influence nearly every financial market globally. When the Fed tightens or loosens monetary policy, it sets off a chain reaction:
Bond yields shift across continents.
Exchange rates fluctuate.
Stock markets either rally or crash.
Take 2022–2023, for example: the Fed’s aggressive rate hikes to fight inflation caused global investors to flock to the dollar, leading to currency depreciation in Europe, India, and Japan. Developing nations faced capital outflows and rising borrowing costs, proving once again how America’s monetary policy reverberates worldwide.
5. U.S. Tech Giants and Their Global Economic Influence
Beyond monetary policy, corporate America also drives global trends. Tech companies such as Apple, Microsoft, Amazon, Google, Meta, and Tesla not only dominate U.S. indices like the NASDAQ but also shape global consumer behavior, innovation cycles, and investment trends.
Their market capitalization exceeds the GDP of many countries.
Global funds benchmark their performance against these companies.
Even non-U.S. economies depend on their supply chains and technologies.
For instance, Apple’s supply chain decisions in China or India influence local employment, manufacturing, and even government policy. Similarly, Tesla’s electric revolution has pushed automakers worldwide to accelerate their shift toward EVs.
These corporations make the American economy a key driver of global innovation and productivity.
6. The U.S. Bond Market: The Global Safe Haven
The U.S. Treasury market, valued at over $27 trillion, is the most liquid and trusted debt market in the world.
In times of global uncertainty — wars, pandemics, recessions — investors rush to buy U.S. bonds, driving up their prices and lowering yields. This phenomenon is known as a “flight to safety.”
For example:
During the COVID-19 pandemic, despite global chaos, demand for U.S. bonds surged.
Even amid geopolitical tensions like the Russia-Ukraine conflict, U.S. Treasuries remained the go-to safe asset.
This trust reinforces the U.S. government’s financial supremacy, allowing it to borrow at low rates and sustain high fiscal spending without immediate repercussions.
7. American Trade and Global Supply Chains
America’s financial strength isn’t just about Wall Street — it’s also about trade and consumer power. The U.S. is one of the largest importers and consumers in the world.
When American demand rises, exporters from China, India, Germany, and others benefit. When it slows, global trade suffers.
For instance:
The 2020–21 pandemic recovery in the U.S. boosted demand for goods, lifting export economies.
But slowing U.S. consumer spending in 2023–24 led to reduced factory orders worldwide.
Thus, the American consumer acts as the ultimate engine of global trade — their spending decisions echo through factories, ports, and currencies around the world.
8. U.S. Sanctions and Financial Power as a Tool of Diplomacy
One of the most significant, yet often overlooked, aspects of America’s financial influence is its ability to use economic sanctions as a form of global control.
Because the U.S. dollar dominates international transactions, most global banks and businesses rely on access to U.S. financial systems like SWIFT. When the U.S. imposes sanctions on countries like Iran, Russia, or Venezuela, it effectively isolates them from global finance.
This demonstrates the geo-financial power of America — the ability to influence political outcomes through control of money flow, rather than military force.
9. U.S. Market Crises and Global Shockwaves
History shows that financial turbulence in America often triggers worldwide crises:
1929: The Wall Street crash led to the Great Depression, spreading poverty and unemployment globally.
1987: Black Monday caused global stock market collapses within hours.
2008: The subprime mortgage meltdown triggered a global recession.
2020: The COVID-induced crash saw trillions wiped out globally within weeks.
Each time, recovery depended heavily on U.S. fiscal stimulus and Federal Reserve actions — highlighting both the risks and the resilience of America’s central role.
10. America’s Role in Emerging Market Dynamics
Emerging economies — such as India, Brazil, South Africa, and Indonesia — often experience boom-bust cycles tied to U.S. financial trends.
When U.S. interest rates are low, investors chase higher returns in emerging markets, driving asset prices up. But when the Fed tightens policy, capital retreats to the U.S., leaving these economies vulnerable to currency depreciation and inflation.
This cyclical dependency shows how America’s financial health acts as both an opportunity and a threat for developing nations.
11. The Future: Can the World De-Americanize Finance?
In recent years, there’s been growing talk of “de-dollarization” — the effort by countries like China, Russia, and members of BRICS to reduce dependence on the U.S. dollar.
While alternative payment systems and local-currency trade agreements are emerging, the U.S. still holds structural advantages:
Deep and transparent financial markets,
Strong legal systems,
Global investor trust, and
A culture of innovation.
Even as digital currencies and blockchain-based settlements evolve, the U.S. remains a central force in shaping the future of finance — through regulation, technological leadership, and institutional power.
12. Conclusion: The Unshakable Financial Pillar
America’s financial influence over the global market is a blend of trust, size, innovation, and history. Its currency drives trade, its markets dictate sentiment, and its policies shape growth trajectories worldwide.
From Wall Street traders to policymakers in Asia, from African commodity exporters to European bankers — all keep an eye on what happens in the United States.
While global diversification and regional powers continue to grow, the American financial system remains the spine of international economics. Its rhythm — whether fast or slow — continues to set the pace for the global financial symphony.

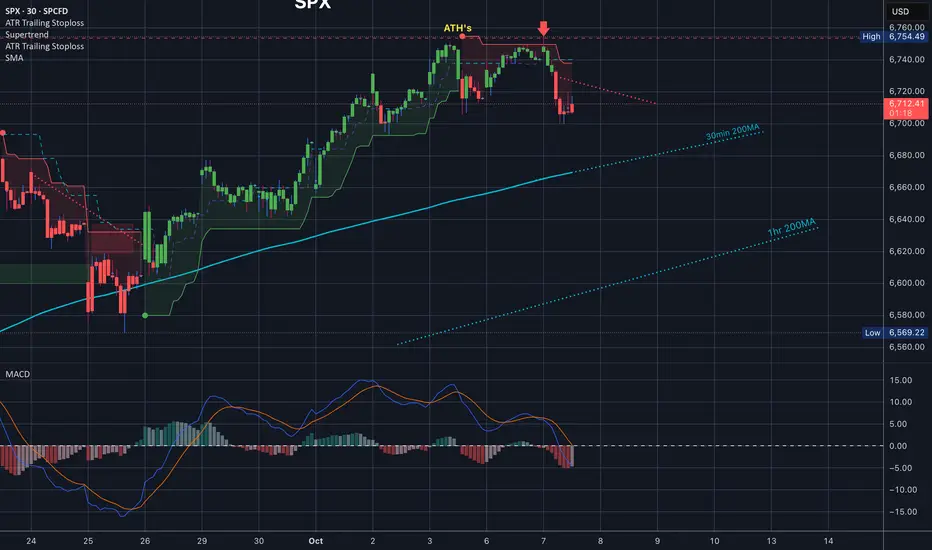
$SPX $ES_F SUPERTREND is an indicator you should learnSP:SPX $ES_F SUPERTREND is definitely an indicator you should learn how to use.
What's funny is it doesn't act the way you likely originally think it works, so learning to read it well can give you a huge edge. Look at where we got smacked down today, right at supertrend. We got the signal Friday, moved up to it yesterday, tested it today and got smacked down.
So beautiful!! So if you have Super trend and the 35EMA you have everything you need. For ES Traders you should be checking these levels on Regular Trading hours not Electronic, once in a while.
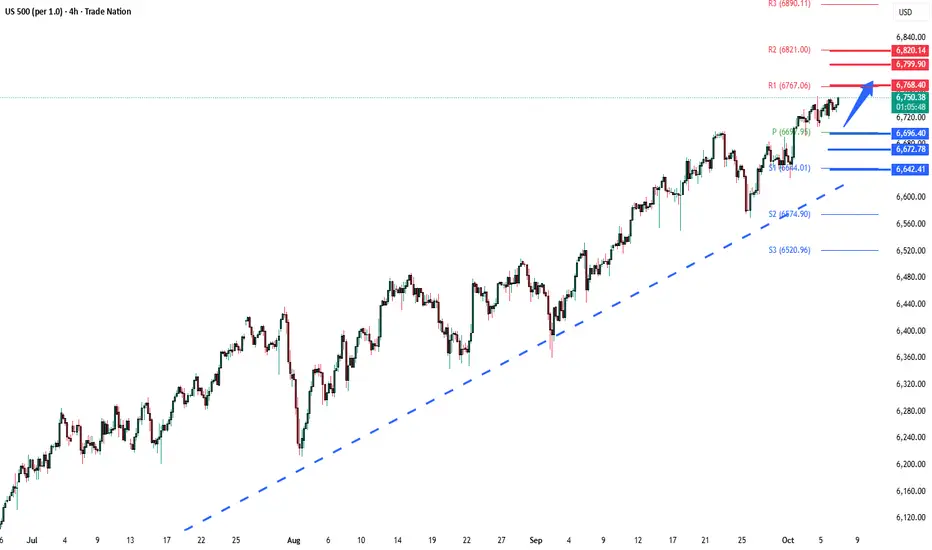
S&P500 Uptrend continuation supported at 6696 The S&P 500 (+0.36%) climbed to another record high, showing resilience despite political uncertainty in Europe and the ongoing US government shutdown. Gains were driven largely by a massive 23.7% surge in AMD after news that OpenAI will purchase tens of billions of dollars’ worth of its chips, making AMD the standout performer in the index.
Even though over half of S&P 500 constituents declined, tech strength — led by AMD and NASDAQ’s 0.71% advance — lifted the broader market. After the close, news of the US government taking a 10% stake in Canada’s Trilogy Metals (up 215% in after-hours) reinforced investor focus on critical minerals.
Gold eased slightly from the $4,000 mark but remains strong amid global uncertainty, while Tesla’s upcoming launch of a cheaper Model Y could influence sector sentiment. Overall, tech leadership continues to support the S&P 500’s momentum despite mixed breadth and macro headwinds.
Key Support and Resistance Levels
Resistance Level 1: 6768
Resistance Level 2: 6800
Resistance Level 3: 6820
Support Level 1: 6696
Support Level 2: 6670
Support Level 3: 6640
This communication is for informational purposes only and should not be viewed as any form of recommendation as to a particular course of action or as investment advice. It is not intended as an offer or solicitation for the purchase or sale of any financial instrument or as an official confirmation of any transaction. Opinions, estimates and assumptions expressed herein are made as of the date of this communication and are subject to change without notice. This communication has been prepared based upon information, including market prices, data and other information, believed to be reliable; however, Trade Nation does not warrant its completeness or accuracy. All market prices and market data contained in or attached to this communication are indicative and subject to change without notice.
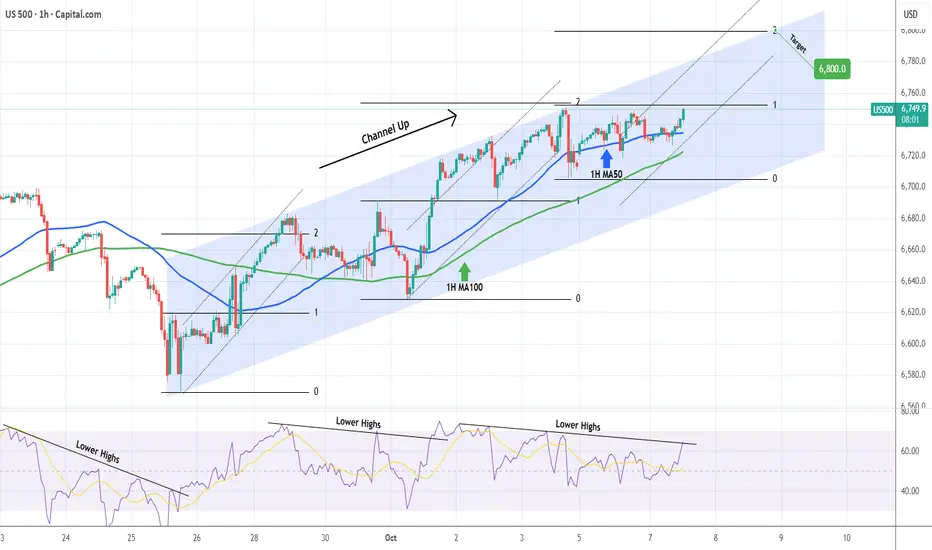
S&P500 Found the Support it needed for 6800.The S&P500 index (SPX) gave us an excellent bottom buy signal last week (September 30, see chart below), rebounding straight after and quickly hitting our 6720 Target:
This time we focus on a much shorter term Channel Up pattern that has emerged, which has just given us another buy signal as it is currently bouncing on its 1H MA50 (blue trend-line).
As long as the 1H MA100 (green trend-line) holds and the 1H RSI breaks above its Lower Highs trend-line, we expect the index to seek a new Higher High on the 2.0 Fibonacci extension at 6800.
-------------------------------------------------------------------------------
** Please LIKE 👍, FOLLOW ✅, SHARE 🙌 and COMMENT ✍ if you enjoy this idea! Also share your ideas and charts in the comments section below! This is best way to keep it relevant, support us, keep the content here free and allow the idea to reach as many people as possible. **
-------------------------------------------------------------------------------
💸💸💸💸💸💸
👇 👇 👇 👇 👇 👇

The Role of Developed and Emerging Markets in the World Bank’s Introduction: A Tale of Two Worlds in One Financial Institution
The World Bank stands as one of the most influential international financial institutions in the modern era — a cornerstone of global economic stability and development. Since its establishment in 1944 at the Bretton Woods Conference, the World Bank has evolved from a post-war reconstruction lender to a powerhouse for global poverty reduction, infrastructure development, and economic reform.
At its heart, the World Bank is not merely a bank — it is a bridge between developed and emerging markets. Developed nations bring capital, expertise, and governance, while emerging economies bring growth, opportunities, and development challenges. Together, these two groups form the backbone of the institution’s structure, mission, and functioning.
This intricate partnership shapes the global economy, influences international policy, and determines the future of sustainable development. Understanding their respective roles within the World Bank reveals how global economic cooperation works — and sometimes, where it struggles.
1. The World Bank: Structure and Objectives
The World Bank Group (WBG) consists of five institutions:
International Bank for Reconstruction and Development (IBRD) – lends to middle-income and creditworthy low-income countries.
International Development Association (IDA) – provides concessional loans and grants to the poorest nations.
International Finance Corporation (IFC) – focuses on private sector development.
Multilateral Investment Guarantee Agency (MIGA) – offers political risk insurance and credit enhancement.
International Centre for Settlement of Investment Disputes (ICSID) – handles investment disputes between governments and foreign investors.
Together, they aim to reduce poverty, promote sustainable development, and enhance living standards across the world. But the direction of these goals and their implementation depend largely on the interplay between developed and emerging markets within the institution.
2. Developed Markets: The Pillars of Financial Strength
Developed economies — primarily the United States, Japan, Germany, France, and the United Kingdom — are the largest shareholders and financial contributors to the World Bank. Their roles are multifaceted and deeply rooted in both economic capacity and geopolitical influence.
A. Capital Contribution and Voting Power
The World Bank operates on a shareholding system where financial contributions determine voting power. Developed countries hold the majority of votes — for example, the U.S. alone has around 16–17% of voting rights, giving it significant influence over key decisions.
This capital infusion ensures the World Bank’s ability to provide loans at favorable rates to developing nations, maintain creditworthiness, and attract investors from international capital markets.
B. Policy Influence and Governance
Developed nations also shape the strategic priorities of the World Bank. They influence policy directions on:
Climate change initiatives
Good governance and anti-corruption frameworks
Debt sustainability
Gender equality and education programs
However, critics argue that this dominance can sometimes lead to policies that reflect the interests or economic ideologies of the developed world — particularly the neoliberal approach of privatization and deregulation.
C. Technical Expertise and Innovation
Developed economies contribute advanced research, technology, and institutional know-how to World Bank projects. For instance:
The U.S. contributes technological expertise in energy transition and innovation financing.
European countries drive climate adaptation, green infrastructure, and human rights frameworks.
Japan often supports disaster resilience and urban infrastructure development.
This infusion of expertise helps ensure that World Bank-funded projects are not only financially viable but also sustainable and modern in design.
3. Emerging Markets: The Engines of Growth and Development
Emerging economies — such as India, China, Brazil, Indonesia, and South Africa — play an equally vital yet distinct role within the World Bank. Once the primary recipients of development aid, many have now evolved into both borrowers and contributors.
A. Borrowers and Beneficiaries
Historically, emerging markets have been the primary recipients of World Bank loans and grants aimed at:
Building infrastructure (roads, dams, energy grids)
Expanding access to education and healthcare
Promoting agricultural and rural development
Strengthening governance and public institutions
For example:
India has been one of the largest recipients of World Bank loans, supporting rural electrification, sanitation, and digital finance initiatives.
China, before transitioning to an upper-middle-income economy, utilized World Bank funds to modernize infrastructure and improve poverty reduction programs.
These investments have had a profound multiplier effect — accelerating economic growth, improving living standards, and positioning these countries as regional powerhouses.
B. Emerging Donors and Shareholders
In recent years, several emerging economies have transitioned from aid recipients to development partners.
China has become a major shareholder and now contributes to World Bank financing pools.
India and Brazil participate in knowledge-sharing programs and South-South cooperation.
This evolution symbolizes a more balanced and inclusive global development model, where emerging economies not only receive aid but also help shape and fund development efforts in poorer nations.
C. Field Implementation and Local Innovation
Emerging markets also serve as testing grounds for innovative development models. Their on-ground experiences in poverty alleviation, microfinance, digital inclusion, and renewable energy provide blueprints for other developing nations.
For example:
India’s Aadhaar digital identity program inspired similar digital inclusion models across Africa.
Brazil’s Bolsa Família program influenced social welfare strategies in multiple countries.
Thus, emerging economies bring the voice of practicality, representing real-world development challenges and scalable solutions.
4. Collaboration Between Developed and Emerging Markets
The partnership between developed and emerging markets within the World Bank framework is both strategic and symbiotic.
A. Funding and Execution
Developed nations provide capital and governance, while emerging markets provide execution capacity and local insight.
This balance ensures that funds reach where they’re needed most and are used effectively for on-ground transformation.
B. Knowledge Transfer
The World Bank acts as a platform for knowledge exchange — developed countries share technical know-how, while emerging economies share policy lessons and innovations that work in resource-constrained environments.
C. Sustainable Development Goals (SDGs)
Both blocs are integral to achieving the United Nations’ 2030 SDGs. Developed nations finance and design global frameworks, while emerging markets implement and test these goals in diverse contexts — from renewable energy transitions to healthcare reforms.
5. Challenges in the Relationship
Despite mutual benefits, the relationship between developed and emerging markets in the World Bank is not without friction.
A. Governance Imbalance
Developing and emerging economies have long called for greater voting representation. Although reforms have been introduced, developed countries still dominate decision-making — limiting the voice of fast-growing economies like India or Brazil.
B. Policy Conditionalities
Many emerging nations criticize the World Bank’s loan conditions, which often require structural reforms like privatization or fiscal tightening. These can conflict with domestic socio-economic priorities and sometimes exacerbate inequality.
C. Geopolitical Tensions
The rise of China and the creation of the Asian Infrastructure Investment Bank (AIIB) has challenged the World Bank’s dominance, signaling emerging economies’ desire for alternative frameworks that better represent their interests.
D. Climate Finance Divide
Developed countries advocate for rapid green transitions, but emerging markets argue they need more time and support, as their economic growth still relies on energy-intensive sectors. Balancing development and decarbonization remains a key tension point.
6. The Evolving Role of Emerging Markets in the 21st Century
Emerging economies are no longer passive participants — they are increasingly shaping the World Bank’s agenda.
India champions digital public infrastructure and inclusive finance.
China promotes infrastructure-led growth and south-south cooperation.
Brazil emphasizes social protection and sustainable agriculture.
These nations push for a development model that blends economic growth with social inclusion, moving beyond the purely economic paradigms of the past.
Furthermore, as emerging markets contribute more financially and intellectually, the World Bank’s governance structure is slowly evolving toward greater inclusivity.
7. The Road Ahead: Toward a Balanced Global Partnership
For the World Bank to remain relevant in an increasingly multipolar world, it must strengthen the partnership between developed and emerging markets.
Key future directions include:
Reforming voting rights to reflect modern economic realities.
Enhancing transparency and accountability in project selection and implementation.
Promoting green finance and climate-resilient infrastructure, especially in the Global South.
Expanding digital transformation programs, leveraging emerging market innovation.
Encouraging co-financing and joint initiatives between developed and emerging nations.
The ideal future for the World Bank is not dominated by one group over another — but one where mutual respect, shared responsibility, and equitable participation drive global development.
8. Conclusion: A Shared Mission for Global Prosperity
The World Bank’s success depends on how effectively it balances the strengths of both developed and emerging markets. Developed countries provide stability, financial capacity, and institutional frameworks, while emerging economies bring energy, growth potential, and real-world experience.
Together, they represent the two engines of global progress — one supplying resources, the other driving innovation and execution.
As the 21st century unfolds, the collaboration between these two worlds within the World Bank will determine not only the institution’s future but also the fate of global development itself. The mission is clear: to bridge divides, foster inclusivity, and ensure that prosperity is not the privilege of a few nations — but the shared heritage of all.
SP500 7400!!!We are at a time when stocks and risk assets are on the rise, we have a target not far from the SP 500 at around 7400
This is in an important resistance zone where it can have a pullback to break through or make a single leg in search of Bullran's macro target.
If it does a Pullback retest, we have a good zone of interest below to enter. This week we will have Payroll and it can dictate the pace of some assets. Let's keep an eye on these scenarios.

Applovin Craters...Is Robinhood next? APP fell sharply intraday today after announcement came late into the session about an SEC probe into the company.
The SEC loves to do this with new S&P500 stocks.
Applovin was one of the strongest stocks in the market recently and its finally been knocked back down to earth.
You have to wonder if HOOD will be the next SEC probe.
Robinhoods controversial NFL prediction markets could a big controversy.

Inflation 2022 trendline now is the keyAs you can see this trendline is acting as a major resistance. Once Spx break it out it is highly probable that that trendline turns into a support.
Spx will test is and if it holds we can see 7000/7050 pips by the end of November 2025. That is a 4% gain.
I would like to highligh that because the liquidity in the system is so high is very probable to see this happen... and yes... this is only the beginning because then at 7000 pips there is a Fib ring which could provide us the real progression of the Sp500

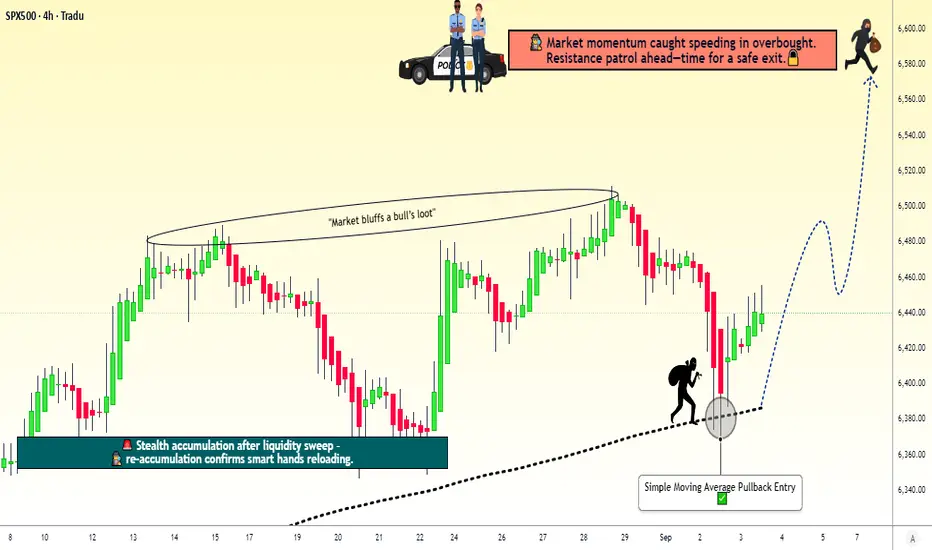
$SPX500 Swing Trade: Bullish SMA Setup!📈 S&P 500 CFD: Thief’s Bullish Pullback Plan 🤑💰
🚨 Swing/Day Trade Setup: S&P 500 Index CFDSteal profits with this 200 SMA Pullback Plan using the "Thief" layered entry strategy! 📊💸 Below is a detailed breakdown combining technicals, fundamentals, and market sentiment to help you navigate this bullish opportunity. Let’s dive in! 🐂
🎯 Trading Plan Overview
Asset: S&P 500 Index CFD ( FOREXCOM:SPX500 )
Bias: Bullish 🐂
Strategy: Pullback to 200 SMA with layered "Thief" limit orders for entries
Why This Plan?
Technicals: The S&P 500 is riding record highs with strong momentum, supported by the 200 SMA as a dynamic support level.
Fundamentals: Cooling inflation (PPI -0.1% vs. +0.3% expected), 100% Fed rate cut probability, and robust corporate earnings (+10% in 2025, +13% in 2026) fuel bullish sentiment.
Sentiment: Neutral Fear & Greed Index (51/100) with low volatility (VIX ~15.04) and AI-driven institutional flows (e.g., Oracle +30%).
📊 Thief’s Technical Setup
Entry Strategy:
Use the Thief Layered Entry approach with multiple buy limit orders to catch pullbacks:
🔔 Buy Limit 1: $6,460
🔔 Buy Limit 2: $6,480
🔔 Buy Limit 3: $6,500
🔔 Buy Limit 4: $6,520
💡 Pro Tip: Adjust layer levels based on your risk tolerance and market conditions. You can enter at any price level or add more layers for flexibility!
Entry Trigger: Pullback to the 200 SMA for optimal risk-reward.
Stop Loss (SL):
Suggested "Thief" SL: $6,440 (below key support).
⚠️ Note: Adjust your SL based on your risk management and strategy. Trade at your own risk, dear Traders!
Take Profit (TP):
Target: $6,700 (near resistance, potential overbought zone, or "police barricade" trap).
🚨 Note: Escape with profits before resistance hits! Set your TP based on your goals—don’t blindly follow mine. Take money at your own risk!
📡 Real-Time Market Data (10 Sept 2025, UTC+1)
Daily Change: +37.43 points (+0.57%)
YTD Performance: Record highs driven by AI optimism and Fed rate cut expectations.
😰😊 Fear & Greed Index
Current Sentiment: Neutral (Score: 51/100)
Breakdown:
📈 Market Momentum: Bullish (S&P 500 above 125-day MA).
🌬️ Volatility (VIX): Low (~15.04), signaling calm markets.
🛡️ Safe Haven Demand: Moderate (bonds lagging stocks).
💰 Junk Bond Demand: Slight greed (narrowing yield spreads).
⚖️ Options Activity: Balanced put/call ratio.
🏛️ Macro & Fundamental Analysis
Producer Price Index (PPI): August PPI fell -0.1% (vs. +0.3% expected), easing inflation concerns.
Fed Rate Cut: 100% probability of a 25-50 bps cut in September 2025.
Labor Market: Weaker-than-expected (911K jobs revised down through March 2025).
Corporate Earnings: Strong outlook (+10% growth in 2025, +13% in 2026).
Key Drivers:
🚀 AI investment surge (e.g., Oracle +30%, Nvidia strength).
🌍 Geopolitical risks (Poland-Russia tensions, Middle East concerns).
📉 Trade policy uncertainties (Trump tariff threats).
🐂🐻 Sentiment Analysis
Institutional Outlook: Cautiously optimistic
🏦 Deutsche Bank & Wells Fargo: S&P 500 targets at 7,000+ by 2026.
💡 Focus: AI capex and earnings resilience.
Retail Trader Mood: Mixed but leaning bullish
📈 Meme stock activity (e.g., GameStop +10%).
₿ Crypto correlation (Bitcoin at $111.9K, Solana at 7-month highs).
⚡ Why This Plan Stands Out
Technical Edge: The 200 SMA pullback is a proven strategy for swing/day traders, offering high-probability entries.
Thief Strategy: Layered limit orders maximize flexibility and reduce risk of missing the move.
Macro Support: Cooling inflation, Fed rate cuts, and AI-driven earnings create a bullish backdrop.
Sentiment Boost: Neutral sentiment with low volatility supports steady upside potential.
Risks to Watch: Geopolitical shocks, overvaluation concerns, and seasonal market weakness.
🔍 Related Pairs to Watch (in USD)
Nasdaq 100 CFD ( NASDAQ:NDX ): Tracks tech-heavy AI stocks driving S&P 500 momentum.
VIX ( TVC:VIX ): Monitor volatility spikes for potential reversals.
US 10-Year Treasury Yield ( TVC:TNX ): Impacts risk sentiment and stock valuations.
FX:USDJPY : Correlates with risk-on/risk-off market moves.
Bitcoin ( BITSTAMP:BTCUSD ): Tracks retail sentiment and risk appetite.
🚨 Key Takeaways
🏆 S&P 500 at record highs, supported by soft PPI and Fed cut expectations.
😎 Neutral sentiment with a greedy tilt if macro data improves.
🤖 AI trade dominates institutional flows, powering bullish momentum.
📅 Watch upcoming CPI data and Fed meeting for next catalysts.
✨ “If you find value in my analysis, a 👍 and 🚀 boost is much appreciated — it helps me share more setups with the community!”
#SPX500 #SwingTrading #DayTrading #ThiefStrategy #Bullish #TechnicalAnalysis #Macro #AI #FedRateCut #TradingIdeas

SPX500 Tapped OutWith #SPX500 being at an all time high and the US government still being shut down I believe SPX500 is showing bearish signals on 2 hr time frame 1 hr time frame. Short advised: TP1 TP2 TP3 before hitting major support @6700

SPX 500 ShortElite analysis
Confirmation have not been met
I am waiting for full confirmations to execute

SPX500 Index – Ready for the Next Pullback Heist Move?🚨 SPX500 / US500 Index – The Money Heist Swing Plan 🎭💰
📊 Plan Overview
Bias: Bullish 200-SMA Pullback Plan @ 6380.00
Entry Strategy (Layering Style):
Thief strategy = multiple buy limit orders stacked like layers 🎯
6400.00 ✅
6410.00 ✅
6420.00 ✅
6440.00 ✅
(You can increase or adjust the layering based on your own style and risk tolerance.)
🛡️ Stop Loss (Thief SL)
SL: 6360.00 ⚠️
Dear Ladies & Gentlemen (Thief OG’s), adjust your SL to fit your risk style. This is just the plan’s guardrail.
🎯 Target / Exit
Target Zone: 6580.00 🚀
Note: This is the “Police Resistance” 🛑 – an overbought + trap zone. Escape with the stolen money 🎭💰 before getting caught.
Reminder: Not financial advice. You decide where to take profits.
🤔 Why This Plan?
🔹 200 SMA Pullback Logic: Price retraced into moving average = classic thief-style entry.
🔹 Layering Strategy Advantage: Building positions gradually improves average entry price & reduces risk.
🔹 Momentum & Sentiment: Neutral Fear & Greed Index (53/100) 😐 and low volatility (VIX 16.9) = stable environment for pullback entries.
🔹 Market Strength: US500 is up +16.81% YTD 🚀 with strong sector support (Alphabet +8.57%, Macy’s +19%).
🔹 Risk Factor: Economic data shows weakness (job openings & factory orders ↓), but bulls remain in control = reason for cautious layering.
🔹 Overall Outlook: Bullish score 65/100 ✅ → Mildly bullish bias fits perfectly with a buy-the-dip pullback strategy.
🔹 Trap Zone Awareness: Plan exits near resistance at 6580.00 to avoid overbought trap — thieves always escape before alarms go off 🚨.
📊 US500 INDEX CFD Real-Time Data (September 03)
Daily Change: +0.51% ↗️
Monthly Performance: +1.87% ↗️
Yearly Performance: +16.81% 🚀
All-Time High: 6,510.93 (August 2025)
😰😊 Investor Sentiment: Fear & Greed Index
Current Reading: 53/100 (Neutral) 😐
Trend: Balanced sentiment with no extreme fear or greed.
Key Indicators:
Market Momentum: S&P 500 above 125-day moving average (positive momentum) ↗️
Volatility (VIX): Low volatility (16.90), indicating stability 🟢
Options Activity: Put/Call ratio stable (no significant fear)
Junk Bond Demand: Moderate risk appetite
Safe Haven Demand: Bonds underperforming stocks (greed signal)
📈 Fundamental & Macro Score
Market Breadth: Moderate (balanced volume) ⚖️
Economic Data:
Job openings lowest since Sept (weakness) 🔻
Factory orders down -1.3% 🔻
Friday’s jobs report = critical ⚠️
Sector Performance:
Communication services (Alphabet +8.57%) 🟢
Consumer discretionary (Macy’s +19%) 🟢
Energy sector weak (Exxon Mobil -2.08%) 🔻
🐂🐻 Overall Market Outlook
Bullish Score: 65/100 (Mildly Bullish) ✅
Reasons:
Strong yearly gains (+16.81%)
Low volatility & neutral sentiment support stability
Tech & communication sectors leading momentum
Risks:
Weakening job & factory data
High valuations near ATH
💡 Key Takeaways
US500 trending upward with neutral short-term sentiment.
Friday’s jobs report = key catalyst.
Sector rotation in play: tech strong, energy weak.
Balanced fear/greed supports controlled bullish setups.
📌 Related Pairs to Watch
FOREXCOM:SPX500
CAPITALCOM:US500
TVC:DJI
NASDAQ:NDX
TVC:VIX (for risk gauge)
✨ “If you find value in my analysis, a 👍 and 🚀 boost is much appreciated — it helps me share more setups with the community!”
#SPX500 #US500 #IndexTrading #SwingTrade #LayeredEntry #SMAPullback #TradingPlan #StockMarket #SP500 #InvestorSentiment #FearGreed
Volatility ahead for S&P500The S&P500 index is positioned above the upper line of the Bollinger Bands (20) indicator, showing weakening momentum. Market breadth is slowly decreasing, as the tech sector has got under pressure on Friday. That might be a normal sector rotation mechanism within a bullish market, or a precursor of a wider correction.
Anyways, the bullish trend might persist, but upside breakouts might be vulnerable to profit taking and corrections as the upside rally reaches the plateau.
Don't forget - this is just the idea, always do your own research and never forget to manage your risk!

SPX: jobs delayed, but not the optimismThe key development in the U.S. last week was the federal government shutdown on October 1st, triggered by Congress’s failure to pass a funding bill. Markets had only a mild reaction to the news, and continued to be focused on broader economic development. Still, jobs data which were set for a release during the week, were not posted, due to the “shutdown”. Regardless, posted JOLTs Job Openings in august of 7,227M were slightly better from forecasted 7,2M expected by the market, which pushed the market optimism toward the increased expectations that the Fed might cut interest rates again this year. The S&P 500 marked another winning week, with a new all time highest level this year at 6.746.
Tech companies continue to be in focus of market attention. Nvidia and other AI-adjacent firms continued to lead the rally, pushing the S&P 500 to fresh highs. Fair Isaac jumped around 18% after unveiling a plan to let lenders access its credit scores directly, hurting traditional credit bureaus like Equifax and TransUnion. On the opposite side was Palantir, which dropped by around 7,5% following security concerns in the U.S. Army memo.
Investors perceive currently a mixed private-sector jobs data for September, as weak enough to support the Fed's decision to cut interest rates further at their forthcoming meeting as of the end of October. Based on these expectations, the S&P 500 might be further supported for new highs, as per investors sentiment.
US500 my projectionUS 500 possibility to go short.
Disclaimer: Take it on your own risk! No investment advice here.
