SPX 500 ShortElite analysis
Confirmation have not been met
I am waiting for full confirmations to execute
Trade ideas

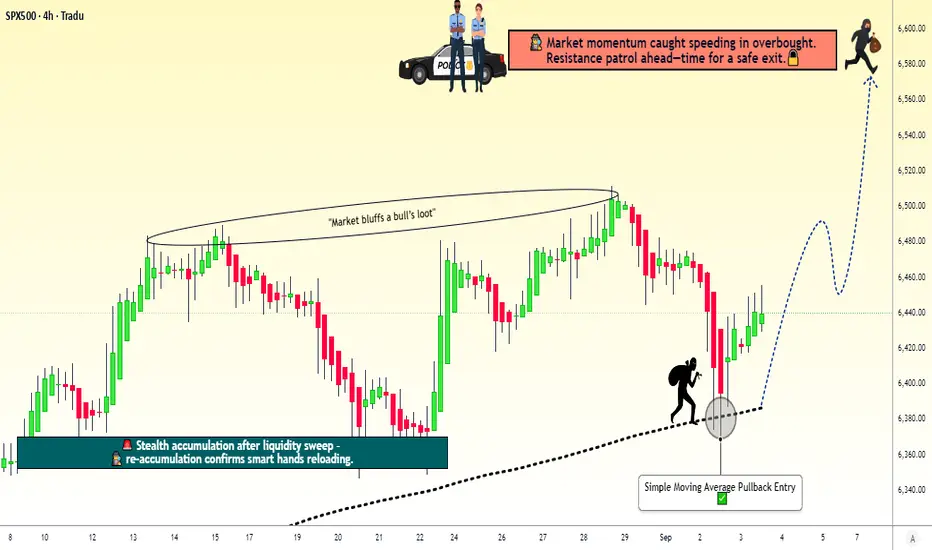
SPX500 Index – Ready for the Next Pullback Heist Move?🚨 SPX500 / US500 Index – The Money Heist Swing Plan 🎭💰
📊 Plan Overview
Bias: Bullish 200-SMA Pullback Plan @ 6380.00
Entry Strategy (Layering Style):
Thief strategy = multiple buy limit orders stacked like layers 🎯
6400.00 ✅
6410.00 ✅
6420.00 ✅
6440.00 ✅
(You can increase or adjust the layering based on your own style and risk tolerance.)
🛡️ Stop Loss (Thief SL)
SL: 6360.00 ⚠️
Dear Ladies & Gentlemen (Thief OG’s), adjust your SL to fit your risk style. This is just the plan’s guardrail.
🎯 Target / Exit
Target Zone: 6580.00 🚀
Note: This is the “Police Resistance” 🛑 – an overbought + trap zone. Escape with the stolen money 🎭💰 before getting caught.
Reminder: Not financial advice. You decide where to take profits.
🤔 Why This Plan?
🔹 200 SMA Pullback Logic: Price retraced into moving average = classic thief-style entry.
🔹 Layering Strategy Advantage: Building positions gradually improves average entry price & reduces risk.
🔹 Momentum & Sentiment: Neutral Fear & Greed Index (53/100) 😐 and low volatility (VIX 16.9) = stable environment for pullback entries.
🔹 Market Strength: US500 is up +16.81% YTD 🚀 with strong sector support (Alphabet +8.57%, Macy’s +19%).
🔹 Risk Factor: Economic data shows weakness (job openings & factory orders ↓), but bulls remain in control = reason for cautious layering.
🔹 Overall Outlook: Bullish score 65/100 ✅ → Mildly bullish bias fits perfectly with a buy-the-dip pullback strategy.
🔹 Trap Zone Awareness: Plan exits near resistance at 6580.00 to avoid overbought trap — thieves always escape before alarms go off 🚨.
📊 US500 INDEX CFD Real-Time Data (September 03)
Daily Change: +0.51% ↗️
Monthly Performance: +1.87% ↗️
Yearly Performance: +16.81% 🚀
All-Time High: 6,510.93 (August 2025)
😰😊 Investor Sentiment: Fear & Greed Index
Current Reading: 53/100 (Neutral) 😐
Trend: Balanced sentiment with no extreme fear or greed.
Key Indicators:
Market Momentum: S&P 500 above 125-day moving average (positive momentum) ↗️
Volatility (VIX): Low volatility (16.90), indicating stability 🟢
Options Activity: Put/Call ratio stable (no significant fear)
Junk Bond Demand: Moderate risk appetite
Safe Haven Demand: Bonds underperforming stocks (greed signal)
📈 Fundamental & Macro Score
Market Breadth: Moderate (balanced volume) ⚖️
Economic Data:
Job openings lowest since Sept (weakness) 🔻
Factory orders down -1.3% 🔻
Friday’s jobs report = critical ⚠️
Sector Performance:
Communication services (Alphabet +8.57%) 🟢
Consumer discretionary (Macy’s +19%) 🟢
Energy sector weak (Exxon Mobil -2.08%) 🔻
🐂🐻 Overall Market Outlook
Bullish Score: 65/100 (Mildly Bullish) ✅
Reasons:
Strong yearly gains (+16.81%)
Low volatility & neutral sentiment support stability
Tech & communication sectors leading momentum
Risks:
Weakening job & factory data
High valuations near ATH
💡 Key Takeaways
US500 trending upward with neutral short-term sentiment.
Friday’s jobs report = key catalyst.
Sector rotation in play: tech strong, energy weak.
Balanced fear/greed supports controlled bullish setups.
📌 Related Pairs to Watch
FOREXCOM:SPX500
CAPITALCOM:US500
TVC:DJI
NASDAQ:NDX
TVC:VIX (for risk gauge)
✨ “If you find value in my analysis, a 👍 and 🚀 boost is much appreciated — it helps me share more setups with the community!”
#SPX500 #US500 #IndexTrading #SwingTrade #LayeredEntry #SMAPullback #TradingPlan #StockMarket #SP500 #InvestorSentiment #FearGreed
Volatility ahead for S&P500The S&P500 index is positioned above the upper line of the Bollinger Bands (20) indicator, showing weakening momentum. Market breadth is slowly decreasing, as the tech sector has got under pressure on Friday. That might be a normal sector rotation mechanism within a bullish market, or a precursor of a wider correction.
Anyways, the bullish trend might persist, but upside breakouts might be vulnerable to profit taking and corrections as the upside rally reaches the plateau.
Don't forget - this is just the idea, always do your own research and never forget to manage your risk!

SPX: jobs delayed, but not the optimismThe key development in the U.S. last week was the federal government shutdown on October 1st, triggered by Congress’s failure to pass a funding bill. Markets had only a mild reaction to the news, and continued to be focused on broader economic development. Still, jobs data which were set for a release during the week, were not posted, due to the “shutdown”. Regardless, posted JOLTs Job Openings in august of 7,227M were slightly better from forecasted 7,2M expected by the market, which pushed the market optimism toward the increased expectations that the Fed might cut interest rates again this year. The S&P 500 marked another winning week, with a new all time highest level this year at 6.746.
Tech companies continue to be in focus of market attention. Nvidia and other AI-adjacent firms continued to lead the rally, pushing the S&P 500 to fresh highs. Fair Isaac jumped around 18% after unveiling a plan to let lenders access its credit scores directly, hurting traditional credit bureaus like Equifax and TransUnion. On the opposite side was Palantir, which dropped by around 7,5% following security concerns in the U.S. Army memo.
Investors perceive currently a mixed private-sector jobs data for September, as weak enough to support the Fed's decision to cut interest rates further at their forthcoming meeting as of the end of October. Based on these expectations, the S&P 500 might be further supported for new highs, as per investors sentiment.
US500 my projectionUS 500 possibility to go short.
Disclaimer: Take it on your own risk! No investment advice here.

SPX - Bearish ScenarioContinuous three point touches along a down trend line can be seen in red
Right now price may experience this third touch on its current down trend in red.
From there I think it collapse may follow down to levels in 02 and 08 or a bit above them. (price could recover at the red line along the timeframe when covid was occurring.)
Not sure when it will occur but its going to.
Weekly timeframe

SPX500 H1 | Bullish Bounce from Key SupportBased on the H1 chart analysis, we could see the price fall to the buy entry, which is 6,732.79, which is a pullback support and oculd bounce from this levle to the upside.
Stop loss is at 6,719.64, which is a pullback support.
Stop loss is at 6,697.83, which is a pullback support that lines up with the 38.2% Fibonacci retracement.
Take profit is at 6,762.34, which aligns with the 127.2% Fibonacci extension and the 100% Fibonacci projection.
High Risk Investment Warning
Trading Forex/CFDs on margin carries a high level of risk and may not be suitable for all investors. Leverage can work against you.
Stratos Markets Limited (tradu.com ):
CFDs are complex instruments and come with a high risk of losing money rapidly due to leverage. 65% of retail investor accounts lose money when trading CFDs with this provider. You should consider whether you understand how CFDs work and whether you can afford to take the high risk of losing your money.
Stratos Europe Ltd (tradu.com ):
CFDs are complex instruments and come with a high risk of losing money rapidly due to leverage. 66% of retail investor accounts lose money when trading CFDs with this provider. You should consider whether you understand how CFDs work and whether you can afford to take the high risk of losing your money.
Stratos Global LLC (tradu.com ):
Losses can exceed deposits.
Please be advised that the information presented on TradingView is provided to Tradu (‘Company’, ‘we’) by a third-party provider (‘TFA Global Pte Ltd’). Please be reminded that you are solely responsible for the trading decisions on your account. There is a very high degree of risk involved in trading. Any information and/or content is intended entirely for research, educational and informational purposes only and does not constitute investment or consultation advice or investment strategy. The information is not tailored to the investment needs of any specific person and therefore does not involve a consideration of any of the investment objectives, financial situation or needs of any viewer that may receive it. Kindly also note that past performance is not a reliable indicator of future results. Actual results may differ materially from those anticipated in forward-looking or past performance statements. We assume no liability as to the accuracy or completeness of any of the information and/or content provided herein and the Company cannot be held responsible for any omission, mistake nor for any loss or damage including without limitation to any loss of profit which may arise from reliance on any information supplied by TFA Global Pte Ltd.
The speaker(s) is neither an employee, agent nor representative of Tradu and is therefore acting independently. The opinions given are their own, constitute general market commentary, and do not constitute the opinion or advice of Tradu or any form of personal or investment advice. Tradu neither endorses nor guarantees offerings of third-party speakers, nor is Tradu responsible for the content, veracity or opinions of third-party speakers, presenters or participants.

Will the AI frenzy drive US indices to new record highs again?
Despite the US government shutdown risk and elevated valuation concerns, US equities continued their upward rally, driven primarily by strength in AI-related stocks.
OpenAI’s valuation has surged to USD 500 billion, a sharp jump from the USD 300 billion valuation in an earlier SoftBank-led funding round earlier this year. This makes OpenAI the most valuable startup in the world, surpassing SpaceX.
Citigroup (C) raised its forecast for global AI spending, projecting USD 490 billion by 2026 (up from USD 420 billion) and cumulative hyperscaler investments by Amazon (AMZN), Microsoft (MSFT), and others to reach USD 2.8 trillion by 2029, up from the previous USD 2.3 trillion estimate.
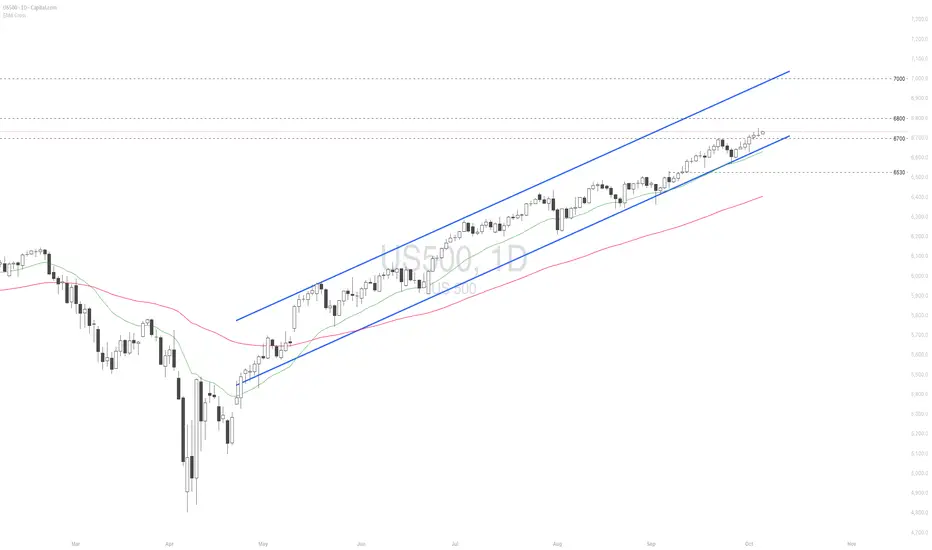
US500 extended its rally to a new record high, maintaining a solid uptrend within the ascending channel. The diverging bullish EMAs point to the potential continuation of bullish momentum. If US500 breaches above the psychological resistance at 6800, the index may gain upward momentum toward the next psychological resistance at 7000. Conversely, if US500 breaks below the support at 6700, the index could retreat toward 6530.
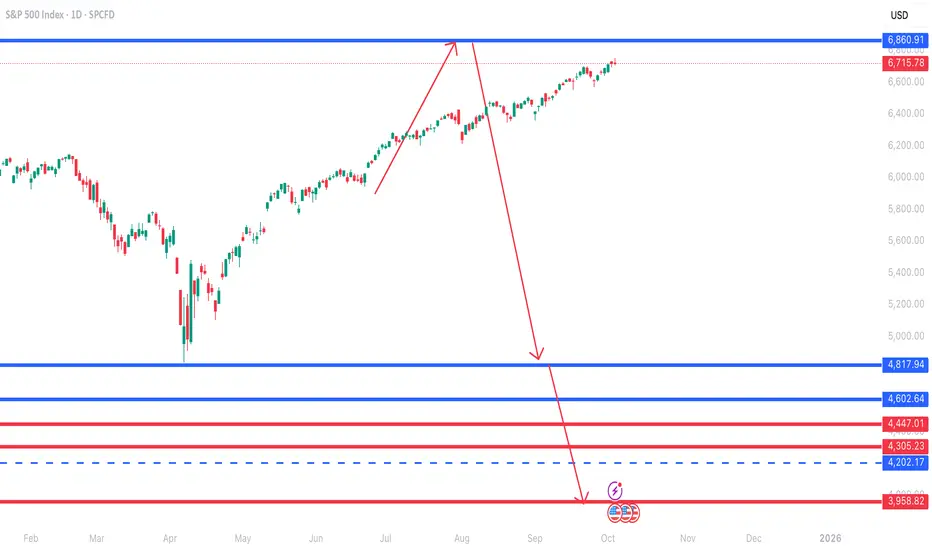
SPX to 6,860$ before bears take full charge of market!and then down to 4,817$ we go.....
The new ATH stated in the title should be met this week after waiting for weeks and months for this after projecting it.
I am a man of few words.....
SPX × US10Y: A Signal for Market Tops and Economic Shifts1. Combining Equity Levels and Yield Sensitivity
SPX (S&P 500) reflects equity market strength and investor sentiment. When SPX is rising, it typically indicates optimism or strong earnings growth expectations.
US10Y (10-year Treasury yield) reflects the cost of capital and inflation expectations. Rising yields can signify tightening financial conditions or economic overheating.
When you multiply these two metrics, the product magnifies the impact of simultaneous market exuberance (high SPX) and rising yields (high US10Y). A very high SPX × US10Y value could indicate a market environment where valuations are stretched, and higher yields are increasing the cost of capital—often a precursor to market corrections.
2. Historical Patterns
In prior market tops, both equity valuations (SPX) and yields (US10Y) often peak together before significant corrections:
Dot-Com Bubble (2000): SPX was highly elevated, and rising yields signaled an end to loose monetary conditions.
2007-2008 Financial Crisis: SPX was at record highs, and US10Y yields were climbing, reflecting tighter monetary policy.
2021-2022 Post-Pandemic: SPX hit record highs, and yields started to rise sharply as inflation surged, leading to a market correction.
The SPX × US10Y value tends to peak during these moments, providing a warning signal of market excess.
If you are using the SPX × US10Y (multiplication) instead of division, it can still serve as a market indicator, though the mechanics are slightly different. Here’s why the product of the S&P 500 and the 10-year Treasury yield (SPX × US10Y) might be relevant for predicting market tops:
3. Economic Logic Behind the Indicator
A. Reflects Cost of Capital
Rising US10Y yields increase the discount rate used to value stocks. High SPX × US10Y suggests equities are vulnerable to revaluation if yields continue to rise.
B. Overheating Economy
High SPX × US10Y often coincides with an overheating economy, where inflation pressures push yields higher, while equities are driven by optimism. This imbalance can quickly reverse if monetary tightening occurs.
C. Peak Growth Phase
A peak in the SPX × US10Y value might signal the economy is at the late stage of the business cycle, where growth slows, and equities face headwinds.
4. Why It May Predict Market Tops
Valuation Excess: A high SPX × US10Y product reflects elevated valuations combined with tightening financial conditions.
Transition to Risk-Off Environment: Rising yields make bonds more attractive relative to stocks, potentially triggering equity outflows.
Fed Policy Influence: If yields are rising due to Federal Reserve tightening, equity markets often react negatively as borrowing costs rise and liquidity is withdrawn.

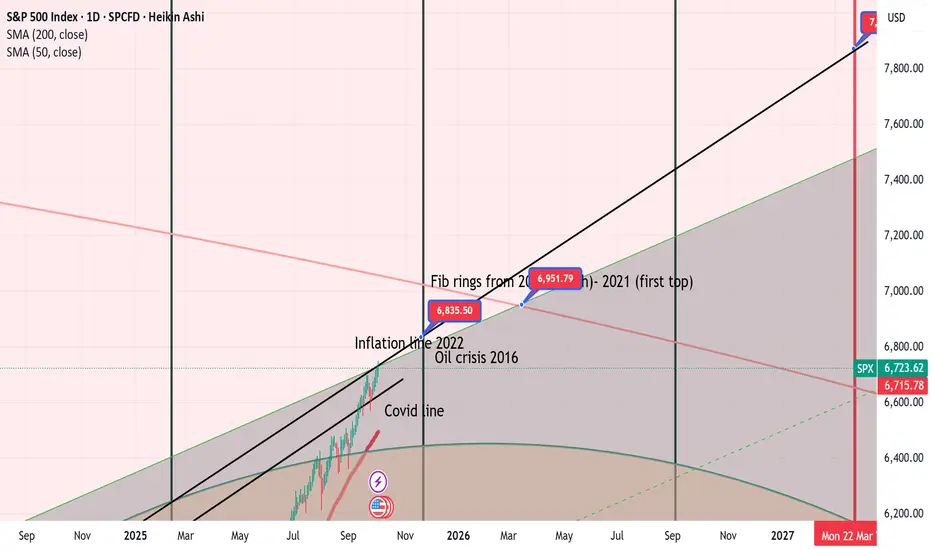
How far Spx can go? My guess is 9000 point by March 2027Gann cycles are telling me that if the liquidiy in the system carries on we can see a bullish 2026 and the top of the market in March 2027.
After that I expect a major crash. Therefore, I could tell that 1929 crash is on the horizon but this time a little bit earlier.
If I am Ok, we could see 2027 top and two years of sell off in the market.
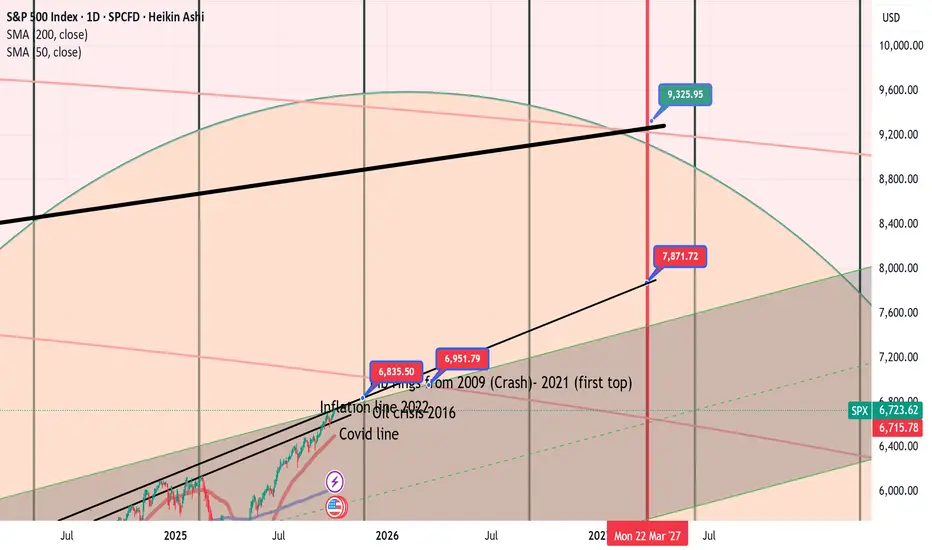
KEY AREASLiquidity is on the system. That will allow Spx continue growing. Now, the question is: How far Spx will go? and the most important. Until when?
Spx is clingin between very important support and resistance zones: Covid 2020, Oil 2016, previous tops (2021) and Inflation (2022).
The Gann cycle allows me to point out a date: 20th November as a key date. Cycles as this allows me to see a major break out.
We could see 7000 pips by the end of November and then a continuation.
Just have a look at this support and resistance areas which so far are playing out beautifuly.
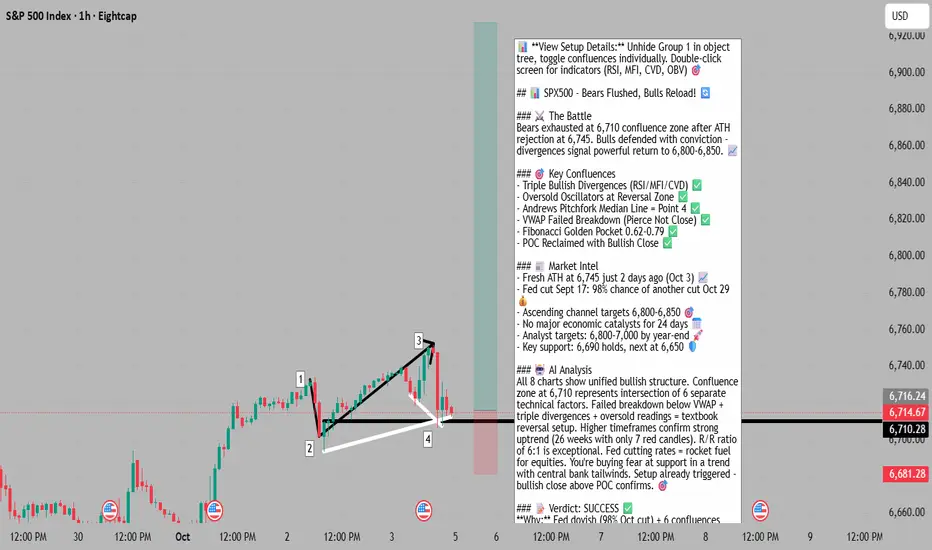
Bears Flushed at Channel Support - Bulls Reload 📊 **To view my confluences and linework:**
Step 1️⃣: Grab the chart
Step 2️⃣: Unhide Group 1 in the object tree
Step 3️⃣: Hide and unhide specific confluences one by one
💡 **Pro tip:** Double-click the screen to reveal RSI, MFI, CVD, and OBV indicators alongside divergence markings! 🎯
⚔️ Bears Flushed at Channel Support - Bulls Reload 🔄
The Market Participant Battle:
Bears just lost a critical skirmish. After pushing SPX down from fresh all-time highs at 6,745 on October 3rd, the selling pressure exhausted precisely at the intersection of multiple support confluences around 6,710. The setup is textbook: bears overextended their hand at a major resistance cluster (Andrews Pitchfork median line, VWAP standard deviation, golden Fibonacci zone), creating bullish divergences across RSI, MFI, and CVD. Bulls defended the 6,710 level with conviction, and now the spring is coiled for a powerful return back toward 6,800-6,850. This is classic institutional accumulation at support - let retail sell into strong hands, then reverse hard. 📈
Confluences:
Confluence 1: Triple Bullish Divergences (RSI, MFI, CVD) 📊
The 1-hour chart reveals the smoking gun: while price made lower lows from point 3 to point 4, RSI, MFI, and CVD all made higher lows. This is textbook bullish divergence indicating weakening bearish momentum despite falling price. The divergences are marked clearly on your indicators - RSI showed "Bear" tags at points 1, 2, and 3, but failed to confirm at point 4. MFI followed the same pattern. Most importantly, CVD (Cumulative Volume Delta) shows buyers stepping in despite price weakness, revealing hidden institutional accumulation. These divergences on the 1H timeframe carry significant weight, especially when confirmed across multiple momentum indicators simultaneously.
Confluence 2: Oversold RSI and MFI Conditions ⚡
Both RSI and MFI hit oversold territory at point 4, creating a classic mean-reversion setup. While the higher timeframes show SPX in overbought territory (which is normal in strong uptrends), the pullback created oversold readings on the 1H and 2H charts. This creates an asymmetric opportunity - buying at oversold levels within a confirmed uptrend. The RSI bounced from near 30, and MFI showed similar exhaustion. This oversold condition combined with the divergences suggests the selling pressure has been fully absorbed.
Confluence 3: Andrews Pitchfork - Median Line Precision 🎯
The Andrews Pitchfork anchored at points 1, 2, and 3 shows remarkable precision - point 4 landed exactly on the median line of the pitchfork. This is a high-probability reversal zone in pitchfork theory. The price action shows respect for this geometry, with the median line acting as dynamic support. The pitchfork structure suggests the next move should target the upper parallel channel line, which aligns with the 6,800-6,850 zone identified in broader market analysis. This technical pattern has been reliable throughout this uptrend sequence.
Confluence 4: Anchored VWAP - Failed Breakdown 💪
The VWAP anchored at point 1 (the swing low) provides critical context. Price pierced below the 1st standard deviation line but critically failed to close below it. This is a failed breakdown - a bullish signal that suggests sellers couldn't establish conviction below this institutional reference point. The wick below VWAP represents stop-hunting and capitulation selling, but the close back above the 1st standard deviation shows bulls defended this level aggressively. This failed breakdown pattern often precedes sharp reversals as shorts get trapped.
Confluence 5: Fibonacci Golden Zone (0.62-0.79 Retracement) 📐
The pullback from point 3 to point 4 retraced perfectly into the 0.62-0.79 Fibonacci zone - the "golden pocket" where probability favors reversals. This is the sweet spot for trend continuation entries. The fib extension from the 2→3 move shows point 4 landed right in this high-probability reversal zone. Combined with the other confluences, this creates a layered support structure that makes the 6,710 area a fortress for bulls.
Confluence 6: Developing POC and Volume Profile 📊
Your 2H chart shows a developing Point of Control (POC) at the recent low, with a bullish candle closing above it. This is significant - it shows that after the dip below the developing POC, buyers stepped in with conviction to reclaim it. The volume profile analysis suggests this area represents strong two-way trade, but the bullish close above the POC indicates buyers won this battle. This shift from below to above the POC is often an early signal of trend resumption.
Web Research Findings:
- **Technical Analysis:** SPX hit fresh all-time highs of 6,745-6,750 on October 3, 2025, just 2 days ago. The index is trading in a well-defined ascending channel that began on May 23, 2025. Current key support levels are 6,690 (short-term) and 6,120 (medium-term). Upside targets within the channel are 6,800-6,850, which represents the upper boundary of the ascending channel. Multiple technical analysts note that while RSI on higher timeframes is overbought (above 70), this can persist in strong uptrends. Investtech notes "no resistance in the price chart and further rise is indicated."
- **Recent News/Earnings:** The S&P 500 just posted its 52nd record high of 2025, closing above 6,700 for the first time. The market has shown exceptional strength with only 7 red weekly candles out of the last 26 weeks. Major tech companies continue to report strong earnings, with Nvidia announcing a massive $100 billion investment in OpenAI data centers. The market has largely shrugged off concerns about a potential US government shutdown, focusing instead on dovish Fed policy. Market breadth shows the only Mag-7 stocks above 2024 highs are Nvidia and Microsoft, suggesting some rotation but not broad weakness.
- **Analyst Sentiment:** Mixed but leaning bullish. Several analysts target 6,800-6,850 in the near term. Deutsche Bank's Chief Global Strategist calls for SPX to hit 7,000 by year-end. Some analysts warn of potential correction due to overbought conditions and breadth divergences, but most view any pullbacks as buyable. OANDA's Kelvin Wong states: "The US SPX 500 has continued to evolve within a medium-term ascending channel...The hourly RSI momentum indicator remains in a bullish momentum condition." However, some caution about euphoric sentiment and potential for healthy correction to 6,500 area if current levels fail.
- **Data Releases & Economic Calendar:** No major economic releases in the next 24-48 hours that could derail the setup. The critical September jobs report has already passed. The next significant event is the FOMC meeting on October 29, 2025 (24 days away). The US government shutdown may delay some economic data releases, but markets have shown resilience to this uncertainty.
- **Interest Rate Impact:** This is a MAJOR bullish catalyst. The Fed cut rates by 25 basis points on September 17, 2025, moving from 4.50% to 4.00%-4.25% range. CME FedWatch Tool shows 98% probability of another 25bp cut at the October 29 FOMC meeting, and 87% probability of a third cut in December. This would bring rates to 3.50%-3.75% by year-end. Fed Governor Stephen Miran has been pushing for even more aggressive cuts. The dovish Fed pivot is providing strong tailwinds for equities. Lower rates increase liquidity and typically fuel risk asset rallies. This is creating a "positive feedback loop" according to market analysts.
Layman's Summary:
Here's what all this means in simple terms: The S&P 500 just hit a new record high 2 days ago at 6,745, then pulled back to 6,710 - about a 0.5% dip. This is completely normal and healthy in an uptrend. The Federal Reserve (the people who control interest rates) just cut rates and is highly likely to cut again in 3 weeks. Lower interest rates are like rocket fuel for stocks because they make money cheaper and drive investors into equities. Your technical setup caught this pullback at the exact right spot - multiple indicators show the selling is exhausted and buyers are stepping back in. The big picture: we're in a strong uptrend with the central bank on our side, you're buying a small dip at strong support, and the path of least resistance is back up to 6,800-6,850. The risks? Market is a bit overbought on bigger timeframes, but in strong trends that can persist for a while. No major scary news on the horizon that would crash the market. This is a high-probability bounce setup in favorable market conditions. 🎯
Machine Derived Information:
- **Image 1 (1H Chart - Main Setup):** Shows the complete trade structure from points 1-4 with the Andrews Pitchfork and key horizontal support/resistance levels. The gray area is background, not a support box. Point 4 landed at the pitchfork median line around 6,710. **Significance:** This reveals the geometric precision of the reversal zone and the logical price structure. **AGREES ✔**
- **Image 2 (1H Chart - Annotations):** Details the specific confluences: 1→4 sequence, bullish divergences on RSI/MFI/CVD, oversold conditions, Andrews Pitchfork catching point 4 at median line, anchored VWAP pierce but no close below 1st std dev, and Fibonacci 0.62-0.79 pullback zone. **Significance:** This image provides the technical evidence backing the entire trade thesis - all confluences are clearly marked and valid. **AGREES ✔**
- **Image 3 (1H Chart - Bollinger Bands):** Shows the same setup with Bollinger Band overlay and cumulative delta analysis. Points 1-4 are marked with price action context. **Significance:** The Bollinger Band touch at point 4 adds another technical confluence, showing price reached the lower band (another oversold indicator) before reversing. **AGREES ✔**
- **Image 4 (1H Chart - Indicators Panel):** The most critical image - shows RSI with "Bear" tags at points 1, 2, and 3 (each at peaks), MFI weakness, and CVD analysis. The bullish divergences are visually obvious here as indicators make higher lows while price makes lower lows. **Significance:** This is the proof of momentum divergence - the engine driving the reversal setup. Shows clear exhaustion of selling pressure. **AGREES ✔**
- **Image 5 (1H Chart - Pitchfork Focus):** Zoomed view emphasizing the Andrews Pitchfork structure with downtrend lines. Shows how point 4 aligned perfectly with the median line. **Significance:** Reinforces the geometrical precision of the setup and the probability of mean reversion back toward the upper pitchfork boundary. **AGREES ✔**
- **Image 6 (2H Chart - Bigger Picture):** Steps back to the 2H timeframe showing the broader uptrend from 6,657 to the recent highs. Shows trend strength indicators: +28 bars uptrend on 50-bar basis, strong positive readings. The current level shows as TLPv27.1 with uptrend strength metrics. **Significance:** Confirms we're buying a pullback in a confirmed uptrend, not trying to catch a falling knife. The 2H timeframe validates the bullish structure. **AGREES ✔**
- **Image 7 (2H Chart - Trade Levels):** Shows detailed trade management with entry at 6,715, stop at 6,688 (34.96 points, 0.52%), and targets. Risk/Reward ratio of 6.04 is marked. Long TP and Short EN zones are marked showing institutional trade clusters. **Significance:** Demonstrates proper risk management with tight stop below key support and excellent R/R ratio. The 0.52% stop is appropriate for this setup. **AGREES ✔**
- **Image 8 (3H Chart - Pattern Context):** Shows an Ascending Triangle pattern on the 3H timeframe with targets at 6,799.19 (T1) and 6,967.1 (T2). Entry marked at 6,715.23, stop at 6,631.28. Pattern is 18 periods old and still valid. **Significance:** Adds a bullish continuation pattern context on higher timeframe. The ascending triangle supports the bullish thesis and provides additional upside targets that align with channel resistance. **AGREES ✔**
Actionable Machine Summary:
All eight chart images present a unified, coherent bullish case with zero contradictions. The setup quality is exceptional: 1) You have a confluence zone (6,710) where five distinct technical factors converge - pitchfork median, VWAP standard deviation, Fibonacci golden zone, developing POC, and oversold indicators. 2) Momentum divergences on three separate indicators (RSI, MFI, CVD) confirm selling exhaustion at this exact level. 3) Higher timeframe structure (2H and 3H) confirms we're in a strong uptrend with an ascending triangle pattern projecting targets to 6,800-6,967. 4) Risk management is proper with a tight 0.52% stop (6,688) below all key support structures. 5) The R/R ratio of 6:1 is excellent, meaning you only need this trade to work 1 out of 6 times to be profitable long-term. For execution: Entry 6,715, Stop 6,688, Target 1: 6,799, Target 2: 6,850-6,967. The setup has already triggered (you're at point 4), and the bullish candle closing above the developing POC suggests the reversal is confirming. This is a textbook high-probability mean-reversion long in a trending market. 🎯
Conclusion:
**Trade Prediction:** SUCCESS ✅
**Confidence:** High
**Key Reasons for Success:**
1. **Fed Tailwinds Are Massive:** With 98% probability of rate cut on Oct 29 and 87% for December, monetary policy is your friend. Lower rates = higher stock prices. This macro backdrop creates a bullish bias that makes buying dips in uptrends a high-probability strategy.
2. **Multiple Technical Confluences Align Perfectly:** It's rare to get this many factors agreeing at one price level - pitchfork median, VWAP, Fibonacci golden zone, POC, oversold oscillators, and triple divergences all at 6,710. This creates a high-conviction zone.
3. **Uptrend Structure Intact:** The ascending channel from May 23 is well-defined with clear targets at 6,800-6,850. You're buying a pullback within this structure, not fighting the trend. The 2H and 3H charts confirm trend strength.
4. **Failed Breakdown Below VWAP:** Price pierced below 1st standard deviation VWAP but couldn't close there - this is a bear trap. Failed breakdowns often lead to explosive reversals as shorts cover and bulls regain control.
5. **Excellent Risk/Reward:** With a stop at 6,688 and targets at 6,799-6,850, you're risking ~0.52% to make 1.2%-2.0%. That's a 2.3:1 to 3.8:1 R/R ratio on the conservative side, and your chart shows 6:1 if the full move plays out.
**Key Risks to Monitor:**
1. **Overbought on Higher Timeframes:** While the pullback created oversold conditions on 1H-3H, the daily and weekly charts show RSI >70. This means the market could enter a consolidation or deeper correction. If 6,688 breaks, next support is 6,650-6,660.
2. **Breadth Divergences Noted by Analysts:** Some market analysts point out that only Nvidia and Microsoft are above 2024 highs among Mag-7 stocks. This suggests the rally may be narrowing, which can precede corrections.
3. **Euphoric Sentiment:** Several analysts warn that sentiment has shifted from fear to euphoria. When everyone is bullish, it can create crowded positioning that reverses sharply. However, this is more of a medium-term risk than a short-term factor.
4. **Stop Below 6,690 Critical:** Your key support at 6,690 is the line in the sand. A clean break below on volume would invalidate the setup and could lead to 6,650 or even 6,600. Respect your stop.
5. **October Seasonality:** While the Rosh Hashanah to Yom Kippur weakness period just passed (Sept 22-Oct 2), October can still be volatile. However, historical data shows October-January are typically strong months for equities.
**Risk/Reward Assessment:**
The R/R strongly justifies this trade. Risking 0.52% (to 6,688) to make 1.2%-2.0% (to 6,800-6,850) is textbook asymmetry. Even if this setup only has a 50% win rate, the R/R makes it profitable over time. But given the confluence of factors, I'd estimate 65-70% probability of reaching at least 6,799 in the next 5-10 trading days.
**Final Recommendation:** TAKE THE TRADE 🚀
**Execution Plan:**
- **Entry:** 6,715 (you're already in based on chart 7) ✅
- **Stop Loss:** 6,688 (below all key support structures)
- **Target 1:** 6,799 (T1 from ascending triangle) - Take 50% profit here
- **Target 2:** 6,850 (upper channel boundary) - Let the rest ride with trailing stop
- **Time Horizon:** 5-10 trading days expected for T1, potentially 2-3 weeks for T2
**Risk Management:**
With a 0.52% stop, this is a well-sized trade. If using 1% account risk per trade, this translates to approximately 2x normal position size given the tight stop. The excellent R/R ratio supports slightly larger position sizing, but never exceed 2% account risk on any single trade.
The setup is firing on all cylinders: technical, fundamental (Fed policy), and sentiment (buying fear in an uptrend). The market just gave you a gift by pulling back to this confluence zone. Don't overthink it - execute the plan, respect the stop, and let probability work in your favor. Bulls have all the ammo they need to push this back to 6,800+. 🎯💪
Good luck and trade safe! 🚀
SP500 1H🔹 Overall Outlook and Potential Price Movements
In the charts above, we have outlined the overall outlook and possible price movement paths.
As shown, each analysis highlights a key support or resistance zone near the current market price. The market’s reaction to these zones — whether a breakout or rejection — will likely determine the next direction of the price toward the specified levels.
⚠️ Important Note:
The purpose of these trading perspectives is to identify key upcoming price levels and assess potential market reactions. The provided analyses are not trading signals in any way.
✅ Recommendation for Use:
To make effective use of these analyses, it is advised to manually draw the marked zones on your chart. Then, on the 15-minute time frame, monitor the candlestick behavior and look for valid entry triggers before making any trading decisions.
Fundamental Analysis S&P500 NEOWavehere’s a short economic analysis of the U.S. economy in English:
🇺🇸 U.S. Economic Analysis (2025)
The U.S. economy remains resilient in 2025, supported by strong consumer spending, a stable labor market, and easing inflation. GDP growth is expected to hover around 1.8–2.0%, indicating moderate expansion after a period of tight monetary policy.
The Federal Reserve has begun gradual rate cuts, aiming to sustain growth while keeping inflation near its 2% target. Corporate earnings are steady, but high valuations and policy uncertainty present risks.
Overall, the outlook is cautiously optimistic, with solid fundamentals but potential headwinds from global trade tensions and fiscal pressures.

The dollar on the brink: how the 80-year cycle from Bretton WoodThe US is on the verge of a monetary breakdown, worse than a recession. He compared the situation to the debt crisis of the 1930s, which led to the Great Depression. Today, the US is in the same trap: debt exceeds $37 trillion, and the ratio to GDP is 119 percent as of August 2025.
Today, the dollar is losing ground faster than ever since 1973, and this is no accident.
The Federal Reserve cut interest rates to 4.25 percent in September, but that is not enough. US GDP growth has slowed to 1.7 percent in the forecast for the year, with unemployment at 4.3 percent.
Consumers are spending less: spending rose by only 0.6 percent in August. And inflation? It fell to 2.3 percent in May, but the risks of a return are growing due to Trump's tariffs. These import duties — 10-20 percent on China and Europe — are hitting exporters such as Midwestern farmers.
If confidence collapses, bond rates will soar and inflation will return. Dalio paints a picture in his book How Nations Go Bankrupt: empires fall when debt stifles growth.
I expect that the rate will not be lowered, portfolio position fixing will begin across the entire market, including precious metals and cryptocurrencies. As was the case in April 2025.
The decline will be like in April 2025.

S&P 500 (SPX / US500) – Late Cycle Top FormingAnalysis Date: October 2025
Analyst View: Potential downtrend start within 2 - 6 weeks
🧭 Market Outlook (2025 → 2026)
Scenario Probability Expected Move Timing
🟥 Base Case – Late-Cycle Correction 45 % -18 % to -25 % → 5,400–4,800 zone Oct–Nov 2025 start
🟩 Bullish Extension – Blow-Off Phase 30 % +5 % to +10 % → 7,000–7,300 Oct 2025 – Q1 2026
🟥 Bearish Shock – Deep Recession Phase 15 % -30 % to -40 % → 4,000–3,800 Dec 2025 – Mid 2026
🟨 Sideways / Range Consolidation 10 % 6,400–5,800 Oct 2025 – Mid 2026
---
📊 Technical Levels to Watch
Level (USD) Significance
6,800–6,750 Major resistance / top zone
6,550 Breakdown trigger
6,200 Mid-channel support
5,400–5,300 Correction target
4,850–4,800 Bearish completion zone
7,200 Bullish invalidation level
---
🔍 Key Technical Signals
Rising wedge + channel top = exhaustion pattern
Weekly RSI divergence confirming overextension
VIX > 20 = risk-off confirmation
Advance/Decline line not confirming new highs
Volume divergence and failed breakout = early trigger
---
🧩 Macro + Cycle Alignment
Cycle / Theme Current Phase (as of Oct 2025) Impact
18-Year Housing Cycle Peak (2024 → 2026) Credit stress emerging
Business Cycle Late expansion → slowdown Earnings compression risk
Liquidity Cycle Tight but easing expectations Delay in Fed cuts = bearish
Tech/AI Bubble Wave Euphoric phase Prone to sharp rotation
Fiscal Cycle Heavy deficits Yield curve volatility ↑
---
⚙️ Confirmation Checklist
☑ Weekly close below 6,550
☑ VIX > 20
☑ Breadth deterioration (A/D line weak)
☑ 10-Year yield > 4.8 %
☑ Housing data rolling over
☑ Credit spreads widening

SPX500USD is still going upHi traders,
Another move for SPX500USD that played out as predicted in my previous outlook.
After a small correction last week it went up and made another small correction down.
So next week we could see more upside again to make a new ATH.
Let's see what the market does and react.
Trade idea: Wait for a small pullback down and a change in orderflow to bullish on a lower timeframe to trade longs.
If you want to learn more about trading FVG's & liquidity sweeps with Elliott wavecount and patterns, then please make sure to follow me.
This shared post is only my point of view on what could be the next move in this pair based on my technical analysis.
Don't be emotional, just trade your plan!
Eduwave

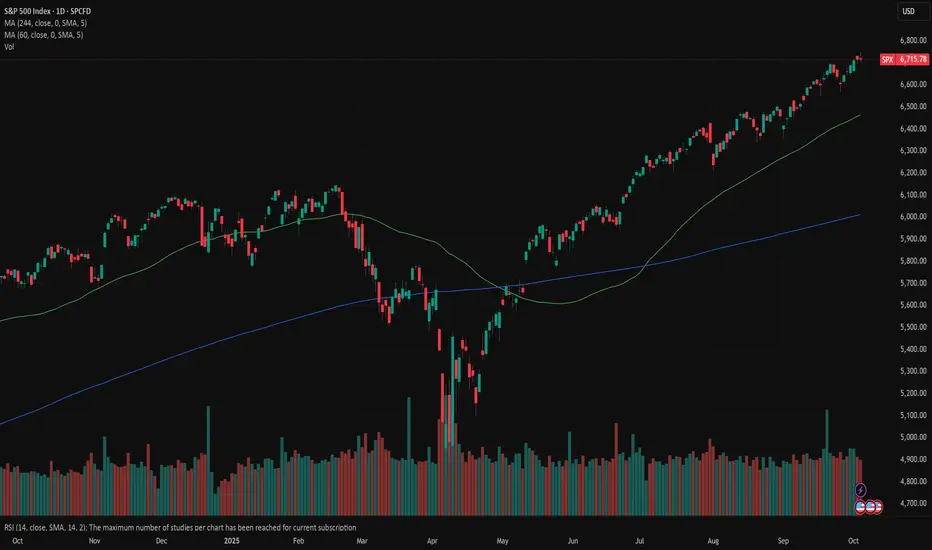
S&P 500 Technical Analysis & Trading OutlookCurrent Price: 6,715.20 | Date: October 4, 2025
📊 MARKET OVERVIEW
The S&P 500 is trading at 6,715.20, hovering near historical resistance zones. This analysis integrates multiple technical frameworks to provide actionable insights for both intraday and swing traders.
🔍 MULTI-TIMEFRAME TECHNICAL ANALYSIS
Monthly & Weekly Perspective (Swing Trading)
Elliott Wave Analysis:
The index appears to be in a Wave 5 extension of a broader bullish impulse from the 2022 lows
Monthly chart shows potential exhaustion signals as we approach the 6,750-6,800 resistance cluster
Wave structure suggests a possible corrective phase (ABC) may initiate in Q4 2025
Ichimoku Cloud (Weekly):
Price trading above the cloud - bullish structure intact
Tenkan-sen (9): 6,682 | Kijun-sen (26): 6,591
Future Senkou Span projects resistance at 6,780-6,820
Key Support Levels (Swing):
6,620 - Kijun-sen weekly support
6,480 - 50-week EMA (critical long-term support)
6,350 - Monthly pivot & Wyckoff accumulation zone
6,180 - 200-week MA (major bull/bear line)
Key Resistance Levels (Swing):
6,750 - Psychological resistance & Gann 1x1 angle
6,820 - Ichimoku cloud projection
6,945 - Fibonacci 1.618 extension from August lows
Daily & 4-Hour Perspective
Wyckoff Analysis:
Current phase suggests late distribution (UTAD - Upthrust After Distribution)
Volume declining on recent rallies - potential weakness
Accumulation zone identified: 6,480-6,550 for re-entry
Harmonic Patterns:
Bearish Bat pattern forming on the 4H chart
PRZ (Potential Reversal Zone): 6,740-6,760
Bearish divergence on RSI confirming pattern validity
Bollinger Bands (Daily):
Price at upper band (6,735) - overextended
Band width expanding - increased volatility expected
Middle band support: 6,580
Volume Analysis:
VWAP (Anchored from September low): 6,612
Volume profile shows weak volume above 6,700
High volume node (HVN) at 6,550-6,600 - strong support
Intraday Analysis (1H, 30M, 15M, 5M)
Current Intraday Setup:
RSI (Relative Strength Index):
1H RSI: 67.8 (approaching overbought)
15M RSI: 72.3 (overbought territory)
Bearish divergence forming on 30M chart
Moving Averages:
Death Cross Warning: 50 EMA approaching 200 EMA on 4H chart
1H: 20 EMA (6,698) acting as immediate support
5M: Price oscillating around 50 EMA (6,712)
Gann Analysis:
Gann Square of 9: Next resistance at 6,728 (45° angle)
Time cycle suggests potential reversal window: October 7-9, 2025
Price/Time square approaching - expect volatility spike
Candlestick Patterns (Recent):
Evening Star formation on 4H chart (bearish reversal)
Long upper wicks on 1H chart - rejection at resistance
Doji formation on daily - indecision
🎯 TRADING STRATEGIES
INTRADAY TRADING SETUP (Next 5 Trading Days)
Bearish Scenario (Higher Probability - 65%):
Entry Zones:
Primary Short Entry: 6,725-6,735 (upon rejection)
Secondary Short Entry: 6,750-6,760 (if breakout fails - bull trap)
Stop Loss:
Above 6,775 (invalidation level)
Profit Targets:
TP1: 6,680 (20 EMA support - 1H)
TP2: 6,650 (VWAP anchor)
TP3: 6,620 (Kijun-sen weekly)
TP4: 6,580 (Daily BB middle band)
Risk-Reward Ratio: 1:3 minimum
Confirmation Signals:
Break below 6,700 with increased volume
RSI crosses below 50 on 1H chart
MACD bearish crossover on 30M
Bullish Scenario (Lower Probability - 35%):
Entry Zones:
Long Entry: 6,680-6,690 (upon bounce from 20 EMA)
Aggressive Long: 6,650-6,660 (VWAP retest)
Stop Loss:
Below 6,635
Profit Targets:
TP1: 6,720 (resistance retest)
TP2: 6,750 (psychological level)
TP3: 6,780 (Ichimoku cloud resistance)
Confirmation Signals:
Volume surge on bounce
RSI bullish divergence on 15M
Break above 6,720 with strong momentum
SWING TRADING SETUP (2-4 Week Outlook)
Primary Strategy: SELL ON RALLY
Phase 1 - Distribution (Current):
Expect choppy price action between 6,680-6,750
Ideal swing short entry: 6,735-6,760
Stop loss: 6,820
Target: 6,480-6,550 (Accumulation zone)
Time horizon: 2-3 weeks
Phase 2 - Accumulation (Upcoming):
Watch for bullish reversal patterns in 6,450-6,550 zone
Potential H&S inverse or double bottom formation
Long entry upon confirmation
Target: 6,850-6,950 (Next impulse wave)
Time horizon: 4-8 weeks
⚠️ RISK FACTORS & MARKET CONTEXT
Trap Alert:
Bull Trap Risk: HIGH above 6,750
Weak volume at resistance suggests false breakout potential
Head and Shoulders pattern forming on 4H chart
Bear Trap Risk: MODERATE below 6,650
Strong support zone with high volume profile
Potential quick reversal if broken
Geopolitical & Macro Factors:
Fed policy uncertainty - rate decision impact expected mid-October
Q3 earnings season beginning - volatility spike likely
Geopolitical tensions may trigger safe-haven flows
Seasonal October volatility historically present
Volume Volatility Assessment:
Current State: Declining volume on rallies (bearish)
Expected: Volume spike at 6,750 resistance or 6,650 support
Strong Trend Confirmation: Sustained volume >15% above 20-day average
🎯 TRADING PLAN SUMMARY
For Next Week (Oct 4-11, 2025):
Monday-Tuesday: Expect resistance at 6,725-6,735. Look for short opportunities on rejection.
Wednesday-Thursday: Gann time cycle window - increased volatility. Watch for break of 6,700 or 6,750.
Friday: Weekly close crucial - below 6,680 confirms bearish bias; above 6,750 invalidates short setup.
Optimal Strategy:
Sell rallies into 6,730-6,750 resistance
Wait for confirmation - don't chase
Manage risk strictly - volatile market conditions
Scale into positions - don't enter full size immediately
💡 TRADER'S EDGE
Pattern to Watch: The confluence of:
Bearish Bat harmonic completion
RSI divergence
Wyckoff distribution phase
Weak volume at resistance
Gann time/price square
Creates a HIGH-PROBABILITY SHORT SETUP at 6,735-6,760
Critical Levels This Week:
Bull Control: Hold above 6,700
Bear Control: Break below 6,650
Decision Zone: 6,675-6,725
📝 DISCLAIMER
This analysis is for educational purposes only. Trading involves substantial risk of loss. Always use proper risk management, never risk more than 1-2% of your capital per trade, and consider your own risk tolerance and trading plan. Past performance does not guarantee future results.
Stay disciplined. Trade the plan. Manage your risk.

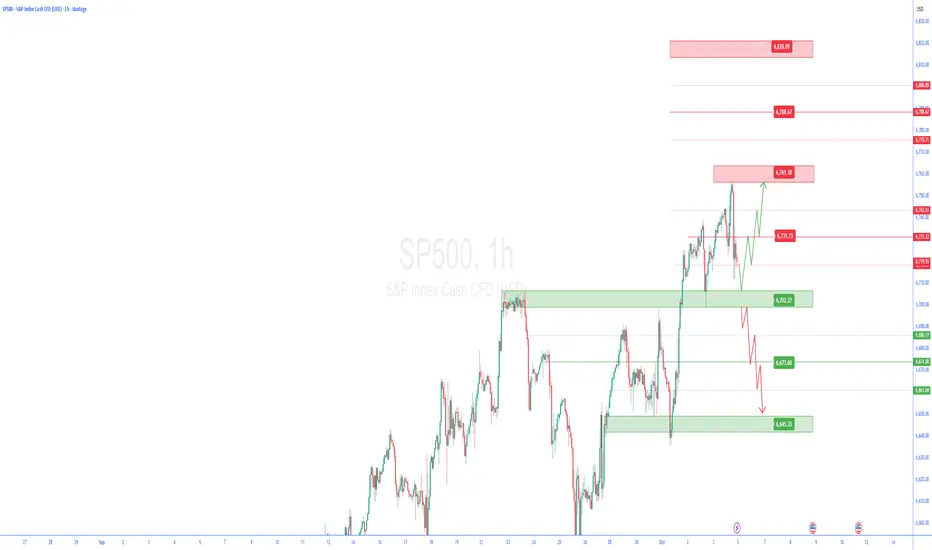
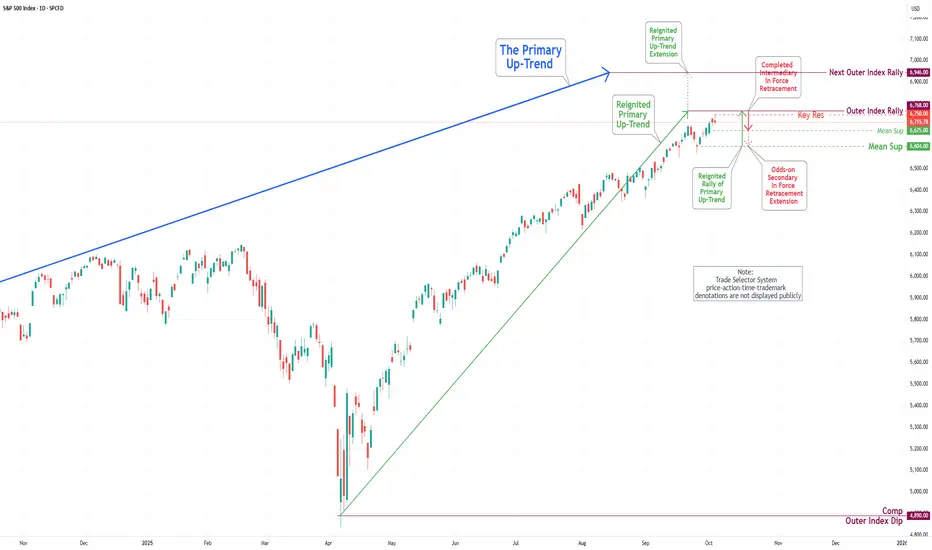
S&P 500 Daily Chart Analysis For Week of Oct 3, 2025Technical Analysis and Outlook:
In the previous week’s trading session, the S&P 500 Index demonstrated a significant increase in upward price activity, rebounding from the Mean Support level of 6585. The index not only retested but also exceeded our primary target set at Key Resistance of 6693 and the Inner Index Rally level of 6704.
At present, the index is situated just below the newly established Key Resistance level of 6750, and it appears to be on track to complete the Outer Index Rally at 6768, indicating the potential for further upward momentum in the near future that could extend to the subsequent Outer Index Rally target of 6946.
It is essential to recognize that upon achieving the Key Resistance target of 6750 and the Outer Index Rally target of 6768, there may be an ensuing pullback toward the Mean Support level of 6675. Furthermore, there is a possibility of a further decline that could extend to the Mean Support target of 6604.
Banks and Markets: Their Role in the Global EconomyIntroduction
In the vast and interconnected global economy, banks and financial markets play a fundamental role in ensuring stability, efficiency, and growth. They act as the twin pillars of the financial system—facilitating the flow of funds, supporting investments, managing risks, and promoting economic development. While banks serve as intermediaries between savers and borrowers, financial markets function as platforms for direct transactions between investors and issuers. Together, they form a dynamic ecosystem that influences everything from corporate financing and consumer spending to global trade and government policies.
Understanding the roles of banks and markets in the global context is crucial to grasping how modern economies function. Their interdependence shapes global capital flows, influences exchange rates, determines interest rates, and affects the pace of industrial and technological innovation.
1. The Role of Banks in the Global Market
Banks have evolved from simple money lenders and safekeepers to complex financial institutions that manage vast networks of credit, liquidity, and payment systems. Their global influence extends beyond national borders, affecting trade, investment, and financial stability.
1.1. Financial Intermediation
At their core, banks serve as financial intermediaries—linking those who have surplus funds (depositors) with those who need funds (borrowers). This intermediation ensures efficient allocation of capital. In the global market, this means channeling savings from developed economies (like the U.S., Japan, and Europe) into investment opportunities in emerging economies (like India, Brazil, or Indonesia).
By evaluating creditworthiness, managing risks, and offering tailored lending solutions, banks ensure that capital is allocated to productive uses. This process underpins economic growth and job creation worldwide.
1.2. Facilitating International Trade
International trade would not function smoothly without banks. Through mechanisms such as letters of credit, trade finance, and foreign exchange services, banks help importers and exporters conduct cross-border transactions securely.
For instance, a bank in India may guarantee payment to a supplier in Germany once the goods are shipped—reducing risk for both parties. Large multinational banks like HSBC, JPMorgan Chase, and Citibank have become key enablers of global trade, ensuring liquidity and trust between distant markets.
1.3. Supporting Monetary Policy and Financial Stability
Central banks—such as the Federal Reserve (U.S.), European Central Bank (ECB), and Reserve Bank of India (RBI)—play a special role in controlling the money supply, setting interest rates, and ensuring financial stability. Their decisions ripple through the entire global financial system.
For example, when the U.S. Federal Reserve raises interest rates, capital often flows out of emerging markets as investors seek higher returns in the U.S. This can cause currency depreciation and inflationary pressures in developing countries, illustrating how global banking policies interlink economies.
1.4. Managing Currency and Exchange Risks
With globalization, businesses deal in multiple currencies. Banks help manage foreign exchange risk by providing hedging tools like forward contracts, options, and swaps. Global banks act as major players in the forex market, providing liquidity and enabling international investors to move funds across borders efficiently.
1.5. Promoting Investment and Development
Banks finance infrastructure projects, startups, and industries that drive national and global development. In emerging markets, development banks like the World Bank and Asian Development Bank (ADB) provide long-term financing for projects that may not attract private investors. These investments support sustainable growth, reduce poverty, and create employment.
2. The Role of Financial Markets in the Global Economy
Financial markets complement the role of banks by providing a platform for direct capital exchange. They allow individuals, corporations, and governments to raise funds, trade assets, and manage financial risks efficiently.
2.1. Types of Financial Markets
The global financial system is composed of several interrelated markets:
Capital Markets: Where long-term securities like stocks and bonds are traded.
Money Markets: Where short-term debt instruments like treasury bills and commercial paper are exchanged.
Foreign Exchange (Forex) Markets: Where currencies are traded.
Derivatives Markets: Where futures, options, and swaps are used for speculation and hedging.
Commodity Markets: Where physical goods like oil, gold, and agricultural products are traded.
Each of these markets plays a crucial role in ensuring liquidity, price discovery, and efficient allocation of resources globally.
2.2. Facilitating Capital Formation
Financial markets help companies and governments raise funds by issuing shares or bonds to investors. For instance, when Apple issues corporate bonds, global investors—from pension funds in Canada to sovereign wealth funds in Singapore—can buy them. This mobilization of savings into investment fosters global economic development and innovation.
2.3. Promoting Liquidity and Price Discovery
Markets provide liquidity by allowing investors to easily buy or sell assets. The constant trading activity ensures that securities are fairly priced based on supply and demand. This price discovery function reflects real-time market sentiment about a company’s or economy’s health.
For example, if investors believe an economy is slowing down, stock indices fall—signaling caution to policymakers and businesses alike.
2.4. Risk Management through Derivatives
Derivatives markets allow investors to hedge against various financial risks, such as interest rate fluctuations, currency volatility, or commodity price changes. Airlines, for example, use futures contracts to lock in fuel prices, while exporters hedge against currency depreciation.
This risk transfer mechanism enhances global financial stability by distributing risks among willing participants.
2.5. Encouraging Global Integration
Financial markets link economies through cross-border investments. Institutional investors diversify portfolios by buying foreign securities, while multinational corporations issue bonds in multiple currencies. This integration deepens capital mobility, allowing funds to flow to regions offering the best returns.
However, it also means that shocks in one market—like the 2008 U.S. subprime crisis—can quickly spread globally, underscoring the interconnectedness of financial systems.
3. The Interdependence of Banks and Financial Markets
Banks and markets do not function in isolation. They are deeply interconnected, with each relying on the other for liquidity, pricing, and credit signals.
3.1. Banks as Market Participants
Banks actively participate in financial markets as investors, market makers, and risk managers. They trade government securities, manage portfolios of equities and bonds, and offer structured products to clients. Their trading activities help maintain market liquidity and stability.
3.2. Markets as Funding Sources for Banks
Banks themselves raise funds through capital markets by issuing bonds or equity. This diversification of funding sources strengthens their balance sheets and reduces dependence on deposits.
3.3. Transmission of Monetary Policy
Financial markets amplify the effects of central bank policies. When interest rates change, bond prices, equity valuations, and currency exchange rates adjust accordingly—affecting investment, consumption, and global trade patterns.
4. The Globalization of Banking and Markets
The 21st century has seen unprecedented global financial integration. Capital now flows across borders instantly, and financial institutions operate globally with advanced technology and regulation.
4.1. Cross-Border Banking
Large banks maintain operations in multiple countries, offering services from investment banking to retail lending. This enables efficient cross-border financing, supports global trade, and enhances capital mobility. However, it also introduces systemic risks when crises spread through global networks.
4.2. Technology and Fintech Revolution
Digital transformation has reshaped global banking and markets. Fintech companies, online trading platforms, blockchain, and cryptocurrencies have democratized access to financial services. Individuals can now trade global assets or transfer money across borders instantly.
This digitization of finance enhances efficiency but also challenges regulatory frameworks and traditional banking structures.
4.3. The Rise of Global Capital Flows
Global capital flows—foreign direct investment (FDI), portfolio investments, and remittances—have become key drivers of global economic activity. Financial markets serve as the main channels for these flows, helping countries finance deficits, build infrastructure, and stabilize currencies.
5. Challenges Faced by Banks and Markets in the Global Context
Despite their importance, both banks and markets face several risks and challenges that can threaten global stability.
5.1. Financial Crises and Systemic Risk
Events like the 2008 Global Financial Crisis and the 2020 COVID-19 market crash exposed vulnerabilities in both banking and market systems. Excessive leverage, poor risk management, and inadequate regulation can lead to contagion effects that spread across countries and sectors.
5.2. Regulatory Complexity
The global financial system is governed by a web of regulations—Basel norms for banks, securities laws, and anti-money-laundering frameworks. Ensuring compliance across jurisdictions is complex, particularly for multinational institutions.
5.3. Technological and Cybersecurity Risks
As banks and markets digitize, cyber threats pose significant risks. Data breaches, fraud, and hacking incidents can undermine trust and disrupt financial systems globally.
5.4. Inequality and Market Concentration
While financial globalization has boosted wealth creation, it has also widened income inequalities. Large financial institutions and investors often benefit disproportionately, while smaller participants struggle to compete.
5.5. Climate Change and Sustainable Finance
Modern banking and markets are under pressure to support sustainable finance—channeling capital into green and ethical investments. Institutions are now integrating Environmental, Social, and Governance (ESG) criteria into lending and investment decisions to ensure long-term sustainability.
6. The Future of Global Banking and Financial Markets
As the world moves deeper into the digital and data-driven era, the structure and role of banks and markets are evolving rapidly.
6.1. Digital Banking and Decentralized Finance (DeFi)
Traditional banking is being transformed by digital banks, blockchain, and DeFi platforms. These technologies remove intermediaries, reduce costs, and increase transparency—potentially reshaping how global capital moves.
6.2. Artificial Intelligence and Automation
AI-driven analytics, robo-advisors, and algorithmic trading are revolutionizing decision-making in both banking and markets. They enable faster, data-backed investment strategies and risk assessments, though they also introduce new systemic risks.
6.3. Central Bank Digital Currencies (CBDCs)
Many central banks are exploring CBDCs to modernize payment systems and enhance financial inclusion. Digital currencies could make cross-border transactions faster and cheaper while maintaining state oversight.
6.4. Global Cooperation and Regulation
Future financial stability will depend on international regulatory coordination. Organizations like the IMF, World Bank, and Financial Stability Board (FSB) will continue to play key roles in guiding policy frameworks and crisis management.
Conclusion
Banks and financial markets are the lifeblood of the global economy. They connect savers with borrowers, enable trade, manage risks, and drive innovation. Together, they form a complex yet indispensable system that powers growth, investment, and prosperity across nations.
However, their increasing globalization, technological transformation, and systemic interdependence also make them vulnerable to shocks and crises. The challenge for policymakers, investors, and institutions is to balance efficiency with stability, innovation with regulation, and profit with sustainability.
In the future, as the global economy becomes more digital, inclusive, and sustainable, the partnership between banks and markets will remain the cornerstone of economic progress—shaping how nations develop, businesses grow, and individuals achieve financial well-being in an interconnected world.