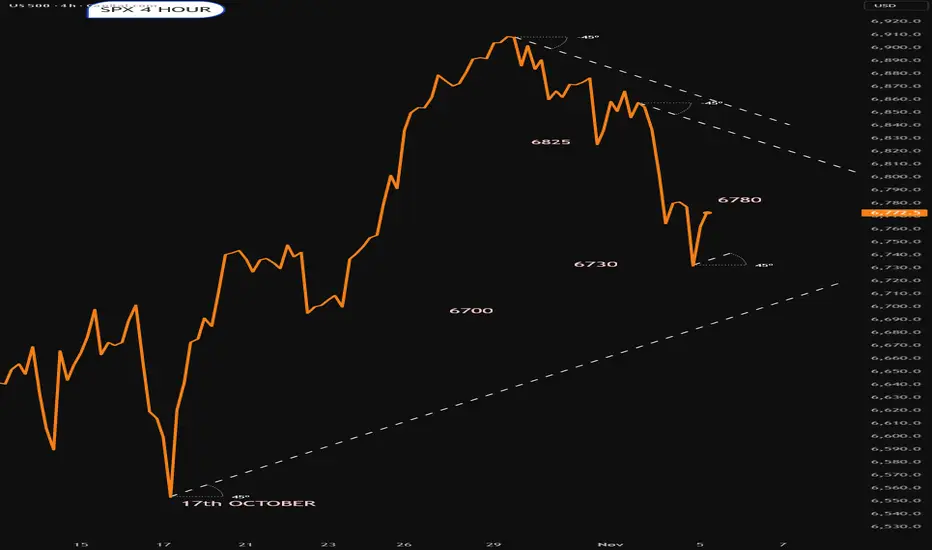
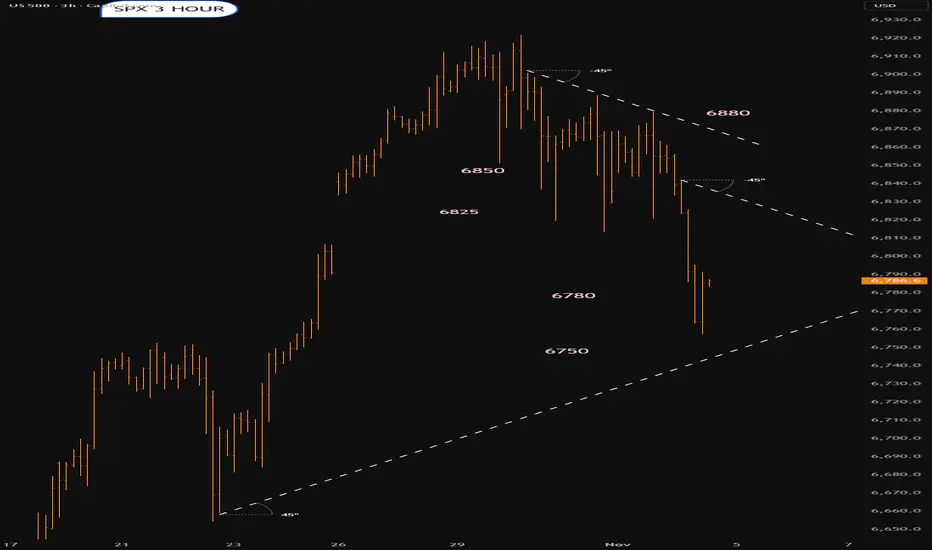
SPX updated for November 5thTrying to bounce.Plenty of resistance
Bulls will want to keep it above 6700
November 5th a big day over here in the UK.420 years ago Guy Fawkes tried to blow up our parliament.He and his gang were caugh ton 5th Novemeb3r 1605
Trade ideas
US 500 - Has All the Good News Been Priced?Concerns about excessive stock market valuations, especially when talking about AI focused companies, isn’t something new. In fact, it has been an on-going theme over the last 6 months of the year leading to bouts of risk aversion.
This was again the case late on Monday evening, and throughout the day yesterday when the earnings of Palantir Technologies were in the spotlight. The strange thing was that the earnings from this company, released after the close on Monday, beat analysts’ expectations, however a lack of clarity on future revenue needed to justify a market capitalisation of over $600 billion was what brought the latest concerns of an AI bubble back to the attention of traders, leading to a negative sentiment shift for the wider sector and the US 500 index in general.
Now, this may or may not be the start of a wider correction and much will depend on future risk events, price action and technical trends (more on this below), however the question for traders this time around is whether the positive news flow for US indices in the short term has already been priced? After all the US 500 index only hit a new record of 6925 on October 30th, 5 days ago.
November and December are historically strong performance months for the US 500, however currently traders are faced with several issues to navigate. Only a week ago the Federal Reserve cast some doubt over whether a rate cut in December would happen or not, with policymakers maintaining this stance in their comments at various events since then. This wasn’t expected and has led to some disappointment for traders which weighed on US 500 sentiment.
Q3 earnings have generally beaten expectations but then valuations were already high to reflect this, leading to some potential fatigue. Trade tensions between the US-China have cooled, but concerns still remain about economic growth in both countries, especially in the US, where a US government shutdown has led to the delay of key data releases such as CPI, retail sales and the all-important Non-farm Payrolls update on the current health of the US labour market, a key factor influencing the decision making of the Fed on potential interest rate cuts.
This means the release of today’s US ADP Private Payrolls data at 1315 GMT and the US ISM Services PMI survey at 1500 GMT could have a bigger influence over the direction of the US 500 moving across the week.
Technical levels and trends may also become increasingly important.
Technical Update: Back to Fibonacci Retracement Support
After reaching a new all-time high of 6925 on October 30th, the US 500 index has corrected by 2.9%, easing short-term overextended upside conditions. This pullback may reflect a healthy pause within a broader uptrend, but the question now appears to be whether this marks the extent of corrective downside moves or is the beginning of a phase of further price weakness.
As the chart below shows, latest declines in the US 500 index have now returned to a potential support zone at 6750/6760, marking the 38.2% Fibonacci retracement of the October 10th to 30th rally and the current level of the Bollinger mid-average. This possible support band may limit current declines, but closing behaviour around this area could be important in determining whether buyers can regain the upper hand or if deeper corrective risks can emerge.
Traders could now be watching this 6750/6760 support closely, as closing break below might see increased downside pressure. Such moves could then mean focus shifts to 6711, even 6661, marking the deeper 50% and 61.8% Fibonacci retracement levels.
That said, while the support is currently under pressure, the 6750/6760 range still holds on a closing basis and may help limit further selling pressure, even possibly see renewed attempts at price upside. However, traders may also now be monitoring 6825, equal to half the recent price decline, as a resistance level in the sessions ahead.
If momentum is to shift back toward attempts to renew price strength, a closing break above 6825 may be required to suggest scope to retest the 6925 October 30th all-time high.
The material provided here has not been prepared accordance with legal requirements designed to promote the independence of investment research and as such is considered to be a marketing communication. Whilst it is not subject to any prohibition on dealing ahead of the dissemination of investment research, we will not seek to take any advantage before providing it to our clients.
Pepperstone doesn’t represent that the material provided here is accurate, current or complete, and therefore shouldn’t be relied upon as such. The information, whether from a third party or not, isn’t to be considered as a recommendation; or an offer to buy or sell; or the solicitation of an offer to buy or sell any security, financial product or instrument; or to participate in any particular trading strategy. It does not take into account readers’ financial situation or investment objectives. We advise any readers of this content to seek their own advice. Without the approval of Pepperstone, reproduction or redistribution of this information isn’t permitted.

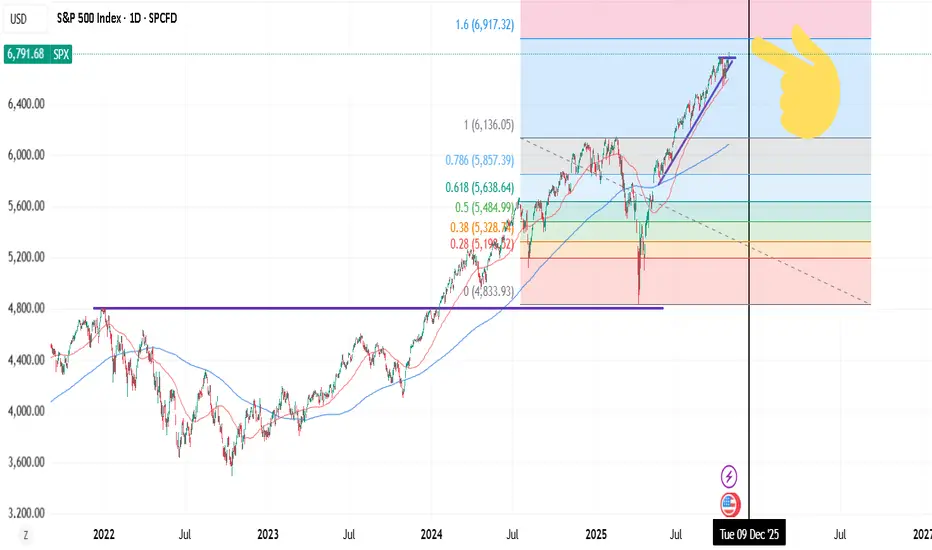
S&P 500: Overheated Valuation vs. SeasonalityAs the S&P 500 posts a Shiller CAPE ratio of 40.24 in early November 2025 — nearly equivalent to the dot-com bubble peak in 2000 (~44) — a key question arises: can the U.S. market still advance during the last two months of the year? History suggests that November and December seasonality often favors bulls, yet economic reality and valuation levels may temper this optimism.
Valuations on the Verge of Overheating
Fundamental indicators speak for themselves. A Shiller P/E around 40 signals extreme overvaluation; the historical average is around 17. The Buffett Indicator, which compares total market capitalization to GDP, exceeds 200% — an all-time high, well above levels seen before the 2000 and 2007 crises. In other words, U.S. equity prices are today largely disconnected from the size of the real economy.
Historical comparisons are striking: the market has only been this expensive on the eve of the tech crash twenty-five years ago. This makes any new bullish episode difficult to justify fundamentally. Yet history also shows that markets can remain overvalued for long periods, especially when liquidity is abundant and investors fear “missing out” on gains.
Seasonality: A Favorable Tailwind at Year-End
Statistically, November and December are the most favorable months for U.S. equities. According to Topdown Charts (1964–2024), November delivers an average return of +1%, positive in 69% of cases, while December rises +1.2% on average, gaining nearly 70% of the time.
Market Paradox: Expensive Yet Bullish?
This coexistence of extreme valuation and seasonal bullish momentum is not unprecedented. In 1999, for instance, the S&P 500 gained over 20% in the six months leading up to its historical peak, even though its CAPE exceeded 40. Investor psychology and flow dynamics often play a more significant role than fundamental reasoning in the short term.
However, such an environment reduces the margin of safety: any macroeconomic shock or earnings disappointment could trigger a sharp correction. History shows that markets can ignore excesses … until the moment they cannot.
Conclusion
The S&P 500 approaches the end of 2025 in a paradoxical situation: supported by historically favorable seasonality but in fundamental weightlessness. November and December could indeed be positive due to bullish inertia, liquidity effects, and collective psychology. Yet at these valuation levels, every additional point of gain also brings the market closer to an inflection point.
DISCLAIMER:
This content is intended for individuals who are familiar with financial markets and instruments and is for information purposes only. The presented idea (including market commentary, market data and observations) is not a work product of any research department of Swissquote or its affiliates. This material is intended to highlight market action and does not constitute investment, legal or tax advice. If you are a retail investor or lack experience in trading complex financial products, it is advisable to seek professional advice from licensed advisor before making any financial decisions.
This content is not intended to manipulate the market or encourage any specific financial behavior.
Swissquote makes no representation or warranty as to the quality, completeness, accuracy, comprehensiveness or non-infringement of such content. The views expressed are those of the consultant and are provided for educational purposes only. Any information provided relating to a product or market should not be construed as recommending an investment strategy or transaction. Past performance is not a guarantee of future results.
Swissquote and its employees and representatives shall in no event be held liable for any damages or losses arising directly or indirectly from decisions made on the basis of this content.
The use of any third-party brands or trademarks is for information only and does not imply endorsement by Swissquote, or that the trademark owner has authorised Swissquote to promote its products or services.
Swissquote is the marketing brand for the activities of Swissquote Bank Ltd (Switzerland) regulated by FINMA, Swissquote Capital Markets Limited regulated by CySEC (Cyprus), Swissquote Bank Europe SA (Luxembourg) regulated by the CSSF, Swissquote Ltd (UK) regulated by the FCA, Swissquote Financial Services (Malta) Ltd regulated by the Malta Financial Services Authority, Swissquote MEA Ltd. (UAE) regulated by the Dubai Financial Services Authority, Swissquote Pte Ltd (Singapore) regulated by the Monetary Authority of Singapore, Swissquote Asia Limited (Hong Kong) licensed by the Hong Kong Securities and Futures Commission (SFC) and Swissquote South Africa (Pty) Ltd supervised by the FSCA.
Products and services of Swissquote are only intended for those permitted to receive them under local law.
All investments carry a degree of risk. The risk of loss in trading or holding financial instruments can be substantial. The value of financial instruments, including but not limited to stocks, bonds, cryptocurrencies, and other assets, can fluctuate both upwards and downwards. There is a significant risk of financial loss when buying, selling, holding, staking, or investing in these instruments. SQBE makes no recommendations regarding any specific investment, transaction, or the use of any particular investment strategy.
CFDs are complex instruments and come with a high risk of losing money rapidly due to leverage. The vast majority of retail client accounts suffer capital losses when trading in CFDs. You should consider whether you understand how CFDs work and whether you can afford to take the high risk of losing your money.
Digital Assets are unregulated in most countries and consumer protection rules may not apply. As highly volatile speculative investments, Digital Assets are not suitable for investors without a high-risk tolerance. Make sure you understand each Digital Asset before you trade.
Cryptocurrencies are not considered legal tender in some jurisdictions and are subject to regulatory uncertainties.
The use of Internet-based systems can involve high risks, including, but not limited to, fraud, cyber-attacks, network and communication failures, as well as identity theft and phishing attacks related to crypto-assets.

Key Pillars of Global Market SuccessKey Pillars of Global Market Success
In the modern interconnected world, success in the global market depends on much more than simply exporting products or services across borders. It involves mastering an ecosystem of strategies, competencies, and adaptability that allows businesses to thrive amid fierce competition, diverse consumer preferences, evolving technology, and changing regulations. Understanding the key pillars of global market success is crucial for any organization that aims to expand internationally, build a sustainable brand, and maintain long-term growth.
Below are the fundamental pillars that support success in the global marketplace.
1. Strong Market Research and Cultural Understanding
Before entering any foreign market, businesses must conduct thorough market research to understand the local culture, consumer behavior, economic environment, and regulatory structure. This goes beyond studying demographics or income levels; it involves understanding cultural nuances, preferences, and purchasing habits.
For instance, a marketing strategy that works in the United States may fail in Japan or India because of differences in communication style, color symbolism, and social norms. Companies like McDonald’s and Coca-Cola have succeeded globally because they localize their products — offering the McPaneer burger in India or tea-based beverages in China.
Effective market research also helps identify:
Consumer trends and unmet needs
Competitor strategies
Pricing expectations
Distribution challenges
Ultimately, cultural intelligence — the ability to adapt to local customs while maintaining a global identity — is one of the strongest foundations for global market success.
2. Product Innovation and Adaptability
Innovation is the lifeblood of global competitiveness. Successful global companies are those that continuously innovate to meet diverse consumer demands and rapidly changing technologies.
However, innovation must be combined with adaptability. A product that dominates one region may need to be redesigned for another. For example, automobile manufacturers often modify car designs for local road conditions, fuel quality, and climate. Similarly, software companies translate and localize their user interfaces for different languages and legal frameworks.
The key is to build a balance between standardization and customization. Standardization offers economies of scale and a unified brand identity, while customization ensures relevance in local markets.
Innovative adaptability also includes:
Sustainable product design
Integration of digital technologies
Customer-centric product development
Innovation and adaptability ensure that companies remain competitive, responsive, and resilient to global shifts in demand.
3. Effective Global Strategy and Vision
Every successful international business is built upon a clear strategic vision. This vision outlines why the company is expanding globally, where it intends to grow, and how it plans to achieve that growth.
A global strategy must align with the company’s core competencies while considering:
Market entry modes (exporting, franchising, joint ventures, acquisitions)
Localization vs. standardization decisions
Long-term investment and operational models
Supply chain and logistics networks
For instance, companies like Apple and Toyota have achieved success because of their well-defined global strategies that focus on efficiency, innovation, and customer experience.
Strategic clarity allows companies to avoid costly mistakes — such as entering markets without understanding local regulations or underestimating cultural resistance. It ensures that every move supports the company’s broader vision of global growth and brand leadership.
4. Strong Brand Identity and Reputation
A strong brand transcends borders. Global market success depends heavily on how consumers perceive and trust a brand. Reputation, once built, becomes a key competitive advantage that drives loyalty and market expansion.
Companies that consistently deliver quality, ethical practices, and transparency earn the trust of global customers. Apple, Nike, and Samsung are examples of brands that represent innovation, quality, and status — values that resonate worldwide.
Brand success in the global market also depends on:
Consistent brand messaging across cultures
Localized marketing campaigns that reflect local values
Corporate social responsibility (CSR) initiatives that enhance goodwill
Emotional connection through storytelling and authenticity
A powerful global brand acts as a bridge across cultures and markets, allowing companies to command premium prices and sustain long-term relationships.
5. Efficient Supply Chain and Operations Management
Operational efficiency and a resilient supply chain are vital for global competitiveness. The ability to source materials globally, manufacture efficiently, and deliver products on time defines a company’s success in international markets.
A robust supply chain ensures:
Cost optimization through global sourcing
Speed and flexibility in responding to market changes
Risk mitigation against disruptions such as geopolitical tensions or pandemics
Technological integration — such as blockchain for transparency or AI for demand forecasting — has revolutionized global supply chain management.
Companies like Amazon and Unilever have mastered this pillar by building logistics networks that span continents, supported by data analytics and automation. These efficiencies not only improve profitability but also enhance customer satisfaction and competitiveness.
6. Financial Strength and Risk Management
Global expansion requires significant financial resources. Success depends not only on investment capacity but also on the ability to manage risks such as currency fluctuations, inflation, political instability, and trade policy changes.
Companies must establish:
Hedging strategies for currency and interest rate volatility
Diversified revenue streams to offset regional downturns
Robust financial planning for taxation, compliance, and cost management
Financial resilience allows businesses to withstand global shocks, like the COVID-19 pandemic or trade wars, while continuing operations and maintaining investor confidence.
Additionally, access to global financing options — such as international bonds, venture capital, and foreign direct investments (FDIs) — strengthens a company’s ability to scale operations and explore new markets.
7. Talent Management and Cross-Cultural Leadership
Human capital is one of the most valuable assets in global success. Managing a diverse, cross-cultural workforce requires leadership that understands different values, work ethics, and communication styles.
Successful global firms emphasize:
Cross-cultural training for employees
Inclusive leadership that values diversity
Decentralized decision-making for regional responsiveness
Talent mobility programs to develop global leaders
For example, multinational companies like Google and IBM encourage internal global mobility, allowing employees to experience different cultures and bring innovative ideas to their roles.
Building global teams also enhances creativity, problem-solving, and adaptability — qualities essential for sustained success in international markets.
8. Technology Integration and Digital Transformation
Digital transformation is no longer optional; it is the backbone of modern global business success. Companies that leverage technology for marketing, operations, analytics, and customer engagement gain a massive advantage.
Key technological enablers include:
Artificial Intelligence (AI) for predictive analytics and automation
Big Data for consumer insight and personalized marketing
Cloud computing for scalable operations
E-commerce platforms for global reach
Digitalization allows even small and medium enterprises (SMEs) to compete internationally without the need for large physical infrastructure.
For instance, Shopify and Alibaba have enabled countless businesses to access global markets through online stores, while advanced logistics and digital payment systems simplify global trade transactions.
Thus, technology acts as both a driver of innovation and an equalizer that lowers barriers to global market entry.
9. Legal and Ethical Compliance
Operating globally requires strict adherence to international laws, trade agreements, and ethical standards. Failure to comply can lead to heavy penalties, brand damage, or even market bans.
Key compliance areas include:
Trade regulations and import/export duties
Data protection and privacy laws (e.g., GDPR in Europe)
Environmental sustainability standards
Anti-corruption and fair competition laws
Ethical conduct, corporate transparency, and sustainability practices are now essential for brand reputation and investor trust. Companies that integrate Environmental, Social, and Governance (ESG) principles attract more customers and long-term investors.
A responsible global business does not merely chase profit; it contributes to global well-being and sustainable development.
10. Customer-Centric Approach and Relationship Building
At the heart of global market success lies one universal truth — the customer is king. Businesses that place customers at the center of their strategy are more likely to succeed globally.
This involves:
Listening to customer feedback from diverse markets
Offering localized support and services
Using data analytics to personalize offerings
Building long-term trust rather than focusing solely on short-term sales
Companies like Amazon, Netflix, and Starbucks excel because they continuously adapt their customer experience using data-driven insights. A strong customer relationship not only drives loyalty but also builds powerful word-of-mouth reputation in new markets.
11. Sustainability and Social Responsibility
Modern consumers, investors, and regulators increasingly expect businesses to operate sustainably. Environmental and social responsibility is no longer a marketing choice but a business imperative.
Sustainability includes:
Reducing carbon footprint and waste
Ethical sourcing of raw materials
Supporting community development
Transparent ESG reporting
Brands that align their operations with global sustainability goals (like the UN Sustainable Development Goals) not only attract conscious consumers but also secure long-term stability by reducing regulatory risks.
Companies like Tesla, Patagonia, and Unilever have demonstrated how sustainability can be integrated into the business model while maintaining profitability.
12. Continuous Learning and Adaptation
The global market is dynamic — what works today may not work tomorrow. Continuous learning, innovation, and adaptation are the final and most enduring pillars of success.
Businesses must stay alert to:
Technological disruptions (AI, automation, blockchain)
Changing trade policies and tariffs
Evolving consumer expectations
Economic and geopolitical shifts
Agile companies that embrace change, experiment, and learn from failures can sustain success in the ever-evolving global landscape.
Conclusion
Global market success is not built overnight. It requires a combination of strategic clarity, cultural understanding, innovation, and resilience. The twelve pillars discussed above — from research and adaptability to sustainability and learning — form an integrated framework that helps businesses expand internationally while maintaining a strong competitive edge.
The global marketplace rewards those who can balance local relevance with global vision. Companies that invest in people, technology, ethics, and innovation not only achieve profitability but also become agents of positive global change.
In essence, the true measure of global market success lies in creating lasting value — for customers, employees, communities, and the planet — while navigating an ever-changing world with agility and integrity.


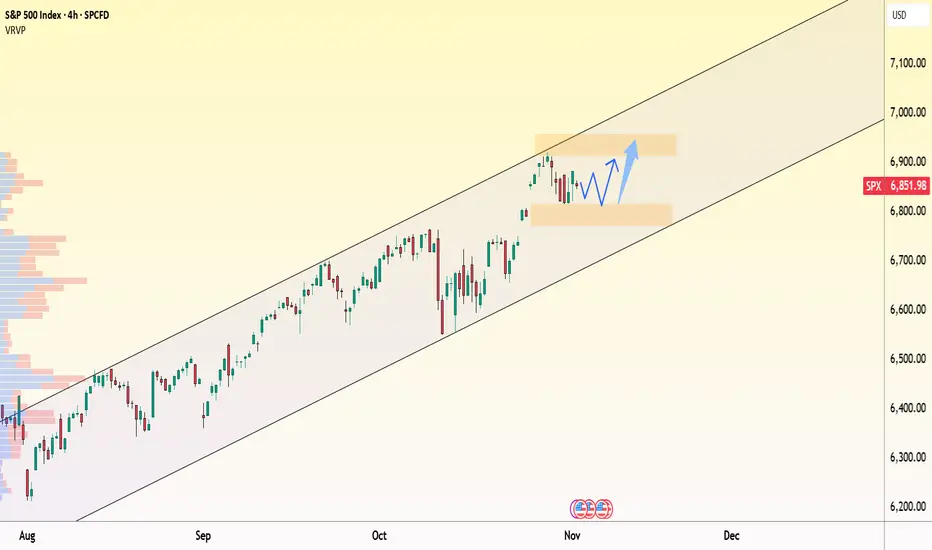
SPX:uptrend remains intact – consolidating for the next breakoutOn the 4-hour chart, the S&P 500 (SPX) continues to move firmly within its ascending channel , with the current range around 6,850–6,900 representing a healthy pause after a strong rally. The nearest support sits at 6,800, where buyers previously stepped in, while short-term resistance remains near 6,900.
From a news perspective, the rally is still being driven by tech and AI sectors , especially after the Amazon–OpenAI partnership deal , which reignited positive sentiment across the market. However, investors remain cautious ahead of upcoming U.S. ADP employment and ISM PMI data , which could influence the Fed’s next rate-cut decision.
Overall, the technical structure still supports an upward bias: SPX is consolidating between 6,800–6,900 before potentially breaking toward the 7,000-point zone , aligning with the upper boundary of the trend channel.
As long as the 6,800 support holds, the market retains room for another bullish leg in the sessions ahead, backed by renewed capital inflows into leading sectors.
NQ / Future'sToday’s price action was a clear example of structural breakdown. The clues started forming about a week ago and began to solidify by Monday morning, with confirmation coming early Tuesday. It’s simple — once you understand market structure, you can avoid bad entries and emotional trades. I alerted everyone ahead of time not to go long and outlined the most likely scenario, which played out exactly as expected. You had clue's from bitcoin, you had clue's from SPX. Everybody becomes suprised when the market rips and or drops but you have the answers in front of you 24/7, literally.
S&P500 Possibly the last buy signal before Bull Cycle ends.The S&P500 index (SPX) has been trading within a 5-month Channel Up and is currently about to complete its latest Bearish Leg. All such pull-back sequences have reached at least the 4H MA200 (orange trend-line) before rebounding and kick-starting the next Bullish Leg, with the 1D MA50 (red trend-line) providing the ultimate Support of this pattern.
As a result, especially since the 4H RSI also hit the 30.00 oversold barrier, we expect the index to initiate the new Bullish Leg and aim for a Higher High near the 2.5 Fibonacci extension. Our Target is 7150.
-------------------------------------------------------------------------------
** Please LIKE 👍, FOLLOW ✅, SHARE 🙌 and COMMENT ✍ if you enjoy this idea! Also share your ideas and charts in the comments section below! This is best way to keep it relevant, support us, keep the content here free and allow the idea to reach as many people as possible. **
-------------------------------------------------------------------------------
💸💸💸💸💸💸
👇 👇 👇 👇 👇 👇

SPX | Daily Analysis #11 - 4 November 2025Hello and Welcome back to DP
Review and News Coverage:
As mentioned in the previous daily analysis, the market saw a nice decline — even breaking through the 6811 area and reaching down to 6766. There wasn’t any major news driving the move; it seems the market simply took a breather to gather strength for the next potential rally.
Now that the past move is complete, our focus shifts forward. Tomorrow brings key economic events — NFP (Non-Farm Payrolls) and PMI data — both of which are likely to bring significant volatility to the market.
1H Time Frame Technical Analysis:
At the moment, this bull run could face resistance around the 6826 area. From there, a short-term correction toward the 6800 zone is possible (6811 is no longer relevant).
Personally, I believe the recent downside move has finished, and we should now start looking for buy opportunities. If the price retraces and holds above 6800, it could open the door for long entries and a continuation of the bullish move.
Summary:
• Resistance: 6826
• Support: 6800
• Bias: Bullish (Buy on dips)
• Key Events Tomorrow: NFP & PMI — expect high volatility
Disclaimer:
This content is for informational purposes only and does not constitute financial or investment advice. © DIBAPRISM
Amir D.Kohn

Maximum profit: Top 5 indices of OctoberIn October, client activity peaked around #SP500, #NQ100, #DAX30, #FTSE100, and #NIKKEI . These five indices not only showed the highest share of profitable trades but also delivered the best returns across all index instruments. Strong corporate earnings, steady demand, and a positive news backdrop continue to support their growth potential.
Growth outlook for key indices through the end of 2025:
• #SP500: New record highs, solid earnings from major players, and expectations of a Fed rate cut support buying the dip with moderate risk.
• #NQ100: Tech demand remains strong as firms invest in data centers and AI infrastructure. If earnings stay on track, there’s still room to grow.
• #DAX30: After hitting new all-time highs in 2025, the German index benefits from improved global trade sentiment and stable EU data. Exporters thrive on robust external demand.
• #FTSE100: The UK market remains near its highs, supported by strong performance in key sectors and commodities. Year-end liquidity may further reinforce the uptrend.
• #NIKKEI: Japan’s index keeps climbing, helped by a weak yen boosting exports and a predictable monetary environment. Further gains are possible if global conditions remain calm.
FreshForex analysts believe short-term index performance hinges on three main factors: current earnings season results, inflation trends, and central bank decisions. Risk management and awareness of the macro calendar remain essential.

1.6 FIB Ceiling - Stock market correction soon in NOV/DEC.You can apply 1.6 FIB to FAANG or QQQ for high probability ceilings. VIX "structure" (pattern) or setup also indicates it. Stocks forming a sharp "wedge drop", extension from 50dma.
Bullish near term (probably?), correction in NOV/DEC.
I wonder if the first 5 (monthly) trading days in NOV are not volatile AF. 😂
SPX into the open 4th NovemberPossible support areas marked
Resistance...Not really clear
Will it get bought.?
S&P500 pullback reaching pivotal zone at 6748The S&P 500 (+0.17%) eked out a small gain yesterday, but market breadth remained weak. The Magnificent 7 (+1.18%) continued to drive performance while the S&P 500 ex-Mag 7 (-0.30%) and equal-weighted index (-0.30%) both declined, highlighting the narrow leadership.
The main positive driver came from another AI-related deal—Amazon’s partnership with OpenAI, which boosted sentiment in large-cap tech. However, overall momentum was capped by soft economic data, hawkish Fed commentary, and concerns around a prolonged U.S. government shutdown, now matching the longest on record and set to surpass it by midnight.
Overnight sentiment turned weaker, with Palantir (-4% after hours) dragging tech sentiment lower after offering limited 2026 guidance despite solid results. Nasdaq and S&P futures are down -0.85% and -0.59%, respectively, and Asian markets are mostly lower, adding to the cautious tone.
Today’s focus:
Earnings: A busy session with results from AMD, Shopify, Uber, Pfizer, BP, and others, likely to shape sector moves.
Politics: U.S. state elections (New York mayoral, New Jersey and Virginia gubernatorial races) could test political sentiment but are unlikely to have major near-term market impact.
Outlook: Expect a softer start for the S&P 500 as tech momentum fades and macro uncertainty persists, with investor focus shifting to corporate earnings and central bank commentary for direction.
Key Support and Resistance Levels
Resistance Level 1: 6830
Resistance Level 2: 6857
Resistance Level 3: 6880
Support Level 1: 6748
Support Level 2: 6727
Support Level 3: 6707
This communication is for informational purposes only and should not be viewed as any form of recommendation as to a particular course of action or as investment advice. It is not intended as an offer or solicitation for the purchase or sale of any financial instrument or as an official confirmation of any transaction. Opinions, estimates and assumptions expressed herein are made as of the date of this communication and are subject to change without notice. This communication has been prepared based upon information, including market prices, data and other information, believed to be reliable; however, Trade Nation does not warrant its completeness or accuracy. All market prices and market data contained in or attached to this communication are indicative and subject to change without notice.

SPX500 | Futures Steady Near Highs, Key Level 6,877 in FocusSPX500 – MARKET OUTLOOK | Futures Edge Higher as Earnings Season Heats Up 🇺🇸
U.S. stock futures inched higher on the first trading day of the month, as traders focus on a busy week of earnings across major sectors.
🔽 Below 6,877: Bearish momentum toward 6,842 → 6,800 → 6,770.
🔼 Above 6,888: Bullish reversal toward 6,918 → 6,941.
Pivot: 6,877
Support: 6,843 · 6,800 · 6,770
Resistance: 6,918 · 6,941
SPX500 remains bearish while below 6,877, though earnings results could trigger short-term volatility or a potential breakout.

S&P Daily ChartDaily chart S&P With trend lines and view for near future trading where to expect the Low

S&P 500 Bulls Back in Control – New All-Time High Ahead?As I expected in my previous idea , the S&P 500 index( SP:SPX ) pulled back from its Resistance lines and hit its target.
Right now, the S&P 500 index is in the process of breaking through a Resistance zone($6,894_$6,859). Just a few hours ago, it successfully broke above the upper line of a descending channel , which is a positive sign for a renewed upward move .
From an Elliott Wave perspective, it seems that the S&P 500 index has completed its main wave four, and after breaking this Resistance zone($6,894_$6,859) , we can anticipate the start of a main wave 5 .
I expect that once the S&P 500 index breaks through this Resistance zone($6,894_$6,859) , it will likely climb at least up to the next Resistance lines and the Potential Reversal Zone (PRZ) .
Note: The cryptocurrency market, and especially Bitcoin( BINANCE:BTCUSDT ), has been highly correlated with the S&P 500 index these weeks.
Please respect each other's ideas and express them politely if you agree or disagree.
S&P 500 Index Analyze (SPX500USD), 1-hour time frame.
Be sure to follow the updated ideas.
Do not forget to put a Stop loss for your positions (For every position you want to open).
Please follow your strategy and updates; this is just my Idea, and I will gladly see your ideas in this post.
Please do not forget the ✅' like '✅ button 🙏😊 & Share it with your friends; thanks, and Trade safe.


SPX updated for 4th NovemeberComing into a support area 6750-6780
Will that hold.?
Lets see what happens

Upcoming End of the Shutdown & Market LiquidityThe end of a U.S. government shutdown is often interpreted as a mere political signal. Yet, from a financial perspective, this event can mark a major turning point for global liquidity. One of the most direct mechanisms through which this occurs is the Treasury General Account (TGA) — the U.S. Treasury’s main account at the Federal Reserve (Fed).
1) The TGA: a true liquidity reservoir
The TGA functions as the federal government’s current account.
When it receives revenues (taxes, bond issuance, etc.), funds are deposited there. When it spends — salaries, contractor payments, social programs — those amounts leave the TGA and flow toward commercial banks and households.
Each dollar spent by the Treasury exits the Fed and enters the private sector, increasing bank reserves and overall financial system liquidity.
Conversely, when the Treasury issues bonds and collects money from investors, bank reserves decline since those funds are transferred into the TGA.
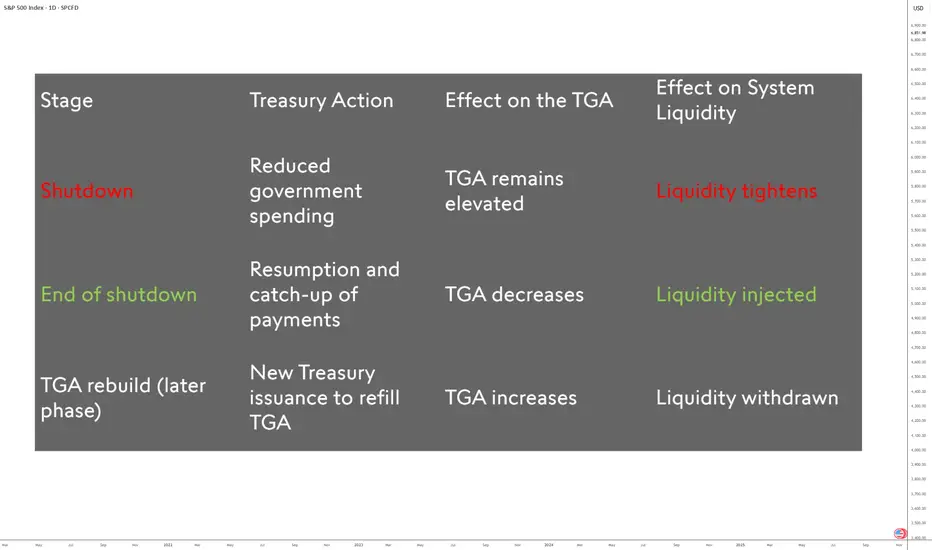
2) Shutdown: a period of silent contraction
During a shutdown, the government is largely paralyzed. Many payments are suspended or delayed, reducing cash outflows.
As a result, the TGA drains much more slowly, and available liquidity in the financial system decreases. It is worth noting that the TGA had just finished refilling in early October — exactly at the onset of the shutdown.
3) The end of the shutdown: a sharp reinjection
As soon as the shutdown ends, the U.S. Treasury must catch up on deferred spending — wages, contracts, and federal programs.
These large disbursements cause a rapid decline in the TGA, equivalent to a direct injection of liquidity into the economy.
Bank reserves increase mechanically, repo rates may ease, and risk assets — equities, high-yield bonds, crypto-assets — often experience a short-term rebound.
This liquidity surge is not sustainable: once payments are settled, the Treasury usually reissues debt to rebuild the TGA to its target level. This reverse phase then withdraws the excess liquidity from the market.
In the short term, however, the end of a shutdown acts as a positive liquidity pump, capable of influencing the trend of risk assets on financial markets.
DISCLAIMER:
This content is intended for individuals who are familiar with financial markets and instruments and is for information purposes only. The presented idea (including market commentary, market data and observations) is not a work product of any research department of Swissquote or its affiliates. This material is intended to highlight market action and does not constitute investment, legal or tax advice. If you are a retail investor or lack experience in trading complex financial products, it is advisable to seek professional advice from licensed advisor before making any financial decisions.
This content is not intended to manipulate the market or encourage any specific financial behavior.
Swissquote makes no representation or warranty as to the quality, completeness, accuracy, comprehensiveness or non-infringement of such content. The views expressed are those of the consultant and are provided for educational purposes only. Any information provided relating to a product or market should not be construed as recommending an investment strategy or transaction. Past performance is not a guarantee of future results.
Swissquote and its employees and representatives shall in no event be held liable for any damages or losses arising directly or indirectly from decisions made on the basis of this content.
The use of any third-party brands or trademarks is for information only and does not imply endorsement by Swissquote, or that the trademark owner has authorised Swissquote to promote its products or services.
Swissquote is the marketing brand for the activities of Swissquote Bank Ltd (Switzerland) regulated by FINMA, Swissquote Capital Markets Limited regulated by CySEC (Cyprus), Swissquote Bank Europe SA (Luxembourg) regulated by the CSSF, Swissquote Ltd (UK) regulated by the FCA, Swissquote Financial Services (Malta) Ltd regulated by the Malta Financial Services Authority, Swissquote MEA Ltd. (UAE) regulated by the Dubai Financial Services Authority, Swissquote Pte Ltd (Singapore) regulated by the Monetary Authority of Singapore, Swissquote Asia Limited (Hong Kong) licensed by the Hong Kong Securities and Futures Commission (SFC) and Swissquote South Africa (Pty) Ltd supervised by the FSCA.
Products and services of Swissquote are only intended for those permitted to receive them under local law.
All investments carry a degree of risk. The risk of loss in trading or holding financial instruments can be substantial. The value of financial instruments, including but not limited to stocks, bonds, cryptocurrencies, and other assets, can fluctuate both upwards and downwards. There is a significant risk of financial loss when buying, selling, holding, staking, or investing in these instruments. SQBE makes no recommendations regarding any specific investment, transaction, or the use of any particular investment strategy.
CFDs are complex instruments and come with a high risk of losing money rapidly due to leverage. The vast majority of retail client accounts suffer capital losses when trading in CFDs. You should consider whether you understand how CFDs work and whether you can afford to take the high risk of losing your money.
Digital Assets are unregulated in most countries and consumer protection rules may not apply. As highly volatile speculative investments, Digital Assets are not suitable for investors without a high-risk tolerance. Make sure you understand each Digital Asset before you trade.
Cryptocurrencies are not considered legal tender in some jurisdictions and are subject to regulatory uncertainties.
The use of Internet-based systems can involve high risks, including, but not limited to, fraud, cyber-attacks, network and communication failures, as well as identity theft and phishing attacks related to crypto-assets.
Risks and Opportunities in the Global Market1. Introduction: The Global Market Landscape
The global market is a dynamic system where goods, services, and capital flow freely across national borders. This system thrives on globalization — the process of increasing interdependence among nations through trade, investment, technology, and finance. Over the last few decades, international trade agreements, technological advancements, and digital transformation have made global markets more accessible.
However, with this increased connectivity comes vulnerability. A crisis in one country can ripple across continents, as seen during the 2008 financial crisis or the COVID-19 pandemic. Thus, participants in the global market must constantly balance risk management and opportunity recognition.
2. Major Risks in the Global Market
a. Economic and Financial Risks
Economic fluctuations, inflation, and interest rate volatility are among the biggest risks in the global market. For instance, a sudden rise in U.S. interest rates can trigger capital outflows from emerging markets, leading to currency depreciation and financial instability.
Global recessions or slowdowns also reduce demand for exports, affecting developing economies reliant on trade. Moreover, the interconnected nature of financial markets means that a crisis in one major economy often spreads rapidly worldwide.
b. Geopolitical Risks
Political instability, trade wars, sanctions, and conflicts can disrupt global supply chains and impact investor sentiment. Recent examples include the Russia-Ukraine war and tensions in the Middle East, both of which caused oil price volatility and uncertainty in global energy markets.
Geopolitical risks can also lead to protectionism — where countries impose tariffs or restrict trade to protect domestic industries, slowing global commerce and increasing costs.
c. Currency and Exchange Rate Risks
In global business, currency fluctuations can significantly affect profits. When a company operates across multiple countries, it earns revenue in different currencies. If one currency weakens, it can reduce the company’s overall earnings when converted back to the home currency.
For instance, exporters from Japan or Europe often face profit declines when their local currency strengthens against the U.S. dollar. Managing this risk often requires complex hedging strategies.
d. Supply Chain Disruptions
Global supply chains have become more fragile due to over-dependence on certain regions for manufacturing and raw materials. Events like natural disasters, pandemics, or geopolitical tensions can halt production and raise costs. The COVID-19 pandemic exposed how vulnerable global supply networks are, leading many companies to rethink their sourcing strategies and focus on supply chain diversification.
e. Technological and Cybersecurity Risks
While technology drives globalization, it also introduces cyber threats and data privacy issues. Hackers and cybercriminals target multinational companies, leading to financial losses and reputational damage.
Moreover, as automation and artificial intelligence (AI) reshape industries, there’s a risk of job displacement and unequal technological adoption between countries, which can widen global inequality.
f. Environmental and Regulatory Risks
Climate change and environmental degradation are becoming major global concerns. Governments worldwide are enforcing stricter environmental laws and carbon regulations. Businesses that fail to adopt sustainable practices face penalties, reputational harm, or exclusion from eco-conscious markets.
At the same time, frequent natural disasters and changing weather patterns threaten agricultural output, infrastructure, and supply stability.
3. Key Opportunities in the Global Market
a. Expansion of Emerging Markets
Emerging economies like India, Indonesia, Vietnam, and several African nations are projected to lead global growth in the coming decades. These regions have young populations, expanding middle classes, and growing consumer demand.
For investors and multinational companies, emerging markets offer new avenues for trade, infrastructure development, and technology adoption. Global brands can tap into these markets by offering affordable, localized products and services.
b. Technological Innovation and Digital Transformation
Digital technologies — from AI to blockchain and 5G — are revolutionizing how businesses operate globally. E-commerce, fintech, and cloud computing have reduced entry barriers for small and medium enterprises (SMEs) to reach international customers.
Companies that embrace digital transformation gain efficiency, lower costs, and can compete globally. Moreover, digital finance and cryptocurrencies are opening new frontiers for cross-border transactions.
c. Sustainability and Green Investments
The global shift toward sustainability presents enormous opportunities. Clean energy, electric vehicles, and carbon-neutral products are attracting massive investment. Governments and institutions are pushing for green finance and environmental, social, and governance (ESG) compliance.
Investors who focus on sustainable assets are likely to benefit as the world transitions to a low-carbon economy. This creates new markets in renewable energy, waste management, and sustainable agriculture.
d. Diversification and Strategic Alliances
Globalization allows companies to diversify their production, investment, and sourcing strategies. Instead of depending on a single region, businesses can build strategic alliances and joint ventures across countries.
For example, technology partnerships between Western and Asian firms allow access to new technologies and talent pools, enhancing innovation and competitiveness.
e. Global Talent and Knowledge Sharing
The digital era has made it possible for organizations to tap into global talent pools. Remote work and cross-border collaboration have become common, allowing firms to recruit the best minds from anywhere in the world.
Knowledge sharing across borders fosters innovation, research, and cultural exchange, enriching global productivity and creativity.
f. Rising Global Consumer Base
The global middle class is expanding rapidly — especially in Asia and Africa. This surge in purchasing power offers companies a vast consumer market. Industries like e-commerce, entertainment, finance, and healthcare are seeing strong growth due to changing lifestyles and increasing digital adoption.
4. Balancing Risks and Opportunities
To succeed in the global market, companies and investors must skillfully balance risk management with opportunity pursuit.
Some effective strategies include:
Diversification: Investing across countries, sectors, and currencies to reduce exposure to regional risks.
Hedging: Using financial instruments like futures, options, and swaps to mitigate currency and interest rate risks.
Scenario Planning: Preparing for multiple future possibilities by forecasting economic, political, and technological shifts.
Sustainability Integration: Adopting green practices not only reduces risk but also attracts conscious investors and customers.
Agile Operations: Building flexible supply chains and digital infrastructure to adapt quickly to global disruptions.
5. Conclusion
The global market is a double-edged sword — filled with unprecedented opportunities but also heightened risks. Businesses that understand this balance and adapt proactively are best positioned to thrive.
While risks such as economic volatility, geopolitical conflicts, and regulatory challenges cannot be fully eliminated, they can be managed through strategic planning and diversification.
At the same time, opportunities arising from digital transformation, sustainability, and emerging markets provide pathways to long-term growth and profitability.
In the evolving global landscape, success will depend not just on expansion but on resilience, adaptability, and foresight — the ability to navigate uncertainty while seizing the immense potential the global market offers.

S&P 500 Technical & Fundamental Outlook — Week of Nov 3–7, 2025🧭 S&P 500 Technical & Fundamental Outlook — Week of Nov 3–7, 2025
Chart View:
Price is consolidating between 6,815 support and 6,921–6,940 resistance, holding just above the major ascending trend line from October.
This area marks a critical inflection: will buyers defend the trend, or will we finally break structure?
📊 Technical Breakdown
Primary Trend: Uptrend intact while above trend line support.
Key Support Zone: 6,800 – 6,815 (buyers last defended strongly).
Major Breakdown Level: Below 6,656 opens the door to 6,550 and new lower lows.
Resistance Zone: 6,921 – 6,940 (previous swing high & supply area).
Bias: Neutral-to-bullish while above 6,815; bearish momentum accelerates under 6,656.
🟢 Bullish Path: Use the trend line as a launchpad to retest 6,921+.
🔴 Bearish Path: Break and close below 6,815 → target 6,656 then 6,550.
🗓 Macro Calendar – Key Events to Watch
Mon (Nov 3) – ISM Manufacturing PMI (48.7 vs 49.4 prior)
→ Soft manufacturing data keeps Fed-cut expectations alive.
Tue (Nov 4) – ECB President Lagarde speaks (2 appearances)
→ Watch EUR/USD volatility; global equity tone may shift if dovish.
Wed (Nov 5) – ADP Employment (+31K expected after –32K prior); ISM Services PMI (50.7 exp)
→ Jobs rebound or slowdown will steer rate-cut bets and risk appetite.
Thu (Nov 6) – Bank of England rate decision (4.00% expected hold) + Governor Bailey speech; FOMC Member Waller speaks (2:30 PM ET)
→ Cross-market rate tone could affect bond yields → equity valuations.
Fri (Nov 7) – U.S. Non-Farm Payrolls + Unemployment + UoM Sentiment (53.0 exp)
→ This is the week’s main volatility catalyst. Strong jobs = hawkish pressure; weak jobs = bullish equities.
💬 Market Sentiment & Headlines
AI Mania Continues: Amazon hit a record after a $38 B OpenAI deal via AWS, fueling tech momentum.
Earnings Strength: 80% of S&P companies beat Q3 estimates; megacap tech remains the driver.
Breadth Concerns: 300+ S&P names closed red Monday — showing the rally is narrow and fragile.
Other Corporate Moves: Kimberly-Clark to acquire Kenvue ($48.7 B), Starbucks China JV announcement.
Macro Backdrop: Investors await clarity on Fed policy path and global rate decisions amid softening manufacturing data.
🧩 Trader’s Take
This week is all about trend-line defense vs breakdown.
Stay flexible:
Above 6,815 → trend continuation bias.
Below 6,656 → prepare for deeper retracement toward 6,550.
Macro data + AI headlines are creating a push-pull market: tech buoyancy vs broader weakness.
📅 Watch the reaction during ISM & NFP — these will likely decide direction for mid-November.
#SPX #SP500 #Futures #TradingView #PriceAction #Fundamentals #TechnicalAnalysis #StockMarket #AIStocks #MacroWeek #NFP #ISM #Fed #Equities #Amazon #OpenAI #NASDAQ #SPX500

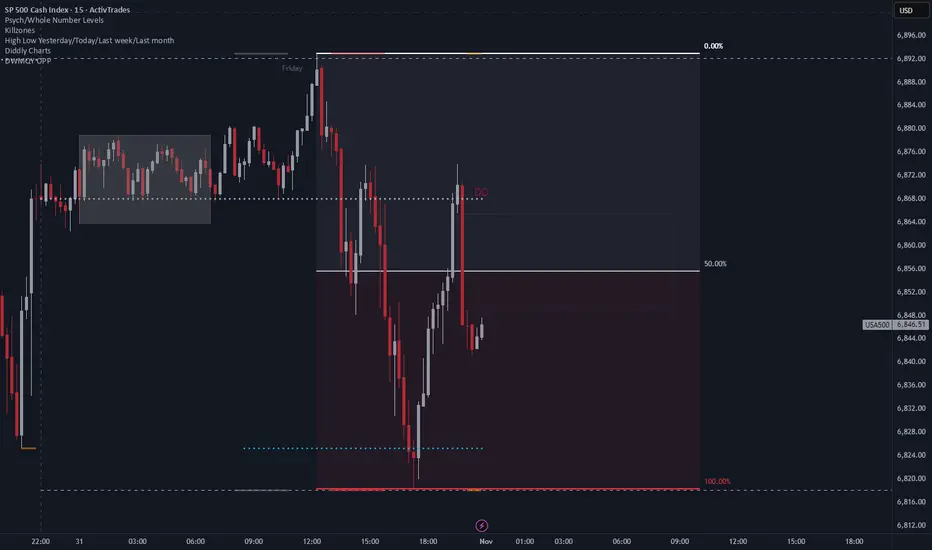
Intraday Range Expansion and Potential Repricing on the SPXFollowing a clean sweep of Friday’s high, price delivered a strong displacement to the downside, breaking short-term structure and rebalancing inefficiencies left behind. The subsequent rebound towards the daily open suggests a retracement into a premium area, potentially setting up for continuation lower if rejection holds around that zone.
If buyers fail to sustain price above the daily open, the market could aim for a full range fill back toward the previous low or discount zones below, maintaining the current bearish intraday order flow.