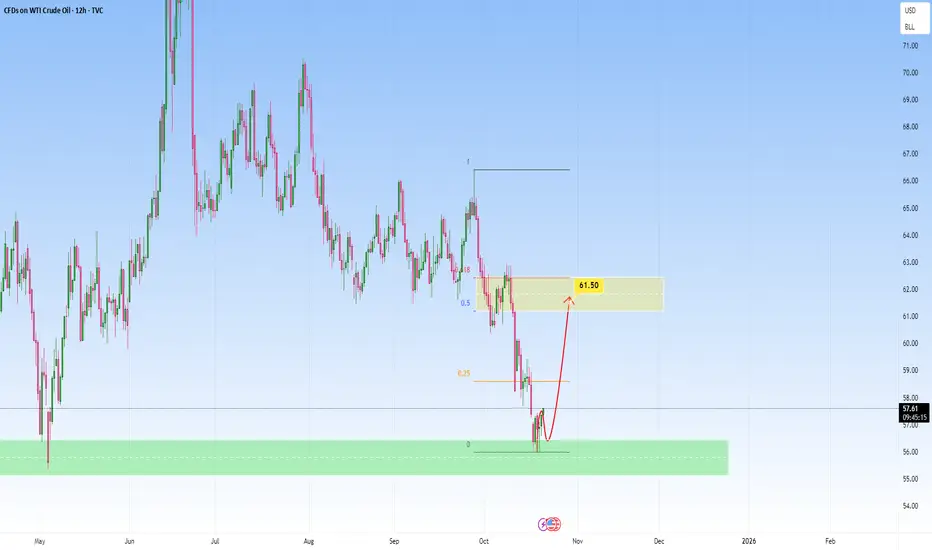
Oil: Key Fibonacci Zone to watch forPrice has been in a clear downtrend, with sellers firmly in control, driving a series of lower lows and lower highs. However, after a strong bearish leg, momentum began to slow, candles started showing long wicks and smaller bodies, signaling that selling pressure might be fading.
If price continues upward, the $61.50 region becomes a crucial zone. A strong rejection from there would confirm that sellers are reloading for another push down.
In short, this is a Fibonacci retracement move within a broader downtrend.
Trade ideas
Crude oil shows an optimistic upward trend📈The situation of crude oil is relatively optimistic, showing an upward trend, mainly affected by geopolitics and supply-demand relationships.
💡Geopolitical factors:
The United States has imposed sanctions on Russian oil companies, and the European Union's sanctions against Russia are also continuing. At the same time, the news that the United States intends to take military action against Venezuela has fermented, triggering market concerns about disruptions in crude oil supply and boosting oil prices.
💡Supply-demand factors:
On the one hand, OPEC announced at a new round of meetings that it would continue to increase production by 137,000 barrels, but the scale of production increase is relatively small, and the production increase capacity of some oil-producing countries is limited, which alleviates the pressure of oversupply. On the other hand, as of October 17th, the EIA crude oil inventory data decreased by 960,000 barrels, the gasoline inventory decreased by 21.05 million barrels per day, and the distillate oil inventory decreased by 1.48 million barrels per day. The decrease in inventory has provided some support for oil prices. However, the weakness of the global economy has made the long-term demand outlook bleak, which has suppressed the increase in oil prices to a certain extent.
💡Technical analysis:
From the daily line level, the daily K-line shows a trend of breaking below the previous low point and then recovering, and the weekly K-line forms a rising sun pattern, indicating that there is a possibility of continued rebound in prices in the short term. At the same time, the medium-term indicator MACD supports an upward trend, also indicating that the short-term trend is upward.
💎Trading Strategy:
Buy 60 SL 61.5 TP 59
Daily-updated accurate signals are at your disposal. If you run into any problems while trading, these signals serve as a reliable reference—don’t hesitate to use them! I truly hope they bring you significant assistance

WTI bullish swing setupRSI divergence
Bullish chart pattern
Wait for trend reversal
red line is previous major level
Entry on trend reversal
RRR 1:2

Possible long position.A bulish wave can continue and push price higher and higher.
so a possible long position is already for me.
USOIL WTIthe current price of WTI crude oil (USOIL) stands around $62.050 to $62.31 per barrel, reflecting a recent rise of about 4.97% compared to previous days. The market has experienced volatility driven by geopolitical tensions and US sanctions on major Russian oil companies, which impact global supply dynamics.
Key Factors Affecting USOIL and Oil Trade Policies
Geopolitical Influences and Sanctions:
US sanctions on Russian oil firms such as Rosneft and Lukoil continue to tighten global supply access, especially affecting supply to large importers like China and India. These sanctions heighten supply-side risks and contribute to price volatility.
US Oil Production and Domestic Policies:
The US remains one of the top global oil producers, with policies encouraging increased output (“drill, baby, drill” style) to ensure energy security and moderate prices domestically while using energy exports as geopolitical leverage.
Trade Agreements and Tariffs:
Trade discussions, such as US-India negotiations, aim to reduce tariffs and expand energy trade, influencing crude demand and pricing. Tariffs and trade restrictions remain important policy tools that may alter trade flows and market access.
OPEC and IEA Production Forecasts:
Global supply forecasts have been revised upward, with expectations of growth to 106-108 million barrels per day by 2026. OPEC production strategies continue to influence market balance and price direction.
Market Volatility and Demand Outlook:
Economic uncertainties, inflation concerns, and shifts toward renewable energy impact demand projections. Demand growth for 2025-2026 has seen downward revisions amid these mixed signals.
Overall, USOIL prices and global oil trade in 2025 are shaped by a complex interplay of geopolitical sanctions, domestic production policies, trade agreements, and evolving market demand, creating significant price volatility and trade flow shifts.
#OIL #WTI #CRUDEOIL #GAS

Oil jumps after new US sanctions on RussiaNew sanctions against Lukoil and Rosneft by the USA pushed oil up recently as traders worried that threatened secondary sanctions on banks working with these companies could disrupt supply to China, India and other importing countries. While this has done much to alleviate recent fears of significant oversupply, the effects in the medium term aren’t clear yet.
$54.75-56 seems to be confirmed as an area of support on the weekly chart with 17-20 October having been the third unsuccessful test. The crossover of the slow stochastic in oversold and clear break above the 20 SMA might normally be strong buying signals but volume doesn’t clearly support the bounce yet.
The 50 SMA from Bands which is price is currently testing looks like an important short-term dynamic resistance. Confirmation of more gains might come from a daily close clearly above $62. Beyond there, the 200 SMA just below $64 is likely to be a strong resistance from which a breakout would probably require a significant uptick in buying volume.
This is my personal opinion, not the opinion of Exness. This is not a recommendation to trade.

USOIL : Full analysisHello friends
Well, considering the sharp decline we had, the price has entered a descending channel and is slowly going down in this channel.
Now the price has reached a critical point, namely the bottom of the channel.
We need to see if buyers will support the price at the bottom of the channel like the previous two times or not?
If we do not see support from buyers and the channel is broken, we can expect lower prices.
56.30 and 53 dollars respectively.
But we will most likely see buyers' support in this area and the price could even reach the channel ceiling.
*Trade safely with us*

US OILD SUPPORT, RESISTANCE & TRENDLINE ANALYSISGo "LONG" if it breaks 61.96 with 62.21 as the target and if it breaks that then plan for 62.59 and if it breaks further then go for 62.90
Go "SHORT" if it breaks 61.59 with 61.23 with the first target and if it breaks that along with the trendline support then plan till 60.86 and if it breaks that as well then further till 60.50 and breaking that also will lead to 59.93


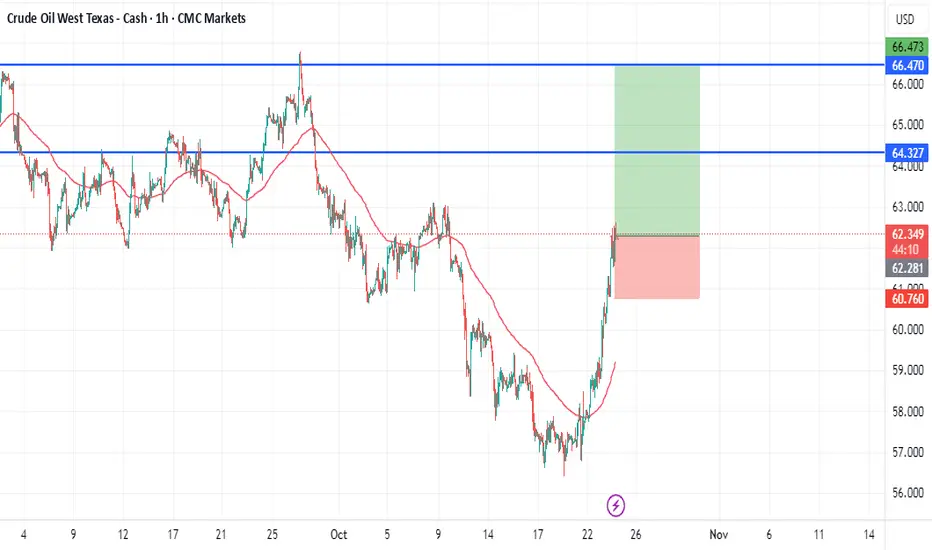
WTI Oil: $66 Back on the Cards as Sanctions BiteWTI crude extends its rally this morning after fresh U.S. sanctions on Rosneft and Lukoil sparked renewed supply concerns. The EU’s latest package added to the bullish momentum, sending prices sharply off the $56–57 demand zone.
Technically, the point of control (POC) from the recent volume profile aligns perfectly with the $65.50–66.00 resistance, suggesting this is where price may stall or consolidate before deciding the next leg.
Momentum remains strong, volume is rising, and bulls are clearly in control. As long as WTI holds above $60, a push into $66 looks likely — but expect sellers to reappear at that POC zone.cards — especially as the market reprices geopolitical risk and short-term supply tightness.
Key Levels:
Support: $57.00 / $60.00
Resistance: $62.50 / $65.50–66.00
Next target: $66.00

Oil - Expecting Bullish Continuation In The Short TermM15 - Strong bullish momentum.
No opposite signs.
Until the two Fibonacci support zones hold I expect the price to move higher further.
If you enjoy this idea, don’t forget to LIKE 👍, FOLLOW ✅, SHARE 🙌, and COMMENT ✍! Drop your thoughts and charts below to keep the discussion going. Your support helps keep this content free and reach more people! 🚀
--------------------------------------------------------------------------------------------------------------------

Analysis of crude oil trends. Hope it is helpful to you. "Demand and Sentiment" With crude oil prices currently stabilizing at $61.50, instead of obsessing over "whether supply is excessive," it’s better to focus on three more direct signals supporting a long position. These signals lie in changes in demand and market sentiment, and they are actually more closely aligned with short-term price movements:
1. "Unexpected Recovery" on the Demand Side
Previously, there were widespread concerns that "oil consumption would not pick up," but recent data has sent a reversal signal: Last week, the U.S. refinery utilization rate rose from 85% to 88% (the higher a refinery's operating rate, the more oil it consumes). Moreover, China has just rolled out a "stable growth plan for the petrochemical industry," which requires guaranteed supply of refined oil products in the fourth quarter—this directly drives up demand for crude oil purchases. More crucially, U.S. crude oil inventories unexpectedly decreased by 2.8 million barrels (compared to the original expectation of a 500,000-barrel increase). This is equivalent to "more oil being consumed than produced," and such a demand recovery will directly prop up oil prices.
2. Market Sentiment Shifting from "Bearish" to "Neutral, Then Bullish"
Previously, when oil prices were below $60, 80% of traders were taking short positions (expecting prices to fall). But the situation has changed now: Over the past three days, the volume of funds flowing into long positions has increased by 30%, and even small and medium-sized traders have started following the trend to enter the market. A more obvious sign is that in the past, oil prices would be pushed down by a flood of sell orders once they rose to $59.8, but now there are plenty of buy orders to absorb pressure at $60.50. This shows that the market's view on oil prices has changed—it’s no longer the case that "traders sell as soon as prices rise."
3. Short-Term Funds "Piling In" to Support Prices
The world’s largest crude oil ETF (equivalent to a fund where investors pool money to invest in crude oil) has seen a net inflow of $1.2 billion over the past three days—the largest single-week inflow since the start of this year. Additionally, some short-term funds on Wall Street are also quietly increasing their crude oil holdings. These funds are not entering the market for long-term investments; they are simply betting on a short-term rise in oil prices. Their buying activity will directly push oil prices upward, and at the very least, prevent a sharp short-term drop.
Crude Oil Trading Strategy for Today
usoil @buy61.00-61.50
tp:62-62.5
sl:59.5

XTI/USD : Oil Prices Rise Following Trump’s Sanctions DecisionXTI/USD Chart Analysis: Oil Prices Rise Following Trump’s Sanctions Decision
According to the XTI/USD chart, WTI crude is now trading above the key psychological level of $60, marking a sharp rebound of over 3% from October’s lows.
The surge came after U.S. President Donald Trump announced sanctions against major Russian oil producers Rosneft and Lukoil, which together account for more than 5 million barrels of oil per day.
The move is expected to reduce global oil supply; however, media outlets point out that:
→ there is no certainty that China and India will refrain from purchasing Russian crude;
→ previous sanctions introduced under the Biden administration — targeting companies such as Gazprom Neft and Surgutneftegaz — had little impact on Russian oil exports.
What could happen next?
Technical Analysis of the XTI/USD Chart
On 20 October, we noted that two descending channels had formed:
→ Red channel – a long-term pattern that developed following the Middle East escalation in June;
→ Purple channel – indicating accelerated downside pressure driven by rising OPEC+ output and hopes for a U.S.–China trade accord.
Our earlier assumption that the market was oversold and that the Falling Wedge pattern might trigger a bullish reversal proved correct (as shown by the arrow). Following the formation of an inverted head and shoulders pattern, oil prices climbed towards the median line of the purple channel.
At this stage, consolidation appears the most likely scenario, as supply and demand may stabilise around the channel’s median. Much will depend on statements from the White House, since higher oil prices could threaten U.S. inflation objectives.
However, if bullish momentum persists, WTI may continue to rise towards the next resistance area, defined by:
→ the upper boundary of the purple channel;
→ the 8–9 October highs, where a false breakout similar to the bear trap seen on 26 September cannot be ruled out.
This article represents the opinion of the Companies operating under the FXOpen brand only. It is not to be construed as an offer, solicitation, or recommendation with respect to products and services provided by the Companies operating under the FXOpen brand, nor is it to be considered financial advice.

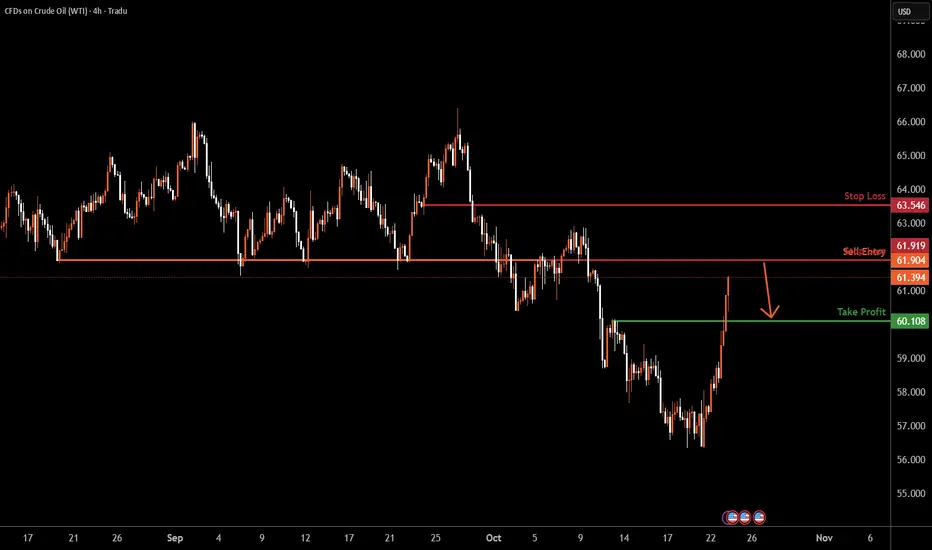
USOIL H4 | Approaching Major Resistance LevelBased on the H4 chart analysis, we could see the price rise to the sell entry which is an overlap resistance and could reverse from this levle to the take profit.
Sell entry is at 61.90, which is an overlap resistance.
Stop loss: 63.54, which is a pullbakc resistance.
Take profit is at 60.10, which is a pullback support.
Stratos Markets Limited (tradu.com ):
CFDs are complex instruments and come with a high risk of losing money rapidly due to leverage. 68% of retail investor accounts lose money when trading CFDs with this provider. You should consider whether you understand how CFDs work and whether you can afford to take the high risk of losing your money.
Stratos Europe Ltd (tradu.com ):
CFDs are complex instruments and come with a high risk of losing money rapidly due to leverage. 70% of retail investor accounts lose money when trading CFDs with this provider. You should consider whether you understand how CFDs work and whether you can afford to take the high risk of losing your money.
Bearish reversal off major resistance?WTI Oil (XTI/USD) is rising towards the pivot, which is an overlap resistance and could reverse to the 1st support.
Pivot: 62.10
1st Support: 58.37
1st Resistance: 64.66
Disclaimer:
The above opinions given constitute general market commentary, and do not constitute the opinion or advice of IC Markets or any form of personal or investment advice.
Any opinions, news, research, analyses, prices, other information, or links to third-party sites contained on this website are provided on an "as-is" basis, are intended only to be informative, is not an advice nor a recommendation, nor research, or a record of our trading prices, or an offer of, or solicitation for a transaction in any financial instrument and thus should not be treated as such. The information provided does not involve any specific investment objectives, financial situation and needs of any specific person who may receive it. Please be aware, that past performance is not a reliable indicator of future performance and/or results. Past Performance or Forward-looking scenarios based upon the reasonable beliefs of the third-party provider are not a guarantee of future performance. Actual results may differ materially from those anticipated in forward-looking or past performance statements. IC Markets makes no representation or warranty and assumes no liability as to the accuracy or completeness of the information provided, nor any loss arising from any investment based on a recommendation, forecast or any information supplied by any third-party.

US CREDE OIL SPORTAccording to Wyckoff's analysis, the trend of oil in the Forex market is accumulation and we are starting this change. Please send me your comments.
Thank you, my dear professor Ramtia Siddiqi

Pullback in Oil a selling opportunity? Oil markets received a boost in recent trading following the announcement of US sanctions on major Russian Oil producers: Rosneft and Lukoil.
Pushing price action above two key resistance levels at US$58.34 (6M) and US$59.46 (3M), WTI Oil is fast closing in on resistance from US$61.22 (1Y). It is worth considering that the recent upside move could simply be a pullback within a market that has been trending lower since the beginning of this year; therefore, sellers may make a show from US$61.22 if tested. Alternatively, a break higher opens the door to a larger area of resistance between US$64.82 and US$62.97 – a zone formed of 1M and 1W levels.
Written by the FP Markets Research Team

US OIL HI GUYS,
US OIL has finally made it to reaction zone. continuation buys on the pull back as illustrated months ago.
THE BUYS are almost exhausted. so i expect the Hs pattern some time next week for the long position sells.

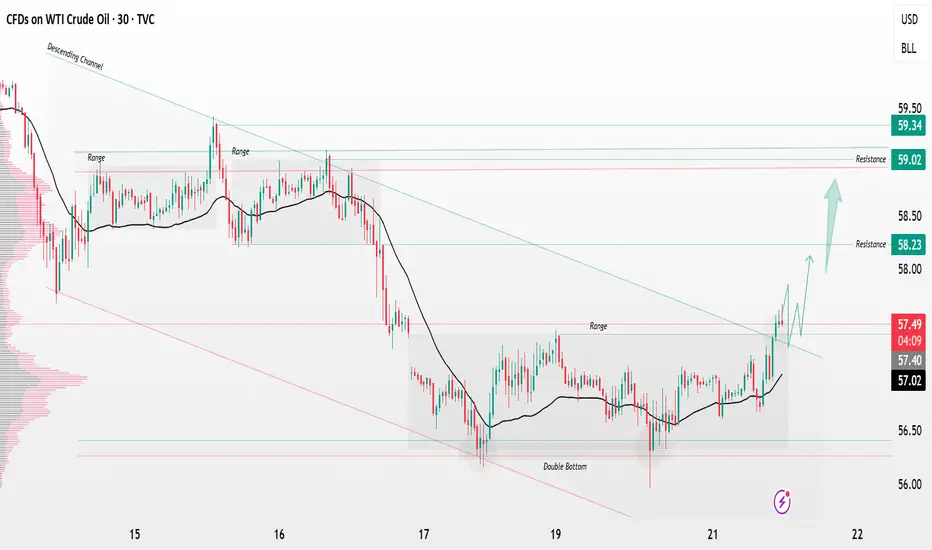
USOIL breakout from consolidation zone big breaking📊 USOIL (WTI Crude Oil) Technical Update 🛢️
USOIL has confirmed a descending channel breakout followed by a range consolidation breakout — showing strong bullish momentum on the 30-minute timeframe. 🔥
📈 Breakout Level: 57.60
🎯 Technical Targets:
1️⃣ First Target – 58.20
2️⃣ Second Target – 59.00
As long as price holds above 57.60, the bullish bias remains intact. ⚡
#USOIL #WTI #CrudeOil #PriceAction #TechnicalAnalysis #BreakoutTrading
USOIL's upside target is 64.6On the daily chart, USOIL stabilized and rose after retracing to the previous demand zone, forming a bullish bat pattern. The first upside target is currently 61.3, and the second target is 64.6.

US OIL SUPPORT, RESISTANCE & TRENDLINE ANALYSISMY all targets hit for "LONG" in previous post.
Go "LONG" if it breaks 60.67 with 60.78 as the target. If it breaks that then move up-till 61.04 and breaking that might lead till 61.14.
Go "SHORT" if it breaks 60.32 and target till 60.09 and if it breaks that then 59.97 might be the next target and breaking that might lead to 59.61.

Crude oil trading strategy for today. Hope it is helpful to youWhy Is the $60.13 Level Suitable for a Long Position in Crude Oil?
Currently, crude oil prices have stabilized above the $60 mark. Although there are still concerns about "excess supply" in the market, from the perspective of short-term opportunities, two key signals support our attempt to take a long position—we should not be constrained by the previous "weak market" mindset:
1. Escalating Risks of Geopolitical Conflicts
Ukraine has stepped up attacks on Russia's oil facilities. Recently, it has knocked out two large Russian oil refineries, pushing Russia's oil refining volume to a two-year low. If key oil pipelines are affected in the future, or if the conflict between Israel and Lebanon in the Middle East expands to disrupt transportation in the Persian Gulf, the market will immediately worry about "insufficient oil supply," and oil prices are likely to surge rapidly. For reference, after Israel's air strike on Iranian facilities in June, oil prices soared by 6.9% in a single day—such sudden opportunities are worth seizing.
2. OPEC+ Lacks Momentum for Further Production Increases
Although OPEC+ plans to increase production by 137,000 barrels per month from October to November, most oil-producing countries have no spare production capacity left. Back in May, the actual production increase only reached 45% of the planned amount. Recently, there have been reports that OPEC+ is discussing "suspending subsequent production increases" internally. If it clearly announces the suspension of production increases (or even resumes production cuts) at its meeting, the pressure from excess supply will be significantly relieved, and oil prices will gain stronger momentum to rise.
Crude Oil Trading Strategy for Today
usoil @ buy60.00-60.50
pt:61-61.50
sl:59

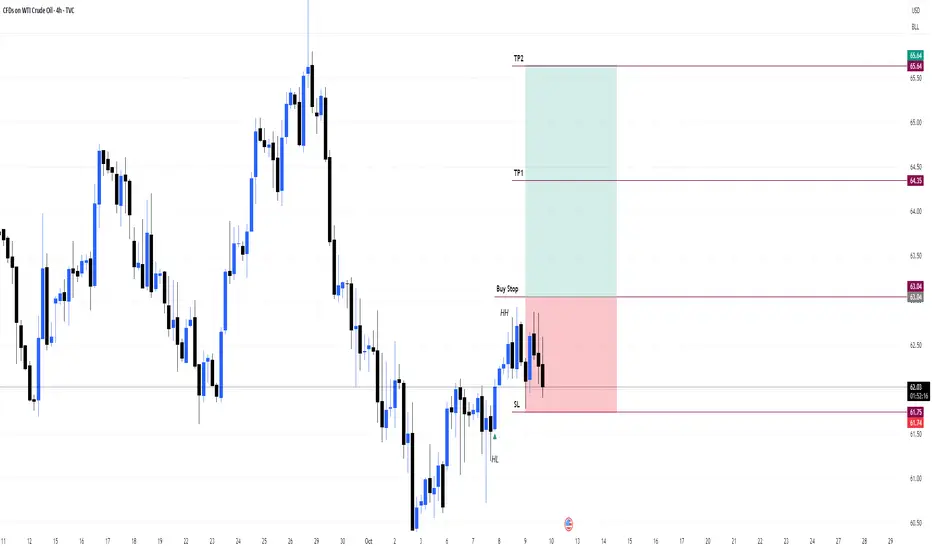
USOILPrice recently formed a Higher High, confirming bullish momentum.
Currently, price is pulling back and forming a Higher Low, maintaining the uptrend structure.
📈 Buy Stop placed above the previous Higher High, anticipating a breakout continuation.
🛑 Stop Loss set just below the Higher Low, where price previously reversed.
🎯 Risk to Reward: 1:2, aiming for a favorable reward relative to the risk.
Structure: Bullish (HH + HL)
Entry Type: Breakout Entry
Confirmation: Structure + Buy Stop Strategy
SL: Below HL | TP: 2x Risk