Crude oil trading strategyDemand side: Structural highlights stand out, terminal consumption resilience exceeds expectations
Asia resumes replenishment demand temporarily
China's refining margins have recovered (the 3-2-1 cracking spread has risen to $26 per barrel), with sufficient remaining import quotas in November, and it is expected that crude oil purchase volume will increase by 12%-15% in the latter half of the month. India's refineries have initiated a new round of replenishment due to the traditional consumption peak in December (increased holiday travel), with the import volume expected to exceed 5.4 million barrels per day in November. The increase in Asian demand accounts for more than 70% of the global demand increase, becoming a key support for short-term bulls.
Finished oil inventory reduction confirms consumption resilience
The latest EIA data shows that gasoline inventories have decreased for two consecutive weeks (cumulative reduction of 1.8 million barrels), and distillate oil inventories have decreased for three consecutive weeks (cumulative reduction of 2.1 million barrels). The extent of finished oil inventory reduction far exceeds market expectations, reflecting the resilience of terminal consumption. U.S. gasoline retail sales increased by 3.2% month-on-month (a new high in the past two months), and European diesel consumption decreased by 2.1% (previously 5.8%), with the improvement in the consumption side easing concerns about "weak demand", providing fundamental support for the rebound in crude oil prices.
Crude oil trading strategy
buy:59.30-59.60
tp:60.20-60.50
sl:58.80
Trade ideas

Oil analysis that was in our weekly watchlistIn our weekly watchlist, we had a bullish outlook on Oil, and that analysis is still valid. The main reason for this bias is the multiple rejections of price from the resistance zone. There’s a strong possibility that price may break this level with a strong impulsive candle.
To avoid missing the move, using a Buy Stop order in such a scenario can be a smart approach

Potential bearish drop?WTI Oil (XTI/USD) has rejected off the pivot and could drop to the 1st support which acts as a swing high resistance.
Pivot: 62.22
1st Support: 54.92
1st Resistance: 65.94
Disclaimer:
The opinions given above constitute general market commentary and do not constitute the opinion or advice of IC Markets or any form of personal or investment advice.
Any opinions, news, research, analyses, prices, other information, or links to third-party sites contained on this website are provided on an "as-is" basis, are intended to be informative only, and are not advice, a recommendation, research, a record of our trading prices, an offer of, or solicitation for, a transaction in any financial instrument and thus should not be treated as such. The information provided does not involve any specific investment objectives, financial situation, or needs of any specific person who may receive it. Please be aware that past performance is not a reliable indicator of future performance and/or results. Past performance or forward-looking scenarios based upon the reasonable beliefs of the third-party provider are not a guarantee of future performance. Actual results may differ materially from those anticipated in forward-looking or past performance statements. IC Markets makes no representation or warranty and assumes no liability as to the accuracy or completeness of the information provided, nor any loss arising from any investment based on a recommendation, forecast, or any information supplied by any third party.

WTI Crude Oil – Update
I’ve entered a short position around this zone.
I don’t predict the market — I just follow opportunities.
It doesn’t matter what happens after entry; I simply follow my plan.
Those who’ve been following me know my system:
At a 1:1 reward, I close half of my position — that means zero risk.
If the market reverses and hits my stop, I lose nothing.
If it keeps moving, I use a trailing stop to catch as much of the move as possible.
That’s what real position management looks like.
And if my level breaks, I don’t just sit and watch — I’ll go long with the market.
I don’t predict or guess the future;
I trade with discipline, patience, and respect for the market.
I’m a trader, not a fortune teller.
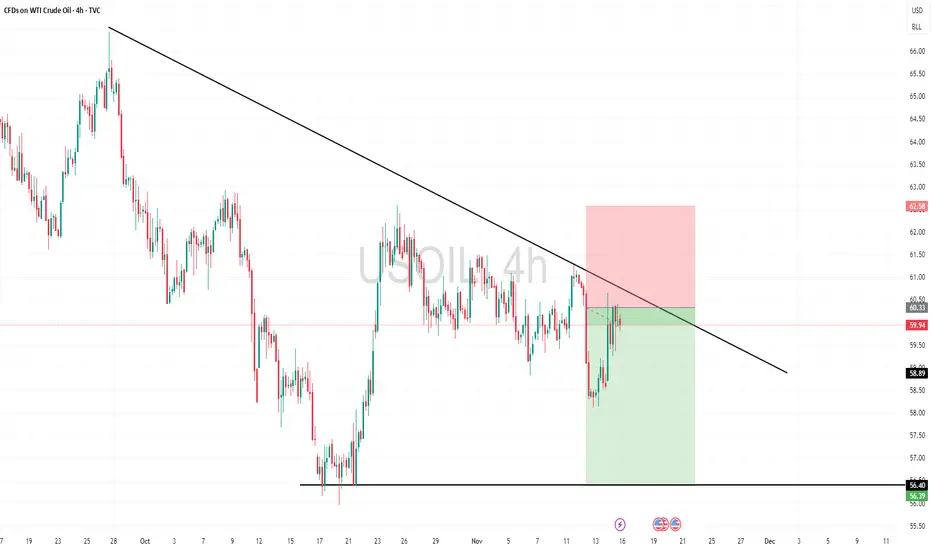
Oil - Expecting Bullish Continuation In The Short TermH1 - Downtrend line breakout.
Higher highs.
No opposite signs.
Until the two strong support zones hold I expect the price to move higher further.
If you enjoy this idea, don’t forget to LIKE 👍, FOLLOW ✅, SHARE 🙌, and COMMENT ✍! Drop your thoughts and charts below to keep the discussion going. Your support helps keep this content free and reach more people! 🚀
--------------------------------------------------------------------------------------------------------------------

US-Oil will further push Down-sideHello Traders
In This Chart xtiusd HOURLY Forex Forecast By FOREX PLANET
today XTIUSD analysis 👆
🟢This Chart includes_ (XTIUSD market update)
🟢What is The Next Opportunity on XTIUSD Market
🟢how to Enter to the Valid Entry With Assurance Profit
This CHART is For Trader's that Want to Improve Their Technical Analysis Skills and Their Trading By Understanding How To Analyze The Market Using Multiple Timeframes and Understanding The Bigger Picture on the Charts
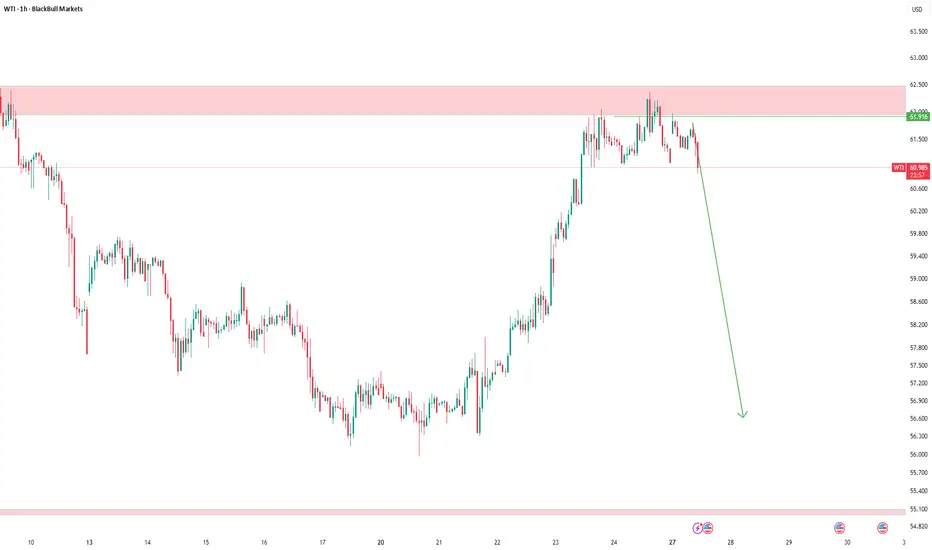
Oil Under Pressure!Crude oil futures rose more than 1% toward $60 per barrel on Friday, heading for an end to a two-week losing streak, supported by supply risks linked to geopolitical tensions. The impact of U.S. sanctions also began to appear early, as major Russian companies announced reductions in their oil-trading activities. Analysts warned that a large portion of Russia’s seaborne oil exports may face disruptions due to rerouted shipments and slow unloading, while purchases from some Asian countries have declined.
Meanwhile, bearish pressure persisted as the International Energy Agency projected a growing supply glut, with global output expected to exceed demand by around 2.4 million barrels per day this year and 4 million next year. OPEC data also indicated a surplus in the third quarter, alongside rising U.S. production and increasing inventories.
On the technical front, crude oil prices continue to trade in a overall downtrend, forming lower lows and maintaining a negative structure, with the next target located at $58.93. The downtrend would shift to an uptrend if the price rises above $61.403 and forms a higher high on the 4-hour timeframe.

USOIL H4 | Bearish Drop OffMomentum: Bearish
The price is currently moving along a descending trendline and remains below the Ichimoku Cloud, indicating continued downside pressure.
Sell entry: 60.35
Pullback resitance
Stop loss: 61.42
Pullback resistance
Take profit: 58.21
High Risk Investment Warning
Stratos Markets Limited (tradu.com ), Stratos Europe Ltd (tradu.com ):
CFDs are complex instruments and come with a high risk of losing money rapidly due to leverage. 70% of retail investor accounts lose money when trading CFDs with this provider. You should consider whether you understand how CFDs work and whether you can afford to take the high risk of losing your money.
Stratos Global LLC (tradu.com ): Losses can exceed deposits.
Please be advised that the information presented on TradingView is provided to Tradu (‘Company’, ‘we’) by a third-party provider (‘TFA Global Pte Ltd’). Please be reminded that you are solely responsible for the trading decisions on your account. Any information and/or content is intended entirely for research, educational and informational purposes only and does not constitute investment or consultation advice or investment strategy. The information is not tailored to the investment needs of any specific person and therefore does not involve a consideration of any of the investment objectives, financial situation or needs of any viewer that may receive it. Past performance is not a reliable indicator of future results. Actual results may differ materially from those anticipated in forward-looking or past performance statements. We assume no liability as to the accuracy or completeness of any of the information and/or content provided herein and the Company cannot be held responsible for any omission, mistake nor for any loss or damage including without limitation to any loss of profit which may arise from reliance on any information supplied by TFA Global Pte Ltd.

The Contango Conundrum: Why Crude’s Price Power WanesThe global crude oil market is signaling sustained weakness. A clear sign is the Contango in the West Texas Intermediate (WTI) futures curve for most of 2026. This structure prices future oil deliveries higher than immediate ones, strongly indicating a global supply glut. Major forecasting bodies like the International Energy Agency (IEA) and the Organization of the Petroleum Exporting Countries (OPEC) now confirm a record surplus looms in 2026, reversing previous tight market expectations. Understanding this decline requires a multidisciplinary lens, examining supply resilience against sluggish demand across several domains.
Geostrategy and Geopolitics: Production Over Protocol
Geopolitical decisions, paradoxically, contribute to oversupply. OPEC+ members are gradually unwinding previous voluntary production cuts, adding millions of barrels back to the market. This production boost, formalized in their latest agreements, increases supply visibility and dampens price spikes. Simultaneously, sustained geopolitical tensions between major powers often lead key consumers like China to ramp up Strategic Petroleum Reserves (SPR) , effectively soaking up immediate surplus but reducing future demand visibility. This policy-driven stockpiling mitigates immediate price falls, but structural oversupply persists.
Macroeconomics and Economics: Slowdown Meets Resilience
A deceleration in global oil demand growth meets unexpectedly resilient supply . Macroeconomic headwinds, including trade tensions and a sluggish global economic outlook, suppress consumption growth below historical trends. This tepid demand environment is exacerbated by expanding production from non-OPEC+ nations. Crucially, the United States, Brazil, Canada, and Guyana lead this non-OPEC+ supply expansion, challenging the cartel’s market dominance. The resulting imbalance, production exceeding demand, creates the chronic oversupply driving WTI into contango.
Technology and High-Tech: Efficiency Enhances Supply
Advancements in extraction technology dramatically boosted supply, particularly within the US shale sector. Continuous innovations in horizontal drilling and hydraulic fracturing sustain high US output, even as prices soften. Furthermore, the rapid expansion of Electric Vehicle (EV) sales and increasing vehicle fuel efficiencies represent a major technological headwind for transportation fuel demand. This shift, supported by global patent activity in battery and wave energy technology, structurally limits long-term oil consumption growth.
Patent and Science Analysis: The Energy Transition
Patent activity confirms the directional shift away from fossil fuels. While patents related to downhole completion systems and drilling fluid prediction remain, increased patenting in Carbon Capture and Sequestration (CCS) [/b and Green Hydrogen signals the industry's necessary pivot. The science of energy transition, focusing on low-carbon solutions, suggests a future where oil remains a critical input but faces mounting competition from technological substitutes. This long-term displacement risk pressures oil prices, even if demand remains firm in the short run.
Cyber and Strategic Risk: Supply Chain Security
The increasing reliance on complex digital infrastructure across the oil value chain introduces cyber risk . Successful attacks on pipeline operators or refineries can cause temporary supply disruptions and price spikes. However, the market currently views such disruptions as temporary events rather than long-term structural issues affecting the overall supply-demand balance. The oversupply acts as a buffer, with floating storage and ample inventory mitigating the impact of short-term, localized outages.
Investment Outlook: Watching Spreads
The market signals clearly indicate supply strength and demand vulnerability. The widening WTI contango structure provides a clear arbitrage opportunity for traders willing to finance storage. Investors should closely monitor the Brent-Dubai Exchange of Futures for Swaps (EFS), which is turning negative, underscoring specific weakening in the Atlantic Basin. Barring a sharp, coordinated OPEC+ cut or an unexpected large-scale geopolitical conflict, pricing pressure should persist into 2026. Traders must prioritize futures spread analysis over simple outright price forecasting.

USOIL BEST PLACE TO SELL FROM|SHORT
USOIL SIGNAL
Trade Direction: short
Entry Level: 60.33
Target Level: 59.05
Stop Loss: 61.18
RISK PROFILE
Risk level: medium
Suggested risk: 1%
Timeframe: 5h
Disclosure: I am part of Trade Nation's Influencer program and receive a monthly fee for using their TradingView charts in my analysis.
✅LIKE AND COMMENT MY IDEAS✅

USOIL H1 | Bearish Momentum BuildingMomentum: Bearish
Price is currently retracing toward the sell entry, which aligns with the descending trendline that has been tested at least three times.
Sell entry: 60.16
Pullback resistance
Stop loss: 60.71
Pullback resistance
Take profit: 58.95
Swing low support
Stratos Markets Limited (tradu.com ):
CFDs are complex instruments and come with a high risk of losing money rapidly due to leverage. 68% of retail investor accounts lose money when trading CFDs with this provider. You should consider whether you understand how CFDs work and whether you can afford to take the high risk of losing your money.
Stratos Europe Ltd (thttps://tradu.com/eu ):
CFDs are complex instruments and come with a high risk of losing money rapidly due to leverage. 70% of retail investor accounts lose money when trading CFDs with this provider. You should consider whether you understand how CFDs work and whether you can afford to take the high risk of losing your money.

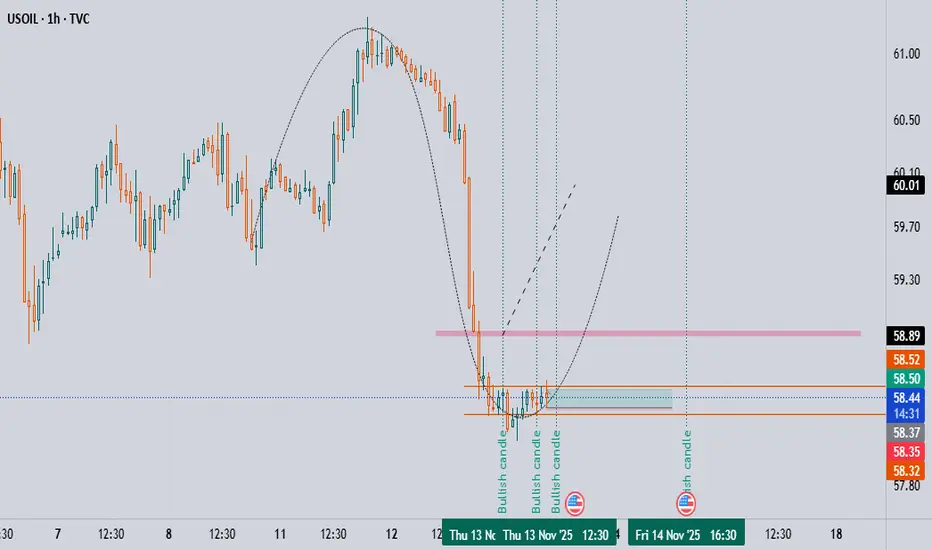
USOIL🧩 Chart Type
• 1-hour timeframe (CFDs on WTI Crude Oil)
• The chart is mainly based on Elliott Wave and harmonic pattern analysis.
⸻
🔍 Key Observations
1. Falling Wedge / Channel
• The price is moving inside a descending wedge pattern (two converging trendlines).
• This usually signals a potential bullish reversal once the pattern completes.
⸻
2. Wave Structure (Elliott Waves)
• The chart labels show A-B-C corrective waves inside the wedge.
• Currently, the market seems to be completing a C wave downwards within a complex correction.
⸻
3. Harmonic Pattern (Possibly a Bat / Gartley)
• There are multiple X-A-B-C-D harmonic projections.
• The final D point appears around 57.8 – 58.0 USD, where Fibonacci extensions (1.618 and 2.24) align.
• This area is likely a potential reversal zone (PRZ).
⸻
4. Expected Move
• After completing the downward C or D leg near $57.8–58.0,
the chart projects a strong upward move — shown by the large vertical arrow.
• This suggests a bullish reversal is expected once the final leg finishes.

Hellena | Oil (4H): LONG to resistance area 64.8.Colleagues, in fact, I have not changed the wave markup, but I have a slightly different view on the near-term price movement plan.
In the last forecast I emphasized that the target is the area of 58.9, but now it looks more likely that the completion of wave “C” in a complex correction (resistance area 64.8). Then I will consider the long-awaited downward movement again.
Manage your capital correctly and competently! Only enter trades based on reliable patterns!

Market Analysis: WTI Crude Faces HurdlesMarket Analysis: WTI Crude Faces Hurdles
Crude oil is showing bearish signs and might decline below $58.80.
Important Takeaways for WTI Crude Oil Price Analysis Today
- Crude oil prices failed to clear the $61.20 region and started a fresh decline.
- There is a bearish trend line forming with resistance at $60.00 on the hourly chart of XTI/USD.
WTI Crude Oil Price Technical Analysis
On the hourly chart of WTI Crude Oil, the price struggled to clear $61.20 against the US Dollar. The price started a fresh decline below $60.00.
The bears gained strength and pushed the price below $59.50 and the 50-hour simple moving average. Finally, the price tested $58.80 and recently started a recovery wave. There was a move above $59.40, and the 23.6% Fib retracement level of the downward move from the $61.21 swing high to the $58.80 low.
The bears are now active below $59.80. If there is a fresh increase, the price could face a barrier near $60.00. There is also a bearish trend line forming with resistance at $60.00.
The first major resistance is near the 76.4% Fib retracement at $60.65. The next stop for the bulls could be near $61.20. Any more gains might send the price toward $62.00. Conversely, the price might start another decline and test $59.40.
The next major area of interest for the bulls on the WTI crude oil chart is $58.80. If there is a downside break, the price might decline toward $57.50. Any more losses may perhaps open the doors for a move toward $55.00.
This article represents the opinion of the Companies operating under the FXOpen brand only. It is not to be construed as an offer, solicitation, or recommendation with respect to products and services provided by the Companies operating under the FXOpen brand, nor is it to be considered financial advice.

WTI OIL 4H Channel Down aiming for a Lower Low.WTI Oil (USOIL) is extending the 1D MA50 (red trend-line) rejection of October 24 and has formed a short-term Channel Down. We are currently on its second Bearish Leg following a new rejection this time on the 4H MA200 (orange trend-line).
With the first Bearish Leg declining by -4.72%, we expect the current one to replicate this drop and target $58.60.
-------------------------------------------------------------------------------
** Please LIKE 👍, FOLLOW ✅, SHARE 🙌 and COMMENT ✍ if you enjoy this idea! Also share your ideas and charts in the comments section below! This is best way to keep it relevant, support us, keep the content here free and allow the idea to reach as many people as possible. **
-------------------------------------------------------------------------------
💸💸💸💸💸💸
👇 👇 👇 👇 👇 👇

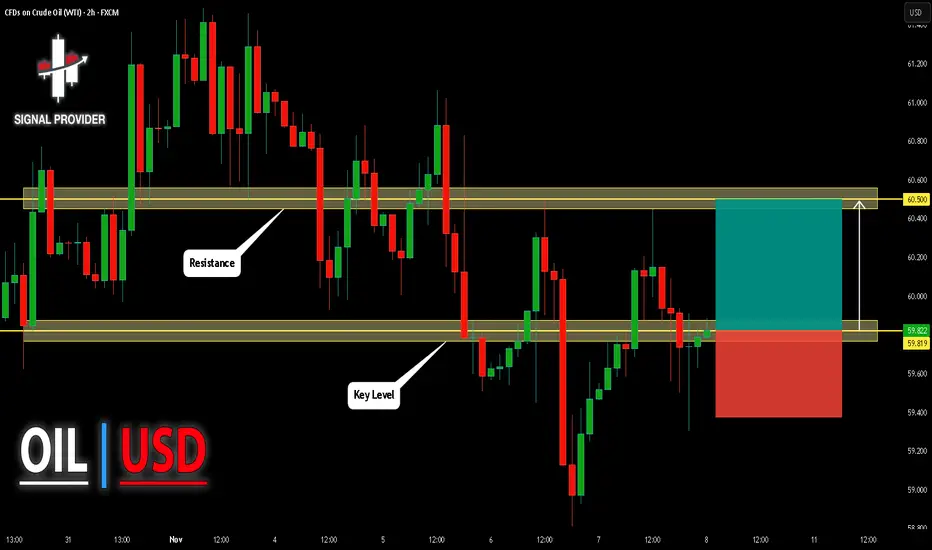
USOIL Will Move Higher! Buy!
Take a look at our analysis for USOIL.
Time Frame: 2h
Current Trend: Bullish
Sentiment: Oversold (based on 7-period RSI)
Forecast: Bullish
The price is testing a key support 59.819.
Current market trend & oversold RSI makes me think that buyers will push the price. I will anticipate a bullish movement at least to 60.500 level.
P.S
Please, note that an oversold/overbought condition can last for a long time, and therefore being oversold/overbought doesn't mean a price rally will come soon, or at all.
Like and subscribe and comment my ideas if you enjoy them!
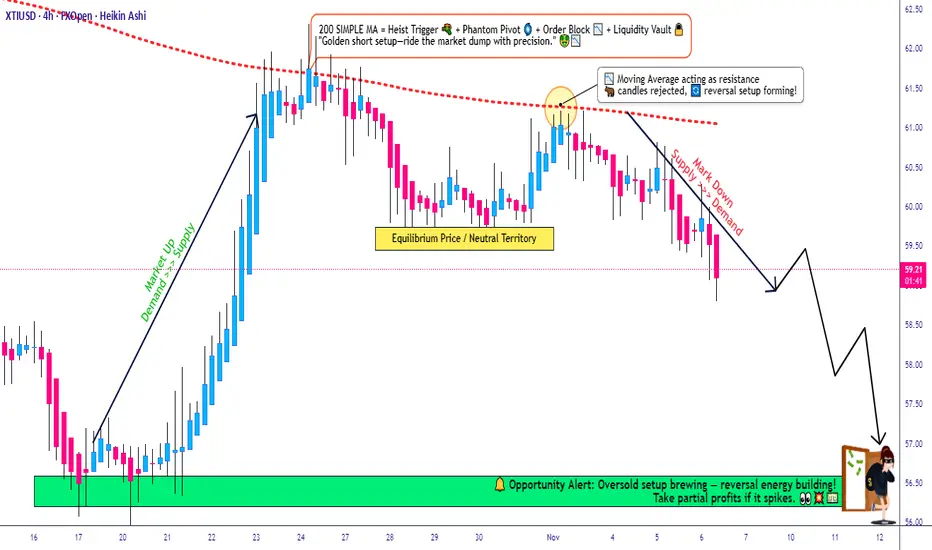
Is XTI/USD Setting Up for a Sharp Bearish Correction?🚨 WTI/USD CRUDE OIL: THE BEARISH HEIST AWAITS 🎯
═══════════════════════════════════════════════════════════
THE SETUP: Breaking Down The Crime Scene 🕵️♂️
We're executing a bearish pullback strategy on WTI/USD spot crude oil, leveraging the 200-period Simple Moving Average (SMA) as our primary technical confirmation. The energy sector is flashing opportunity signals, and it's time to work the levels like a seasoned professional.
📊 STRATEGY FRAMEWORK
Market Direction: Bearish Pullback from 200 SMA Resistance
Timeframe: Suitable for Swing & Day Trading Operations
Asset Class: Energies | WTI Crude Oil Spot
💰 THE LAYERED ENTRY STRATEGY (Multi-Level Approach)
This is where the Thief Method shines—stacking limit orders at key price levels to accumulate positions as the market comes to you:
Suggested Entry Layer Points:
Layer 1: 60.50 💧
Layer 2: 60.00 💧
Layer 3: 59.50 💧
Layer 4: 59.00 💧
⚠️ Pro Tip: Feel free to add or adjust layers based on your risk tolerance and position size. The beauty of this method is scalability—customize to YOUR account size and risk parameters.
🛑 STOP LOSS PLACEMENT
Primary SL Level: 61.00
Positioned at the nearest swing high/candle wick resistance above our entry cluster. This respects natural market structure and gives us a defined, measurable risk point.
⚡ DISCLAIMER ON RISK MANAGEMENT:
This is NOT financial advice. Risk management is YOUR responsibility. The suggested SL is based on technical structure, but YOU control your account. Set stops that align with YOUR risk tolerance. Trade only what you can afford to lose.
🎯 PROFIT TARGET STRUCTURE
Primary Target: 56.50
Secondary Support Level: 56.00 — A police barricade of strength where multiple factors converge:
Strong historical support confluence 📍
Oversold zone recognition ⚖️
Potential reversal trap (exit strategy alert) ⚠️
Exit Strategy: Consider banking profits at 56.50 before support intensifies at 56.00. Lock in gains as the technical structure suggests potential friction.
⚡ DISCLAIMER ON PROFIT TARGETS:
Again, these are TECHNICAL levels only. YOU decide your exit strategy. Whether you take full profits at 56.50, trail stops, or use partial exits—this is YOUR trading plan. No setup is guaranteed.
🔗 RELATED PAIRS TO WATCH (Correlation Check)
Understanding energy market interrelations helps you spot confirmation signals:
US Dollar Index ( TVC:DXY ) → Inverse correlation to crude oil. Strengthen USD = Bearish pressure on oil. Watch DXY for confirmation of our bearish bias.
CSEMA:S&P 500 ( AMEX:SPY / CME_MINI:ES1! ) → Risk sentiment indicator. If equities weaken, crude often follows bearish patterns. Check equity trends for macro confirmation.
Energy Select Sector ETF ( AMEX:XLE ) → Direct correlation. Tracks large-cap energy stocks. Oil weakness often precedes XLE drops.
FX:EURUSD → Global risk sentiment. Weak euro = risk-off environment = potential crude weakness. Monitor for macro context.
AMEX:USO (Crude Oil ETF) → Direct oil tracking instrument. Moves in lockstep with WTI. Use for backup confirmation.
📋 THE THIEF STRATEGY CHECKLIST
✅ Confirm 200 SMA as resistance/bearish context
✅ Stack limit orders—don't chase price
✅ Define your personal stop loss (around 61.00 structure)
✅ Target scale-outs near 56.50-56.00
✅ Use correlation pairs for macro confirmation
✅ Manage position size ruthlessly
✅ Accept losses—they're tuition in the market
💬 ENGAGEMENT BOOST
✨ If you find value in my analysis, a 👍 and 🚀 boost is much appreciated — it helps me share more setups with the community!
#WTI #CrudeOil #EnergyTrading #TechnicalAnalysis #ThiefStrategy #SwingTrading #DayTrading #Trading101 #ForexEnergy #MultiLayerEntry #RiskManagement #TradingSetup #FinancialMarkets #Energies #TradingCommunity
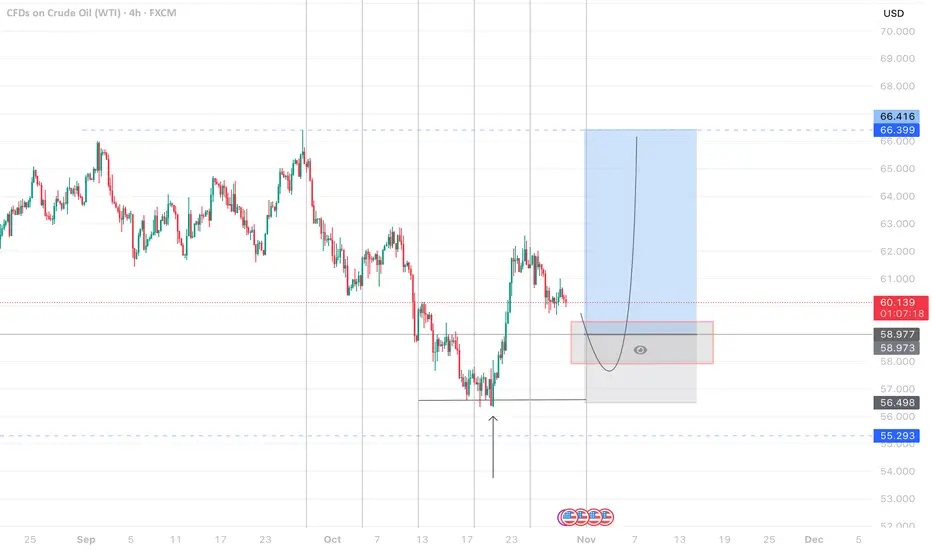
WTI on high time frame
1. **Current Price Action**: WTI has reached the $56 level, indicating a liquidity sweep.
2. **Signals for Higher Prices**: After the liquidity sweep, there are indications that prices may rise, with the first target at around $64.
3. **Geopolitical Factors**: The analysis is contingent on geopolitical stability, as any changes in tariffs or geopolitical situations can invalidate this forecast.
If you need more detailed analysis or specific aspects explained, feel free to ask!

USOIL LongsUSOIL is correcting into a demand zone. The current risk to reward ratio is wide, so I am waiting for price to get to the zone, then give buy confirmations before partaking in the trade. Keep an eye out for this one. Manage Risk!
Usoil Next MoveUsoil Under Selling Pressure We Sell At 62.045 For Tp 52.02
Usoil In Bearish Structure Don't Miss This Opportunity Manage Your Risk Properly
For more updates Stay Tuned

Crude oil: Consolidating sideways in the short term.Crude oil prices once hit a low not seen in over two weeks. In early trading on Monday, prices remained below the psychological threshold of $60 per barrel. Therefore, bullish traders should exercise caution before going long and adopt a prudent approach to positioning in anticipation of any substantial upward movement.
Crude oil is oscillating within a range in the short term. Prices have repeatedly crossed the moving average system, with the short-term objective trend direction being sideways consolidation. The MACD indicator is hovering around the zero line, reflecting a stalemate between bullish and bearish momentum. With oil prices trading in the middle of the range in early trading, it is expected that intraday crude oil movement will remain within the range, and a range-bound trading strategy is recommended.
Buy 58.8 - 59.3
SL 58.3
TP 59.8 - 60.3 - 61
Sell 60.4 - 61
SL 61.5
TP 59.1 - 58.5

WTI Crude Oil: Is a New Super-Cycle About to Ignite?WTI may be approaching one of its most important turning points in years. The long correction from the 2022 high appears complete, and multiple technical frameworks now align to signal a potential new bullish cycle.
Price remains supported on the 3/1 Gann angle on the monthly chart. A monthly close above $70 opens the first breakout phase, while a break above $130 would confirm a new multi-year advance. Gann cycle timing highlights 2027, 2029, and 2031 as major future peak windows.
The weekly trend remains firm above the $55.15 structural low, reinforcing the April 2025 cycle bottom. Elliott Wave counts show a clean 5-wave rally into 2022, followed by an ABC correction into 2025, which strongly suggests the market has reset.
If momentum builds, WTI could target new all-time highs, with potential to stretch toward the $200 region in the next major cycle.
Vital Direction sees oil entering a phase where long-term opportunity may outweigh risk, with breakout levels clearly defined.
