USOIL SELLERS WILL DOMINATE THE MARKET|SHORT
USOIL SIGNAL
Trade Direction: short
Entry Level: 61.87
Target Level: 58.58
Stop Loss: 64.06
RISK PROFILE
Risk level: medium
Suggested risk: 1%
Timeframe: 6h
Disclosure: I am part of Trade Nation's Influencer program and receive a monthly fee for using their TradingView charts in my analysis.
✅LIKE AND COMMENT MY IDEAS✅
Trade ideas

Crude Oil Trading Strategy for TodayGeopolitical sanctions trigger expectations of supply contraction: In late October, both the United States and Europe simultaneously escalated their energy sanctions against Russia. The United States imposed sanctions on Rosneft (the Russian oil company) and Lukoil (another Russian oil company), with the combined total of these two companies accounting for nearly 50% of Russia's total crude oil exports; the 19th round of sanctions by the European Union for the first time blocked the "third-country bypass" export channels. India, as the largest buyer of Russian maritime crude oil (accounting for over 36%), has begun to seek sources in the Middle East, directly pushing up the spot market premium and providing immediate support for oil prices.
Crude Oil Trading Strategy for Today
usoil @buy 61-61.5
tp:62-62.5
SL:60

Upward trend in oilThe price of very clean oil reacted to the specified range and started an upward trend. We expect either the upward trend to continue or the price to correct and resume its upward movement from the specified range.

USOIL – Bearish SetupOn the daily timeframe, USOIL is in a clear downtrend.
On the 4H timeframe, a bearish pattern has formed after breaking the previous low, followed by a corrective move up to the Fibonacci golden zone.
Bearish candles appeared in that area, indicating a possible continuation of the downtrend toward the downside targets.
Targets are shown on the chart — based on Fibonacci extension levels and a double top pattern.
Do you agree with this bearish setup?
Usoil Next MoveUsoil Under Selling Pressure We Sell At 62.045 For Tp 52.02
Usoil In Bearish Structure Don't Miss This Opportunity Manage Your Risk Properly
For more updates Stay Tuned

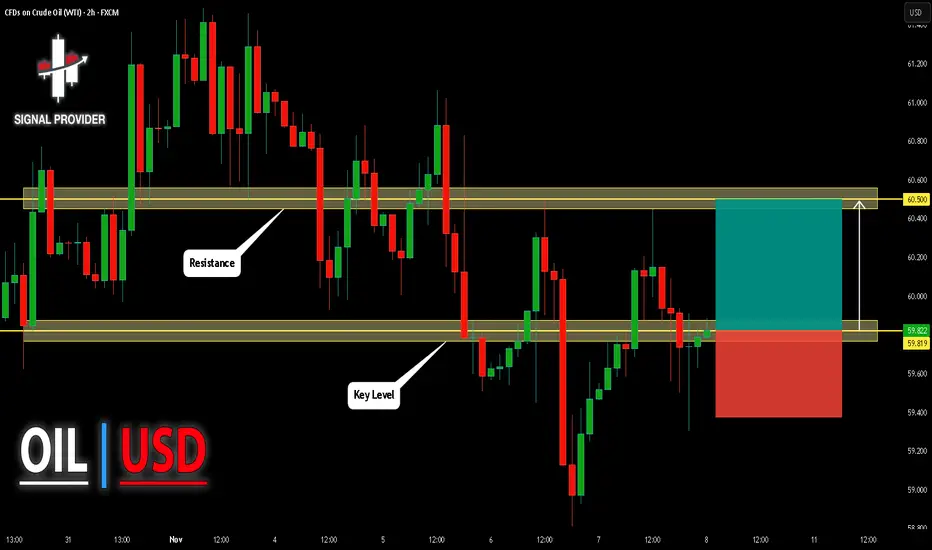
USOIL Will Move Higher! Buy!
Take a look at our analysis for USOIL.
Time Frame: 2h
Current Trend: Bullish
Sentiment: Oversold (based on 7-period RSI)
Forecast: Bullish
The price is testing a key support 59.819.
Current market trend & oversold RSI makes me think that buyers will push the price. I will anticipate a bullish movement at least to 60.500 level.
P.S
Please, note that an oversold/overbought condition can last for a long time, and therefore being oversold/overbought doesn't mean a price rally will come soon, or at all.
Like and subscribe and comment my ideas if you enjoy them!
Next week's crude oil trading strategyThe expectation of the Fed's interest rate cut has been restored, and the decline in the US dollar index has boosted oil prices.
In November, the core PPI of the US increased by 2.8% year-on-year (lower than the expected 3.0%), and the number of unemployment benefit claims exceeded expectations and increased by 12% month-on-month. The probability of the Fed cutting interest rates in December has risen from 68% to 85%, and the cumulative interest rate cut expectation for 2026 has been restored from 75BP to 90BP. The marginal warming of the expectation of loose liquidity has pushed the US dollar index to fall from 100.5 to 99.2, and the valuation of major commodities priced in US dollars, such as crude oil, has been supported - historical data shows that for every 1% decline in the US dollar index, the average crude oil price rises by 1.3%. The current decline in the US dollar has directly boosted oil prices.
Next week's crude oil trading strategy
buy:59.5-60
tp:60.5-601
sl:59

Oil price continues to declineAccording to the previous analysis, the price hit the mpl range and we are witnessing a continuation of the downtrend. We can expect the price to reach the specified fl range.
WTI Crude upside resistance at 6160The WTI Crude Oil is currently trading with a bearish bias, aligned with the broader downward trend. Recent price action shows a retest of the longer term support, suggesting a temporary relief rally within the downtrend.
Key resistance is located at 6160, a prior consolidation zone. This level will be critical in determining the next directional move.
A bearish rejection from 6160 could confirm the resumption of the downtrend, targeting the next support levels at 5946, followed by 5845 and 5780 over a longer timeframe.
Conversely, a decisive breakout and daily close above 6160 would invalidate the current bearish setup, shifting sentiment to bullish and potentially triggering a move towards 6215, then 6300.
Conclusion:
The short-term outlook remains bearish unless the WTI Crude price breaks and holds above 6160. Traders should watch for price action signals around this key level to confirm direction. A rejection favours fresh downside continuation, while a breakout signals a potential trend reversal or deeper correction.
This communication is for informational purposes only and should not be viewed as any form of recommendation as to a particular course of action or as investment advice. It is not intended as an offer or solicitation for the purchase or sale of any financial instrument or as an official confirmation of any transaction. Opinions, estimates and assumptions expressed herein are made as of the date of this communication and are subject to change without notice. This communication has been prepared based upon information, including market prices, data and other information, believed to be reliable; however, Trade Nation does not warrant its completeness or accuracy. All market prices and market data contained in or attached to this communication are indicative and subject to change without notice.

Crude Oil Trading Strategy for TodayShort-term weaknesses have become more prominent, while the stabilizing role of crude oil has intensified.
The fluctuation in renewable energy output and the surge in demand for crude oil replenishment
In November, the world experienced extreme weather: The cold wave in Europe led to a 27% drop in wind power output (wind power generation in Germany and France decreased by 32% year-on-year), the Asian typhoon season delayed the progress of photovoltaic installation (new installations in November decreased by 35% year-on-year), and the power supply gap was forced to rely on crude oil to be filled. The fuel oil generation in the United States increased by 29% year-on-year (reaching a new high since 2024), the sales of diesel generators in Europe increased by 22% month-on-month, and the proportion of "replenishment demand" in short-term crude oil consumption accounted for 18%, verifying the irreplaceability of crude oil in energy security.
The cost of biofuels is high, and the substitution effect has significantly weakened
The prices of global palm oil and soybean oil rose by 21%-25% due to drought in Southeast Asia, the production cost of biodiesel exceeded $88 per barrel, far exceeding the current crude oil price. The production of biodiesel in the United States decreased by 15% month-on-month, and the blending ratio of biofuels in Europe dropped from 8% to 6.5%. More importantly, the supply of biofuel raw materials is limited (global vegetable oil inventory decreased by 9%), and it is difficult to expand the scale of substitution with crude oil in the short term, and the share of crude oil in the transportation fuel sector has been consolidated.
Crude Oil Trading Strategy for Today
buy:59.5-60
tp:60.5-601
sl:59

Crude Oil Trading Strategy for TodayGeopolitical Risks: Structural imbalances persist, with short-term disturbances being the main factor
The conflict between Russia and Ukraine has entered its fourth year. Russia's crude oil has doubled its share in the Asian market through the "shadow fleet" (487 vessels) and Indian refineries (processing 1.8 million barrels per day), with the price difference between Urals and Brent narrowing to $15 per barrel. The pulse-like impact of the conflict on oil prices has weakened, but there is still a possibility of a "black swan" event - if Russian energy facilities are attacked, it could lead to a 2-3 million barrels per day supply gap, and oil prices could exceed $150. Additionally, the advancement of the Gaza ceasefire agreement and the restoration of shipping order in the Red Sea have reduced the short-term geopolitical premium, but potential risks such as the situation in the Middle East and Iran sanctions have not been eliminated, which may trigger short-term price fluctuations.
The core contradiction in the current crude oil market is the "mid-term supply surplus" versus "short-term marginal improvement (demand differentiation + interest rate cut expectations + geopolitical disturbances)". The price of $59.50 is in the "bottom support zone + policy sensitive zone", making it suitable to adopt a combination strategy of "short-term catching rebounds, medium-term controlling risks" - using short-term marginal variables to earn short-term gains, while hedging the downward risks brought by the medium-term surplus through option tools.
Crude Oil Trading Strategy for Today
buy:59-59.5
tp:60-60.5
sl:58.5

WTI – Bearish Retest of Broken SupportWTI has broken below a key support zone (highlighted in purple) and is currently pulling back into this same zone.
This area may now act as new resistance.
If price rejects this zone, we may see continuation toward the next major support level around 57.93.
The overall momentum is bearish, and the current upward leg looks corrective rather than impulsive, which supports the continuation scenario.
Trade Plan:
• Entry: After rejection signs inside the purple zone
• Stop Loss: Above the purple zone / recent swing high
• Take Profit: 57.93 area (blue level)
Bias:
Bearish continuation as long as price remains below the purple zone.
Logic:
This is a classic break → pullback → continuation structure.
If price fails to close back above this zone, sellers remain in control and the next bearish leg can unfold toward 57.93.

Crude oil's downward space is expandingDue to a significant increase in U.S. crude oil inventories, WTI prices have extended their decline.
In the short term, crude oil’s trend saw a seesaw battle between bulls and bears near the lower edge of the range, with frequent shifts in momentum. Eventually, the bears prevailed, sending prices lower. The moving averages are in a bearish alignment, indicating an objectively downward short-term trend.
Oil prices have broken below the 60 support level. It is expected that crude oil’s intraday trend will continue to expand downward. And the short-term support is 58.5,If it breaks below 58.5, focus on the support level at 57.5, while resistance above is at 60.8.
Buy 58.5 - 58.8
SL 58
TP 59.3 - 59.8 - 60.3
Sell 60.5 - 60
SL 61
TP 59 - 58.5 - 58

Crude Oil Trading Strategy for TodayIncreased policy stimulus in emerging markets, with greater certainty in the increase in demand.
Policy-driven procurement emerges as a new engine: The Indian government, in order to ensure the expansion of refineries (with an additional annual capacity of 20 million tons by 2025), launched the "Strategic Reserve Supplement Plan for Crude Oil". In the first half of November, the import volume increased by 16% year-on-year (reaching 5.4 million barrels per day), and it signed a 3-year long-term supply agreement with Saudi Arabia (locking an additional 1 million barrels per day). At the same time, Indonesia and Vietnam simultaneously introduced "Refinery Tax Reduction Policies", driving the import volume of crude oil in Southeast Asia to increase by 12% month-on-month. The policy benefits directly transformed into rigid procurement demands, breaking the single narrative of "weak demand".
Recovery of consumption scenarios exceeded expectations: Indian diesel consumption increased by 7.2% due to the acceleration of infrastructure investment (road and port projects increased by 25% year-on-year), while the demand for aviation kerosene in Southeast Asia increased by 9% month-on-month due to the recovery of tourism (international flight volume recovered to 110% of 2019). The demand for transportation fuels and chemical raw materials (with the commissioning of a new 1.2 million-ton ethylene plant in China) formed a "dual-wheel drive", and the expected monthly increase in global crude oil demand in November was 800,000 barrels per day, far exceeding the market expectation of 500,000 barrels per day.
Crude Oil Trading Strategy for Today
buy:59.5-60
tp:60.5-61
sl:61.5

Oil analysisAfter oil dropped to 56 dollars per barrel, it managed to climb back up to 62 dollars and hit a resistance there, and at the moment it has reached 59 dollars.
If it can break the support it is currently reacting to, a risky position down to 57.800 could be taken.
At this moment, besides this scenario, I don’t see any other opportunity until the chart gives a bullish signal.

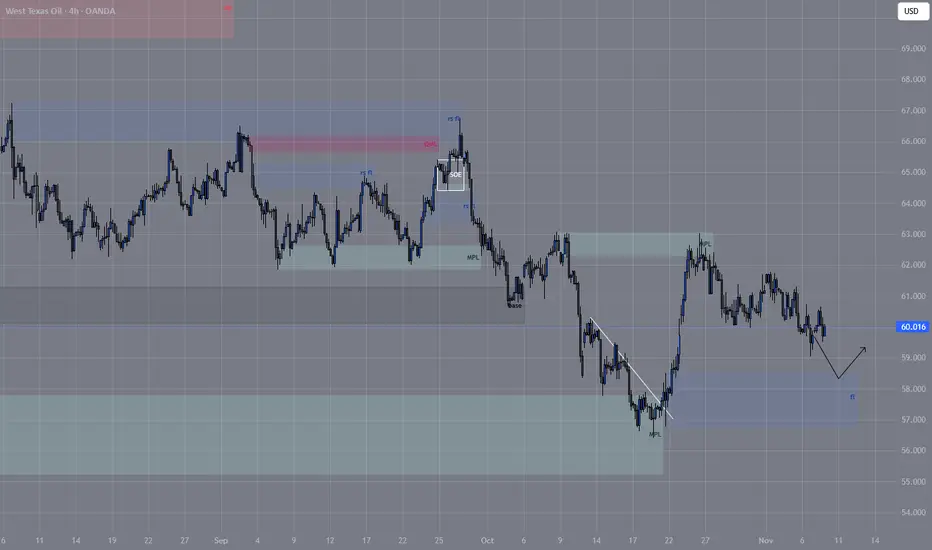
wti 1h🔹 Overall Outlook and Potential Price Movements
In the charts above, we have outlined the overall outlook and possible price movement paths.
As shown, each analysis highlights a key support or resistance zone near the current market price. The market’s reaction to these zones — whether a breakout or rejection — will likely determine the next direction of the price toward the specified levels.
⚠️ Important Note:
The purpose of these trading perspectives is to identify key upcoming price levels and assess potential market reactions. The provided analyses are not trading signals in any way.
✅ Recommendation for Use:
To make effective use of these analyses, it is advised to manually draw the marked zones on your chart. Then, on the 5-minute time frame, monitor the candlestick behavior and look for valid entry triggers before making any trading decisions.

Crude Oil Trading Strategy for TodayMarginal improvement signals have emerged, and consumer resilience exceeded expectations.
The demand for replenishment in Asia has been concentratedly released: In November, China's petrochemical refineries received an additional 15 million tons of crude oil import quotas (approximately 300,000 barrels per day). In the first half of November, China's crude oil imports increased by 12% year-on-year, and the purchasing focus shifted to WTI-related varieties, which led to an increase in U.S. crude oil export volume from 5.4 million barrels per day to 5.8 million barrels per day (reaching a new high since October), forming a "import - export" positive cycle.
Heating oil demand started earlier than expected: In the first ten days of November in North America, the temperature was 3-5℃ lower than the average. The price of heating oil futures in the New York port rose by 4.2% in a week, and the output of heating oil by refineries increased by 8% month-on-month, which led to the continuous reduction of distillate oil inventories and indirectly stimulated the demand for crude oil purchases.
Crude Oil Trading Strategy for Today
buy:59.5-60
tp:60.5-61
sl:61.5

WTI Crude resistance at 6160The WTI Crude Oil is currently trading with a bearish bias, aligned with the broader downward trend. Recent price action shows a retest of the longer term support, suggesting a temporary relief rally within the downtrend.
Key resistance is located at 6160, a prior consolidation zone. This level will be critical in determining the next directional move.
A bearish rejection from 6160 could confirm the resumption of the downtrend, targeting the next support levels at 5946, followed by 5845 and 5780 over a longer timeframe.
Conversely, a decisive breakout and daily close above 6160 would invalidate the current bearish setup, shifting sentiment to bullish and potentially triggering a move towards 6215, then 6300.
Conclusion:
The short-term outlook remains bearish unless the WTI Crude price breaks and holds above 6160. Traders should watch for price action signals around this key level to confirm direction. A rejection favours fresh downside continuation, while a breakout signals a potential trend reversal or deeper correction.
This communication is for informational purposes only and should not be viewed as any form of recommendation as to a particular course of action or as investment advice. It is not intended as an offer or solicitation for the purchase or sale of any financial instrument or as an official confirmation of any transaction. Opinions, estimates and assumptions expressed herein are made as of the date of this communication and are subject to change without notice. This communication has been prepared based upon information, including market prices, data and other information, believed to be reliable; however, Trade Nation does not warrant its completeness or accuracy. All market prices and market data contained in or attached to this communication are indicative and subject to change without notice.


USOIL SELLElliot wave analysis sell
Price appears to have completed a flat corrections.
I have added to my initial sell trade, SL and TP as specified.

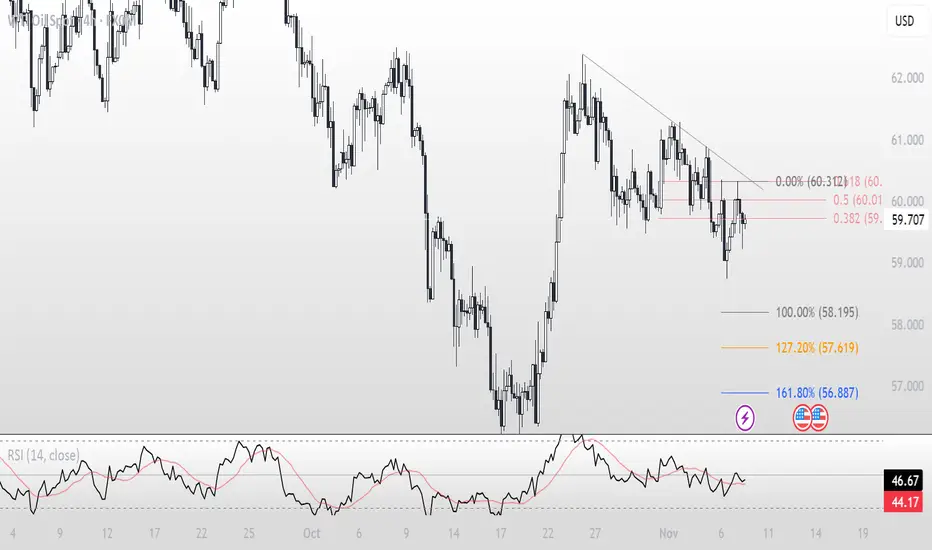
USOIL BULLS ARE STRONG HERE|LONG
USOIL SIGNAL
Trade Direction: long
Entry Level: 60.06
Target Level: 60.65
Stop Loss: 59.67
RISK PROFILE
Risk level: medium
Suggested risk: 1%
Timeframe: 2h
Disclosure: I am part of Trade Nation's Influencer program and receive a monthly fee for using their TradingView charts in my analysis.
✅LIKE AND COMMENT MY IDEAS✅

Crude Oil Trading Strategy for TodayU.S. crude oil inventories have exceeded expectations for three consecutive weeks of decline, easing the pressure in Cushing.
The latest EIA data (as of the week ending November 1) shows that U.S. crude oil inventories decreased by 5.8 million barrels on a month-on-month basis (expected - 2.2 million barrels), with the scale of decline in the past three weeks exceeding market expectations, and a cumulative reduction of 12.6 million barrels. The core Cushing region's inventories ended the previous four weeks of consecutive increases and decreased by 1.2 million barrels on a month-on-month basis (to 35 million barrels, 8% lower than the 5-year average), shifting from "accumulation pressure" to "tight balance". This data directly dispelled market concerns about "more than 2 million barrels per day of accumulation in the fourth quarter", and $61 became the strong bottom range supported by inventories.
Global major consumption areas' inventories have improved simultaneously, verifying the resilience of demand
European ARA region's crude oil inventories dropped to 43 million barrels (a 12% year-on-year decrease), China's commercial crude oil inventories decreased by 3.5 million barrels on a month-on-month basis (with the start of refinery replenishment demand), and Japan's crude oil inventories also decreased by 5% compared to the previous month. Global major consumption areas' inventories have simultaneously declined, confirming that terminal demand is not "unilaterally weak", but rather shows "overall resilience under regional differentiation", providing cross-regional supply and demand support for oil prices.
Crude Oil Trading Strategy for Today
buy:60.8-61
tp:61.8-62.5
sl:60.4

Crude Oil Trading Strategy for TodayPrecise control of production increase pace, directly addressing the pain point of the demand off-season
On November 2nd, the eight core member countries of OPEC + reached a key decision: in December 2025, they will maintain a slight increase of 137,000 barrels per day, but in the first quarter of 2026, they will completely suspend further production increases. This decision precisely hedged against the risk of "a record 4 million barrels per day surplus in 2026" as warned by the IEA. By freezing the supply increase in the weakest demand quarter (with demand possibly dropping by 2-3 million barrels per day in February and March), it forms a substantive "price protection and stabilization measure". Compared with the previous market concerns about "continuous production increase", the policy shift brought about a difference in expectations, providing strong support for oil prices. $60 became the implicit bottom line for the OPEC + policy to support the market.
Crude Oil Trading Strategy for Today
buy:60.8-61
tp:61.8-62.5
sl:60.4
